


With 150 careers under her (very tiny) belt, Barbie is becoming an entrepreneur. Outfitted with a business-savvy wardrobe and accessories, Entrepreneur Barbie is making a bid for relevance in a market whose consumers keep getting older younger and abandoning their dolls for digital devices.
But can Entrepreneur Barbie reverse the slide in sales of Mattel’s leading brand?
Neither appearing in Sports Illustrated’s swimsuit issue nor joining the Girl Scouts earlier this year did the trick for the 55-year-old Barbie (although both marketing moves generated plenty of controversy). Last month Mattel announced that sales for the Barbie brand were down 15% worldwide in the second quarter, the third straight quarter to see double-digit losses.
As with many iconic American brands, Barbie is no longer made in the USA. Mattel has its own manufacturing facilities in China, Indonesia, Malaysia, Mexico, and Thailand. So Datamyne import data can supply an early indicator of how the Barbie brand is faring in the US market.
Based on a review of Datamyne’s bill of lading data, most Barbie dolls and related merchandise come off assembly lines in China and Indonesia, as this breakout of first-half 2014 shipments by country of origin shows:
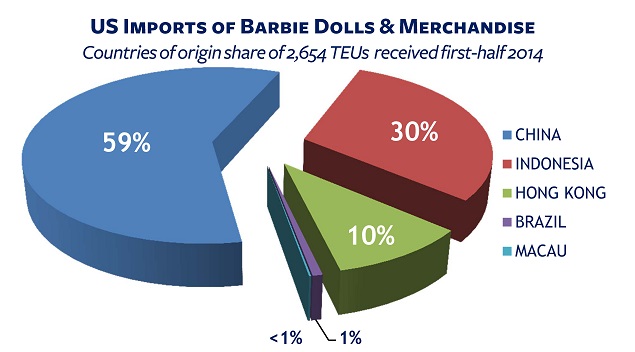
The imports include dolls, doll fashions and accessories. We totaled the Barbie bills of lading by HS code and found, in addition to the expected toys – HS95, shipments of footwear – HS64, furniture – HS94 … and cultured pearls – HS71. (Barbie was a Pearl Princess last year.) When we clicked through to the individual bills, pharma products-HS30 from Brazil turned out to be Barbie bandaids.
The data on consignees and shippers confirms that Barbie imports are largely “related-party trade” – e.g., Mattel bringing product into the US from its offshore affiliates. Here are the top 5 parties on both sides of this trade by volume:
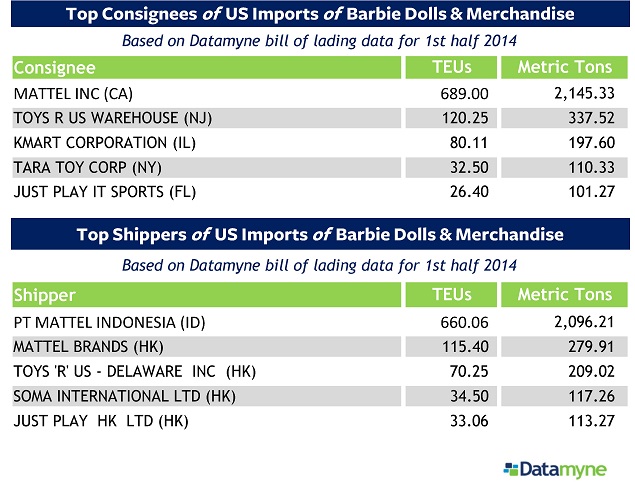
Note Toys ‘R’ US, also engaged in related-party trade. In 2013, retailer accounted for $0.7 billion in sales of Mattel products and one of Mattel’s top three customers (the others are Wal-Mart and Target).
The real test for Entrepreneur Barbie lies ahead, during the peak retail sales season of year-end holidays. Based on its holiday sales forecasts, Mattel ramps up production and builds up inventory during the first three quarters of the year.
Here’s a comparison of first-half shipment volumes 2011-2014.

The downtrend in May – June 2014 volumes is worrisome for Entrepreneur Barbie, especially since many importers pushed shipments out earlier in advance of the West Coast longshore union contract’s expiration at the end of June and potential labor-related port disruptions.
We’ll keep watching the data and share the third quarter numbers here in October.
If you’d like to track the data on Barbie – or any other consumer product in trade – on a more frequent basis (we release US import shipment data 24 hours after arrival), just ask us.