Vanilla prices are spiraling past silver in the global marketplace, as limited supply is outstripped by growing demand for all-natural ingredients. Worries over this year’s harvest in Madagascar may nudge vanilla prices – and the cost of this summer’s ice cream cones – to new heights.
As of the end of March, vanilla prices had reached $600 per kilogram, well past silver selling at just above $530/kg, as the Financial Times reports. Vanilla prices had previously reached the record $600/kg last year as a cyclone damaged the crop on Madagascar. But a favorable forecast on the 2018 harvest had eased prices to below $550/kg as the year wound down.
Now vanilla prices are on the rise again, lifted by fresh worries about the weather in Madagascar, which holds a near monopoly on vanilla.
Why Madagascar’s Weather Forecast Lifts Vanilla Prices
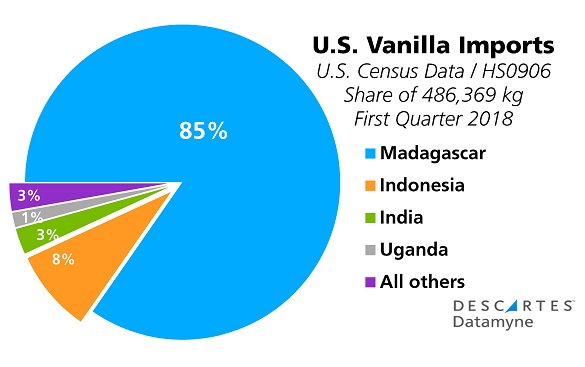
From 75%-80% of the world’s supply of vanilla is grown in Madagascar. Almost 85% of the vanilla imported by the U.S. comes from the island nation off the southeast coast of Africa.

Not so many years ago, vanilla prices were stuck at $20/kg. Madagascan farmers abandoned the labor-intensive spice – which is derived from the pods of orchids that must be pollinated, harvested, processed, sorted and graded by hand – for more profitable crops. This put a dent in available supplies of natural vanilla, but the slack was taken up by synthetic vanillin.
Tastes, however, have since changed. Consumers want, and food companies have committed to products made from “all-natural” ingredients. (Ironically, the Economist notes, food companies re-introducing natural vanilla are also reworking their recipes to mimic the synthetic tastes to which their consumers have become accustomed.)
In 2016, rising demand coupled with a poor harvest on Madagascar pushed vanilla prices beyond $100/kg.
Vanilla Prices Spiral … and So Do U.S. Vanilla Imports
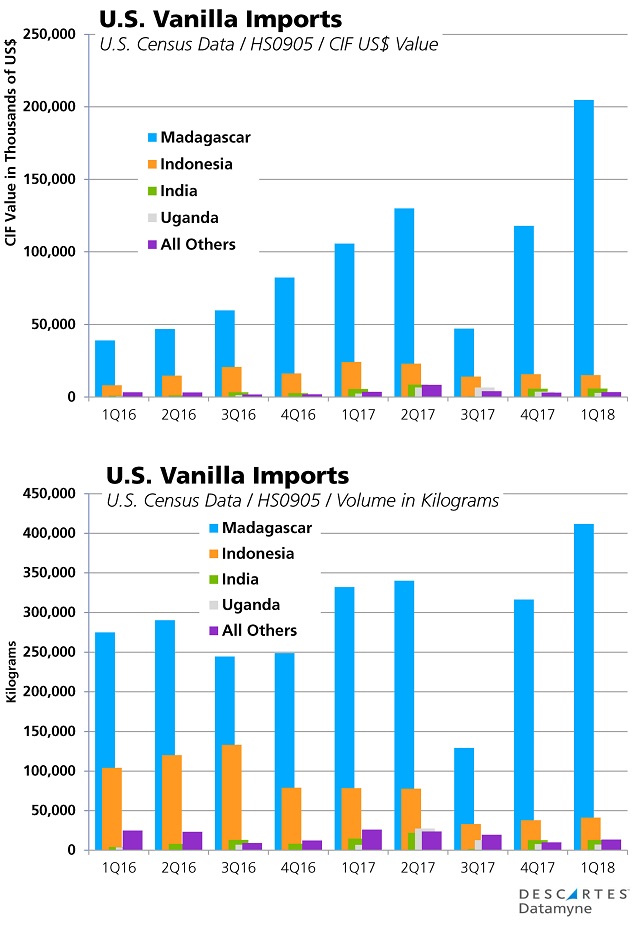
So far this year, the volume of U.S. vanilla imports has continued to climb. The first quarter’s volume was up 6.3% compared with first-quarter 2017, and 18.3% over first-quarter 2016. This despite the hefty price increase that has driven the value (in the chart below, CIF value) of first-quarter vanilla imports up 64% over the same period in 2017, and a whopping 351% over 2016.
Here’s the quarterly trade data on U.S. vanilla imports from first-quarter 2016 through first-quarter 2017:

Note that, as U.S. vanilla imports have grown, so has U.S. dependence on Madagascar for the pricey ingredient. Indonesia and Uganda, countries that in 2011 accounted for, respectively, 12% and 10% of U.S. vanilla imports, have also had disappointing vanilla crop yields in recent years.
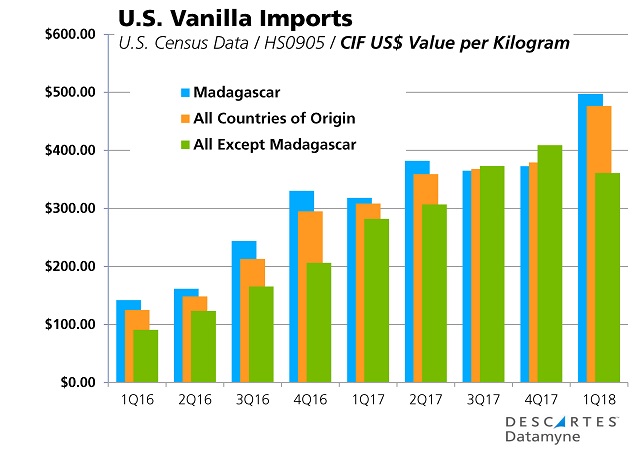
Based on our trade data, here’s a summary of the surge in CIF US$/kg of U.S. vanilla imports over the last nine quarters:

Now that vanilla is a lucrative crop, farmers in Madagascar, as well as Indonesia, Uganda, and India, are eager to boost production. But, as any farmer will tell you, it takes time to grow and harvest a new crop. Meanwhile, demand for vanilla shows no signs of being dampened by spiraling vanilla prices.
Related:
From our blog:
From our trade content solutions:
- Descartes Datamyne maritime bill of lading data captures the transactional and logistical details of U.S. import trade in vanilla – including vanilla importers, shippers, and notify parties, cargo values and volumes. Ask for a demo.
- Our Market InsightTM custom-built business intelligence solutions mine trade data for details of buyers, sellers, cargos (including product grades and descriptions), ports of origin and arrival, that yield early indicators of where markets are heading. See a sample or ask for a personalized demo.


