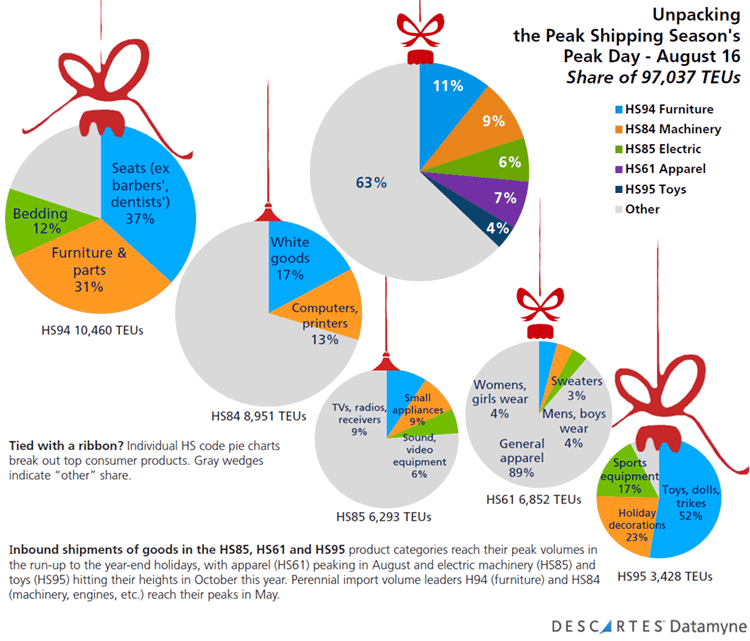
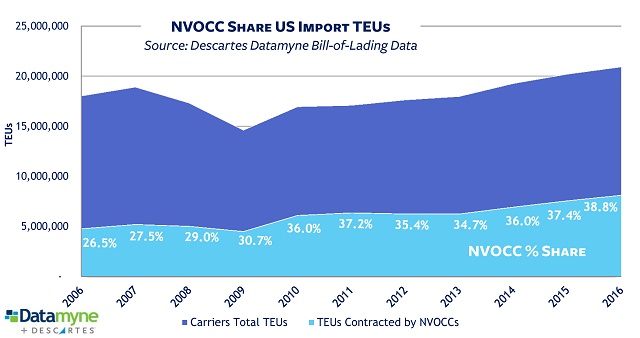
NVOCCs again laid claim to a record 38.8% share of US import shipping volumes in 2016, with a growth rate in TEUs that outpaced the rate of carriers as a whole.
Our bill-of-lading data shows that ocean carriers brought 20,953,723 TEUs in imports to US ports last year; of these, 8,127,694 TEUs were contracted by non-vessel operating common carriers – or NVOCCs. TEUs – or 20-foot equivalent units – are the standard measure of containerized cargos.
The NVOCC US import TEU share has climbed steadily from 26.5% in 2006 share to 38.8% in 2016.
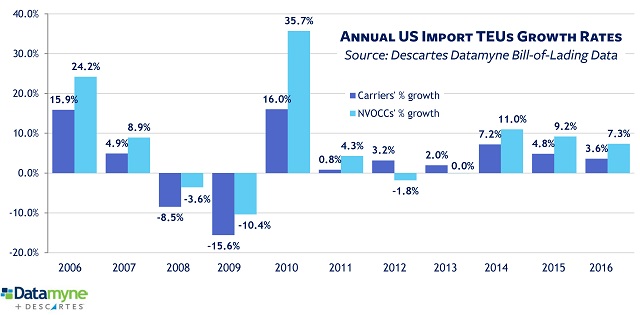
Total US maritime import volumes measured in TEUs increased 3.6% in 2016 over 2015. NVOCC TEUs increased 7.3% in 2016 compared with the year before. Both rates were off 2015’s growth of 4.8% for carriers overall and 9.2% for NVOCCs. As the graph below shows, NVOCCs also made a bigger percentage gain in TEUs in 2014.
Hanjin, M&As Help Boost NVOCC US Import TEU Share
The ill wind of Hanjin Shipping’s bankruptcy last August seems to have blown shippers into the arms of NVOCCs.
In addition, the latest round of mergers, acquisitions and new alliances among container ship lines has infused still more complexity and confusion into an already turbulent market, according to this industry outlook from Alix Partners. Last year there were four major alliances, and this spring there will be three. 2M, Ocean Alliance, and THE Alliance will comprise 11 shipping operators and manage more than 70% of the container capacity on the Asia-to-Europe and transpacific routes in 2017.
The Wall Street Journal reports cargo owners are seeing up to 20% fewer containership sailings across main trade routes and a 10% drop in port calls since the introduction of bigger vessels, known as Triple Es, favored by the alliances.
The thinking is that these ill winds for shippers will create more business opportunities for NVOCCs who can help them deal with unfamiliar carriers, route changes and other new challenges of moving cargos in a timely, cost-efficient way.
Sri Laxmana, director of global forwarding ocean services at C.H. Robinson, recently told American Shipper that the NVO industry’s growing share of overall global volumes is due, in part, to technological innovation by forwarders, the software industry and startups, all of which are providing solutions shippers don’t get directly from carriers.
Related:
- Download from our free report library: Top 20 NVOCCs in US imports based on yearend 2016 volume data + breakout of TEUs by top 3 carriers
- Our new Lead Generation tool for freight forwarders and customs brokers helps identify high-value prospects for logistics services. Learn more >
- Our Maritime Market Insight dynamic reports on US import-export shipping via dashboards designed for logistics. Learn more >