


Market watchers who bet on a post-pandemic commodities supercycle are looking like the smart money. Resurgent demand chasing short supply is driving prices to premium levels across global markets. Among the hottest sectors, metals saw prices take off from March lows and reach heady heights through much of October. Our global trade data from Descartes Datamyne, reveals mark-ups for iron & steel, copper, lead, and tin.
The coronavirus has been and remains a prime mover in metals markets. First, pandemic-triggered shutdowns depressed production. After a year of destocking, supply chains would be strained just to get on top of pent-up demand.
But there’s more: Even as stay-at-home orders helped increase demand for consumer electronics with the knock-on result of a microchip shortage, the scramble for electronics metals such as copper and (somewhat unexpectedly) tin is raising prices and fears of scarcity. Government plans to spark post-pandemic economic recoveries with major investments in infrastructure and renewable energy promise to fuel unprecedented demand for industrial metals.
Adding to metal buyers’ sense of urgency: signs that the current global logistics crisis may persist well into 2022 and worries that an energy crunch will further pinch production.
Climbing Costs Hit U.S. Imports and Exports of Metals
Descartes Datamyne Census trade data shows how the climbing cost of metals is impacting the U.S. market. Here’s a year-over-year comparison of the value and volume of U.S. exports of the metals grouped under Section XV of the Harmonized System of tariff codes in August:
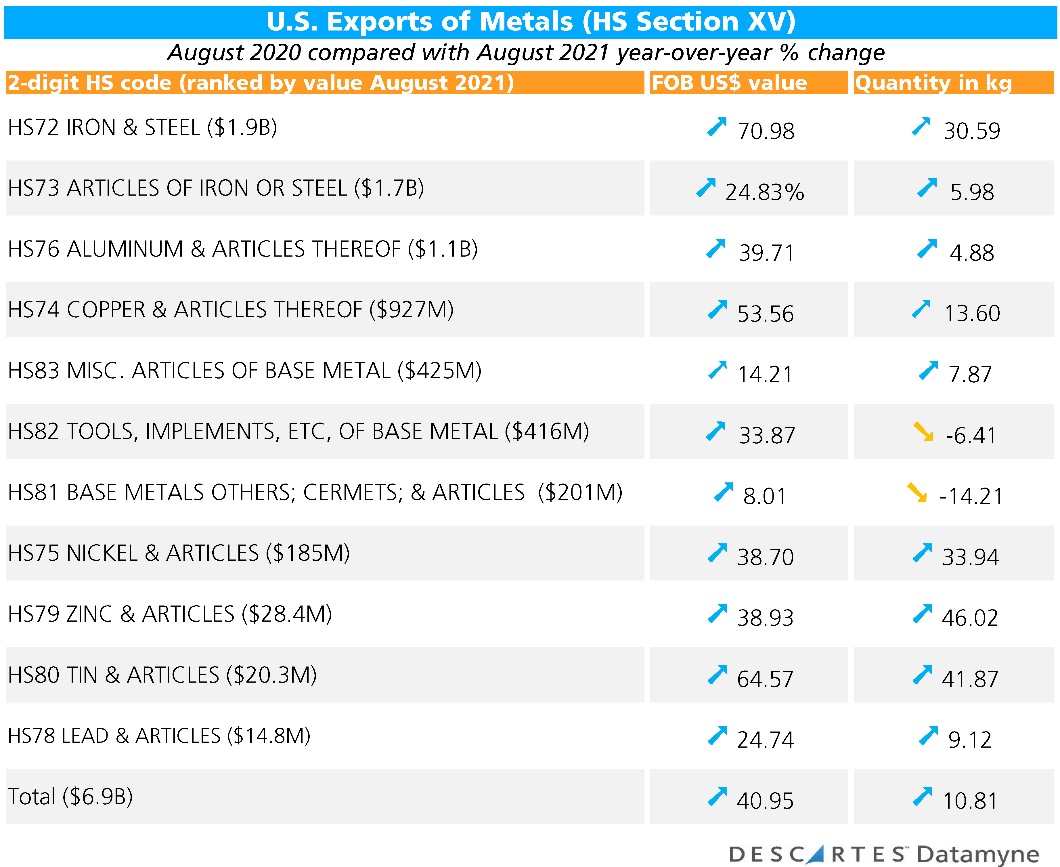
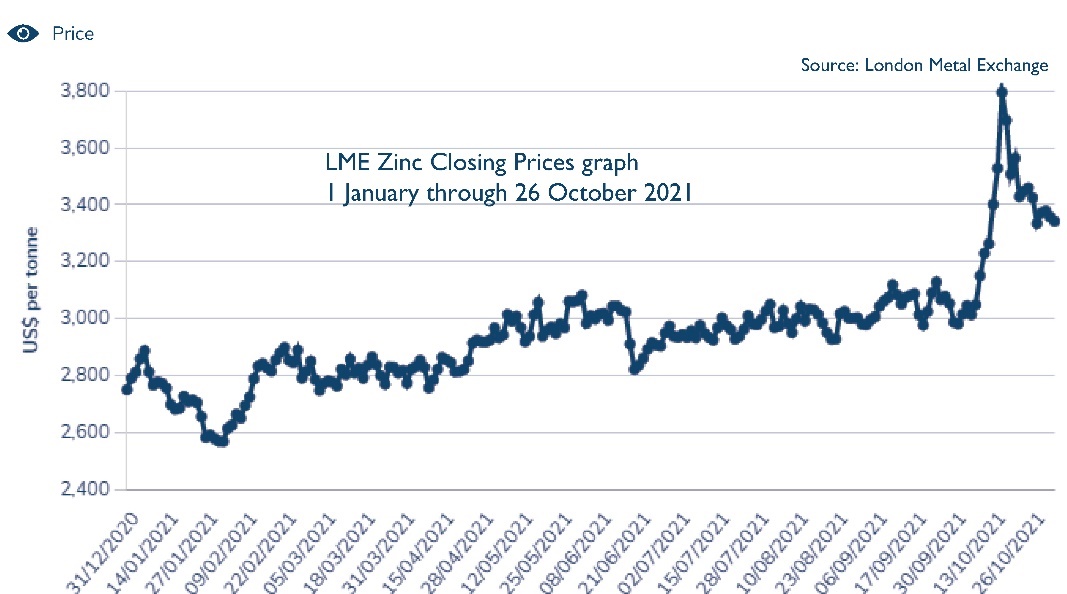
For the most part, the gains in export trade dollar value are greater in magnitude than the gains in quantity shipped – or, in the cases of base metal tools [HS82] and base metals, others [HS81], are achieved despite a downturn in quantity. In other words, exporters were able to sell less metal for more money. The exception is zinc. As the London Metal Exchange graph below shows, the price of zinc has hovered around $3K/ton since May, with a big surge in October.
Similarly, the y-o-y comparison of August’s imports of metals shows the growth in price outpacing volume increases, with the exception of base metals, others [HS81].
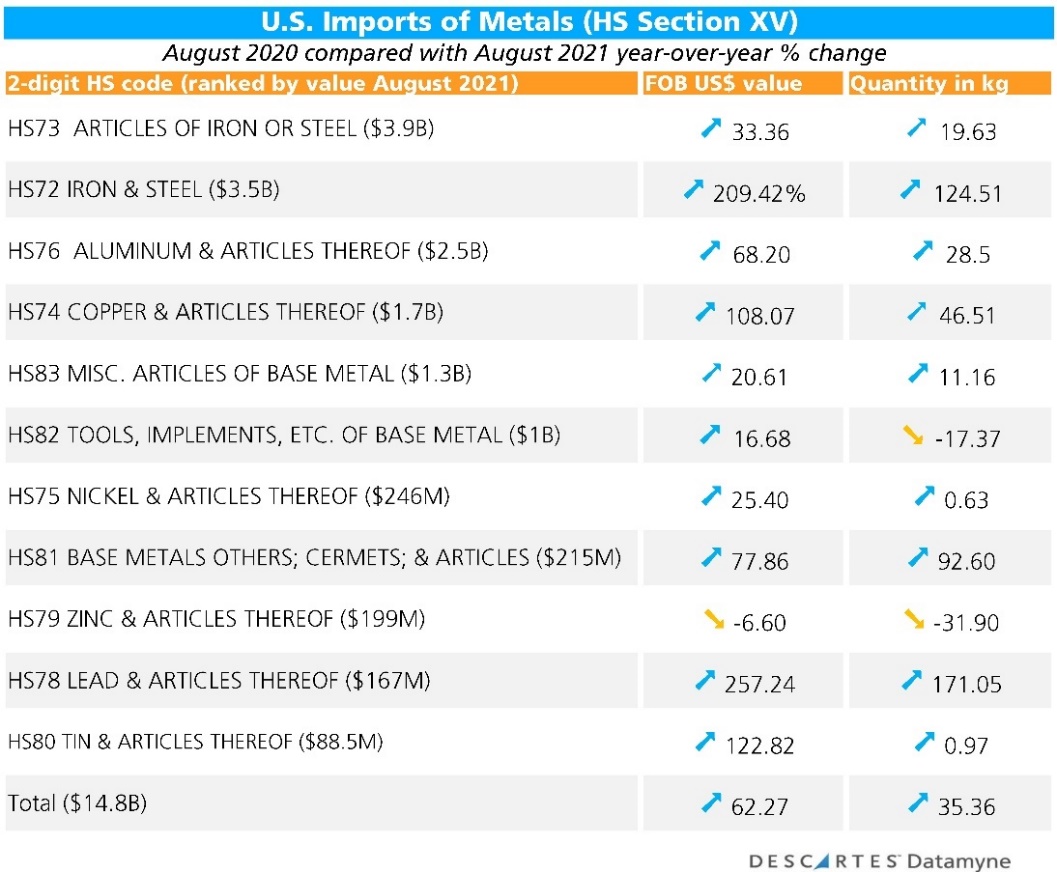
As side-by-side comparison of the exports and imports tables makes clear, the U.S. is a net importer of HS Section XV metals. These imports, however, are not the only metal resources available to the U.S. In fact, the U.S. Geological Survey (USGS) estimates that imports generally accounted for a minority share of the copper, iron & steel, and lead consumed by U.S. industry up through 2019. Those shares plummeted in 2020, hardly a representative year, as domestic stocks were tapped to supply reduced industrial activity.
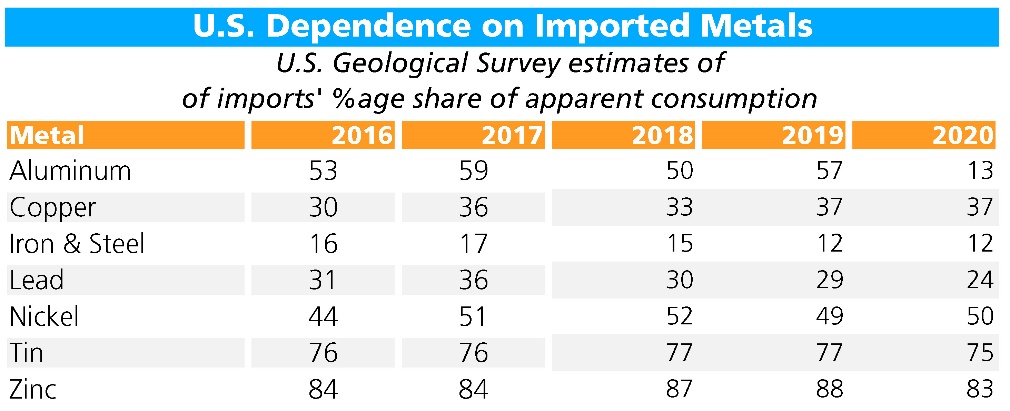
The U.S. relies on imports to meet a substantial share (around half, on average) of its needs for aluminum and nickel. Dependence on imports rises markedly for tin (77% of consumption in 2019) and zinc (88%).
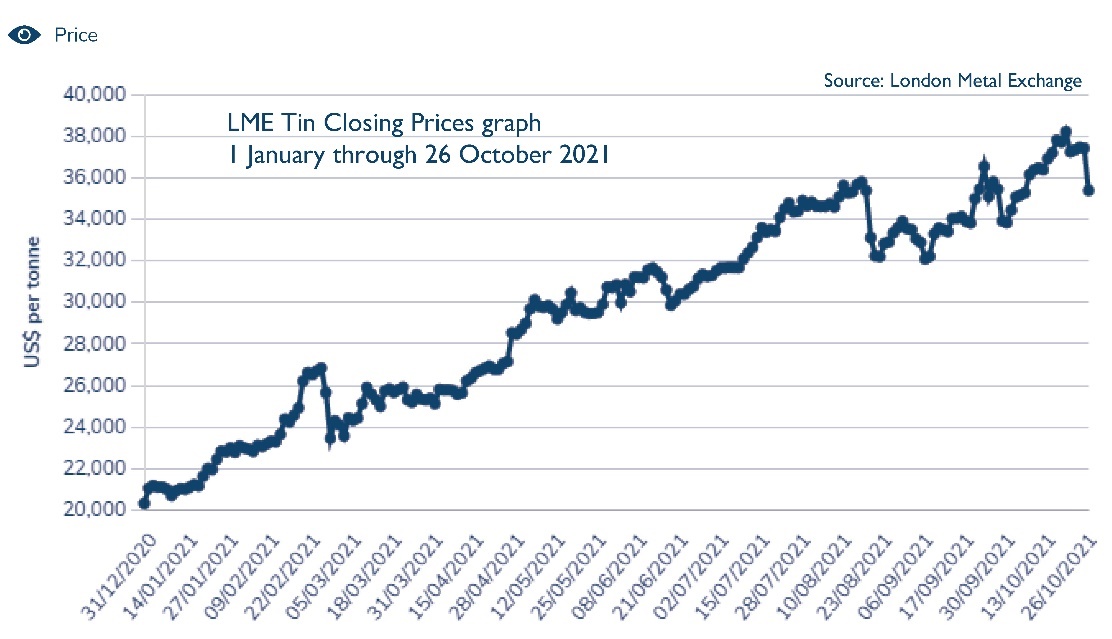
Tin Prices Reach Record Heights
Tin is 2021’s metal market superstar, with prices rising to record levels, thanks in large part to surging demand for smartphones, laptops and iPads during the pandemic, as reported by the Financial Times, while supply chain disruptions have restricted available stocks. Contrast tin’s price climb, as charted by the LME below, with zinc’s flatter price growth trajectory since January.
Descartes Datamyne Census trade data over the 12-month period through this September shows tin’s price surge in global markets working its way through U.S. exports and imports.
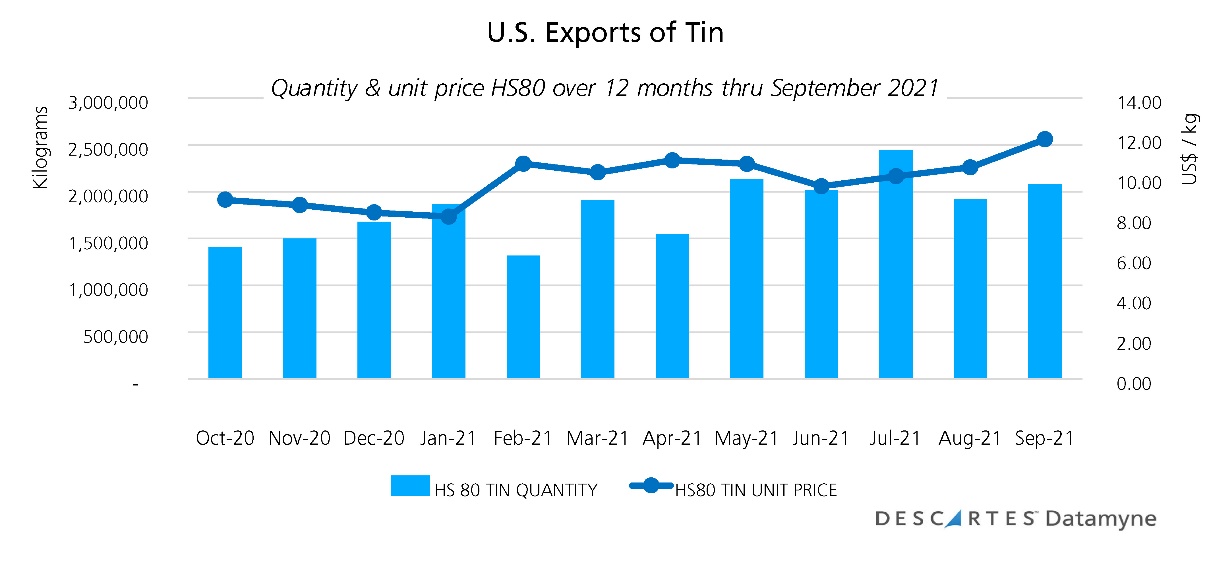
As the chart above illustrates, the price commanded by U.S. exports of articles of tin [HS8007] appears to rise as volumes fell from the beginning of 2021 through July, when the unit price declined relative to quantity shipped. A review of our bill-of-lading export data indicates that a major share of maritime exports in February (79% by value, 51% by volume) were denoted “tin, unwrought” [HS8001]. The unfinished commodity would be more directly affected by the bump-up in the global metal market price. In July, in contrast, most U.S. tin exports (73% by value and 64% by volume) consisted of “articles of tin, others” [HS8007] – much of it shipped by a fabricator of industrial systems as revealed by the bills of lading. For these tin exports, a variable value-add for products that can range from model-car chassis to tin plate coils to engineered industrial systems, is a significant contributor to a unit price.
The same holds true for inbound trade. Below we offer a pair of charts. The first covers tin imports at the 2-digit HS level – that is, tin and articles thereof [HS80]. The Census data captures a Spring-time surge in the price of U.S. tin imports overall, with an abrupt drop in June. The second chart excludes imports denoted HS8007 to capture a smoother price climb over the 12 months through September 2021.
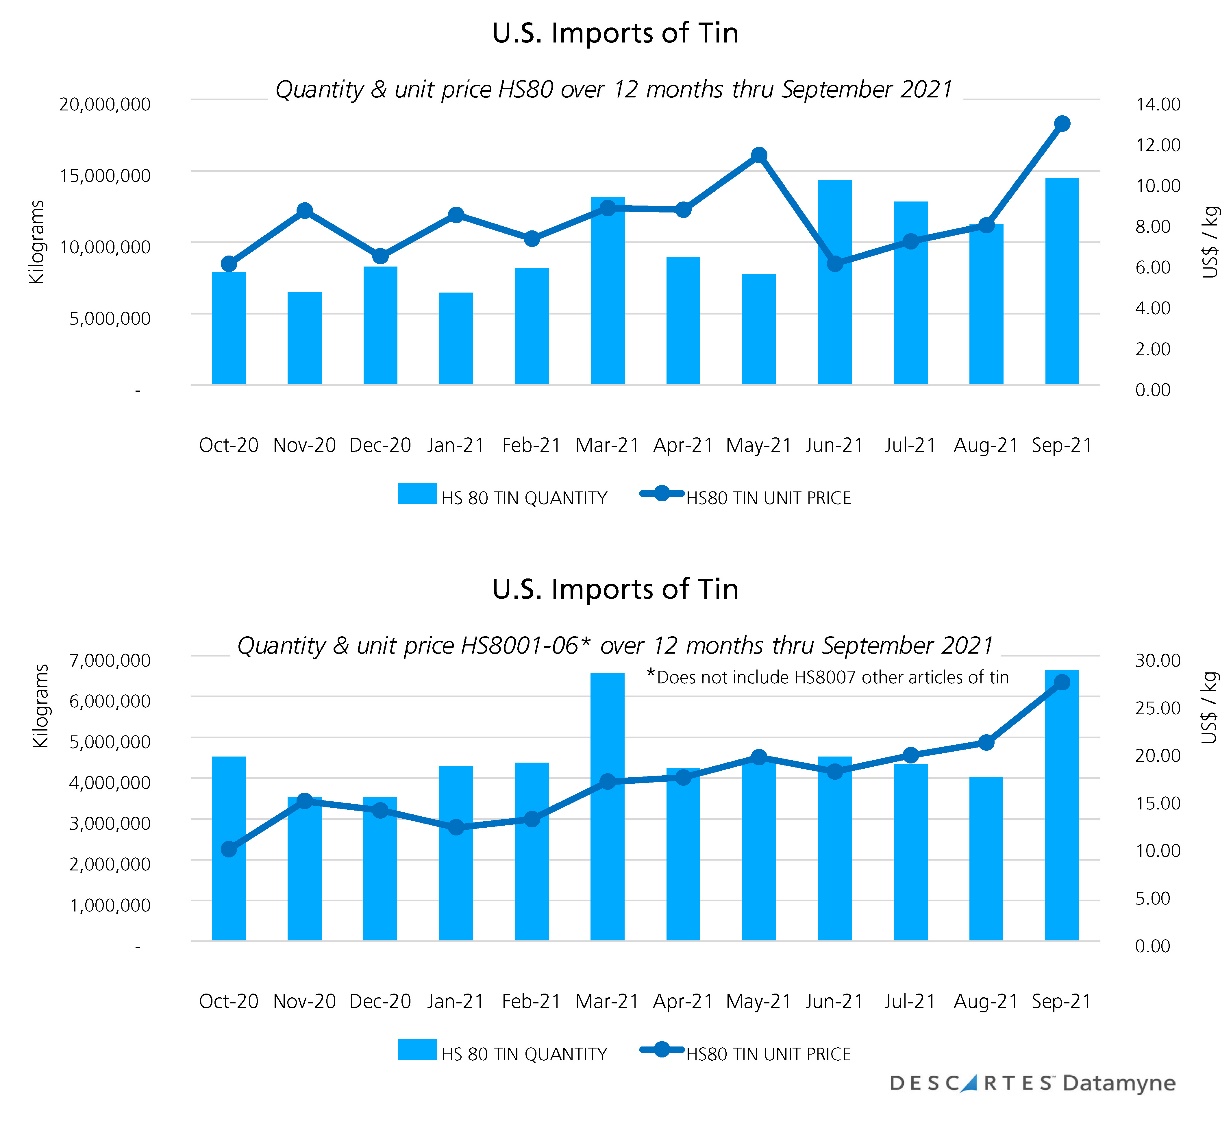
Again, our bill-of-lading data provides a granular view of the individual transactions that shape the trendlines. For example: A big inbound shipment of electrolytic tinplate coil transferring stock from one multi-national affiliate to its U.S. counterpart accounts for much of the price spike May imports in the top imports chart.
A note on U.S. imports’ share of domestic tin consumption, estimated at 75% in 2020 by the USGS: Starting in March and through August (fiscal yearend), the U.S. Defense Logistics Agency has released tin from the national stockpile to the U.S. market to assuage shortages in domestic supplies, the first release in 13 years, as reported in Fastmarkets Metal Bulletin.
Imports’ Share of U.S. Iron & Steel Market Declines
Beyond consumer electronics, the pandemic also boosted demand for canned foods and beverages and with it the price of tinplate.
With more containers coated in resins nowadays, use of tinplate had been in slow decline prior to COVID-19. Domestic production of thinner tinplate lagged demand, opening the way for greater reliance on imports. Still, tinplate remains a major consumer of tin in the U.S. By USGS calculations, 21% of U.S. tin usage is for tinplate, compared with 18% for chemicals and 15% for solder. In contrast, solder is the top global use of tin.
The impact of the tin price surge is detectible (albeit in fractions of a cent) in iron & steel [HS72], as these charts on U.S. trade in tin plated iron or steel [HS721012] show:
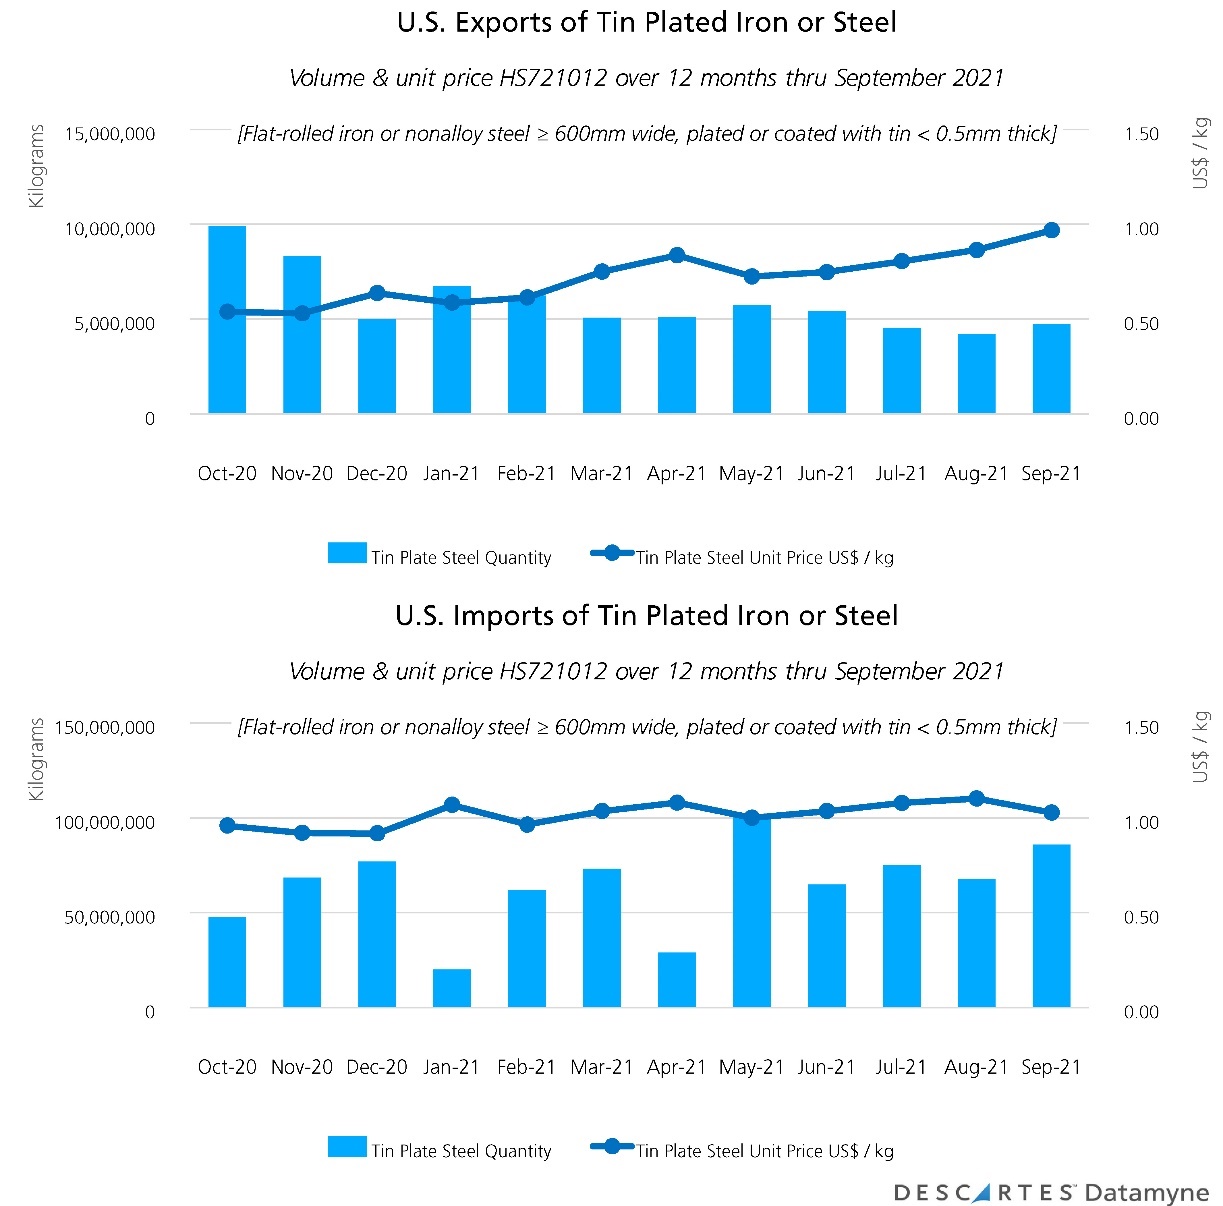
In tinplate, as in other metal products, the U.S. is a net importer. Indeed, it is the world’s No. 3 buyer of thin tinplate [HS721012], accounting for 17% of global imports by quantity, behind the Philippines with 19% share, and top-ranked Mexico’s 25% share this year through the third quarter, according to Descartes Datamyne global trade data. Japan leads global suppliers with 23% share, followed by China with 18%, and India with 7%.
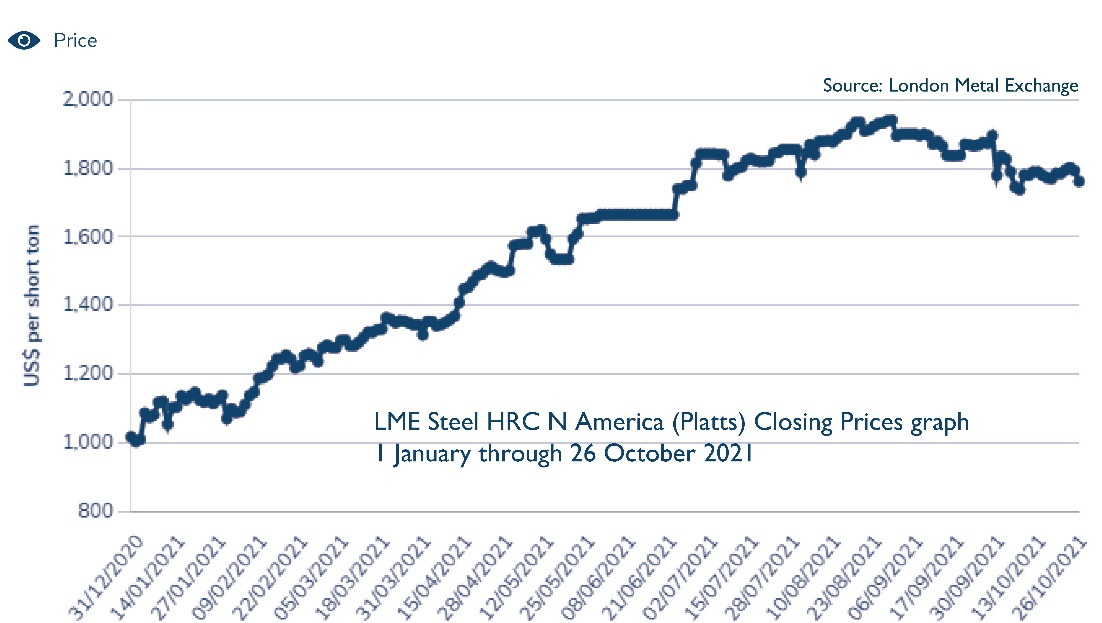
Of course, the price of tinplate is also a product of the prices of iron and steel, which also saw run-ups in price through spring and summer, as illustrated by LME price graph:
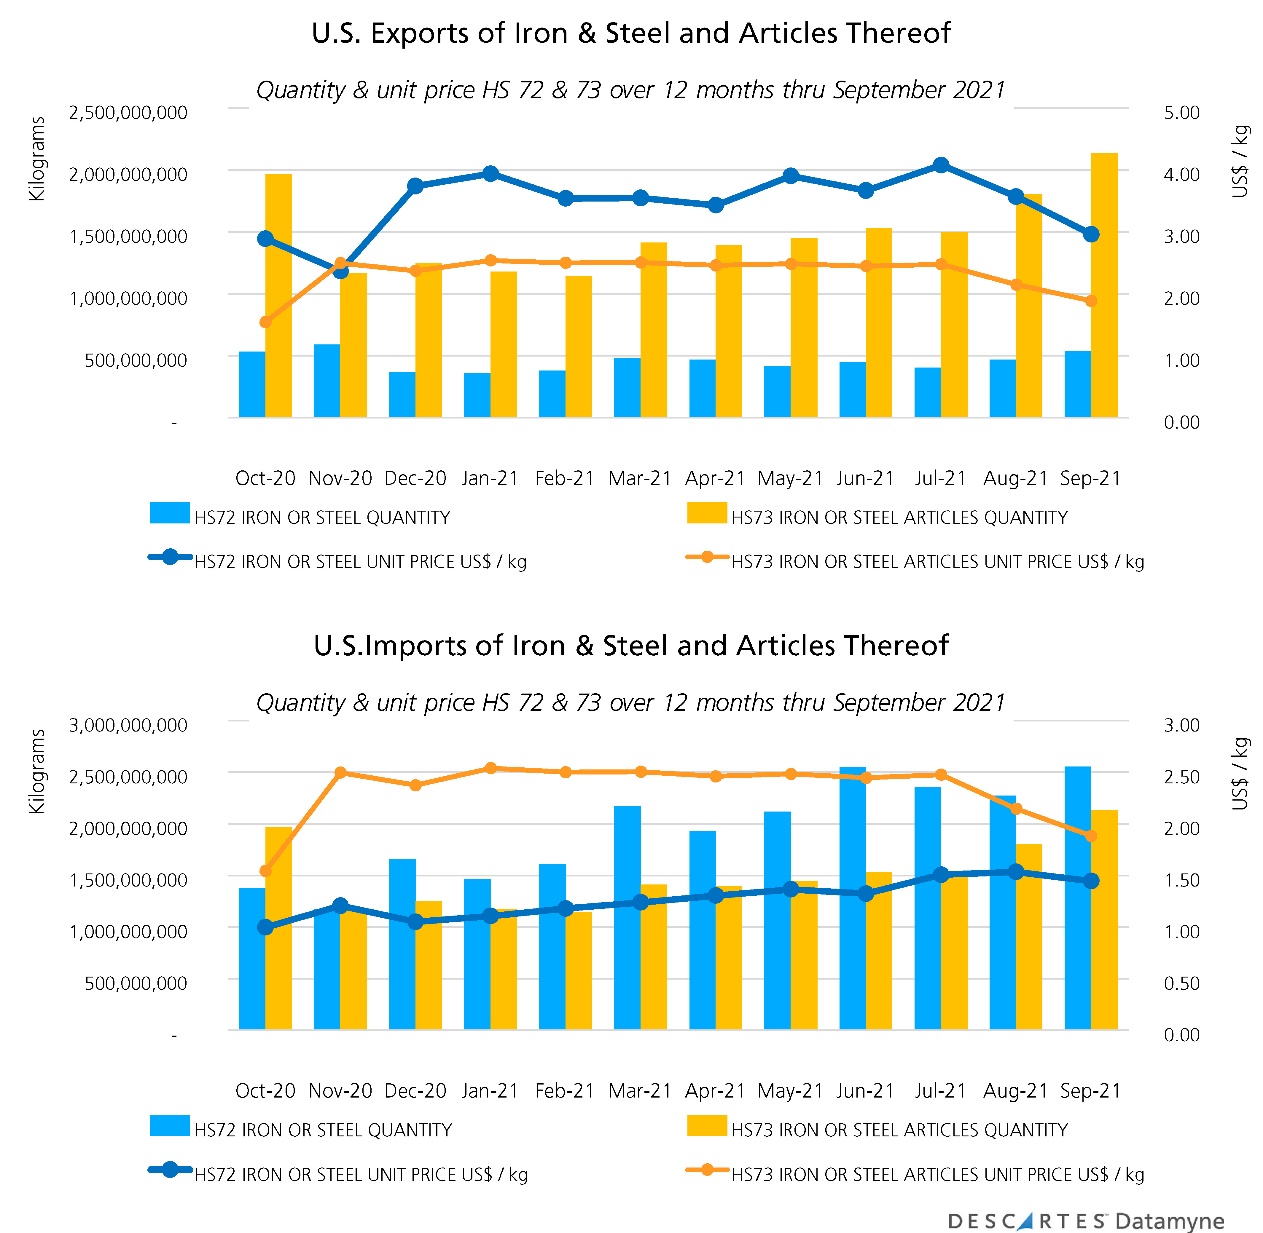
Descartes Datamyne Census data on U.S. trade in iron & steel [HS72] and articles thereof [HS73] reveals a flatter trajectory for the price of U.S. exports and imports of these metals over the 12 months ending in September, with a more pronounced decline at the finish:
The market dynamics for iron and steel are different than those of tin, however. Most notably, U.S. dependence on imports to meet its needs for iron and steel is modest compared with tin. The USGS pegs imports’ share of apparent consumption of steel at 12% in 2019, reduced from 17% in 2017. Importantly, that reduction was the objective of a program of U.S. tariffs sought by the domestic industry (as covered by this blog). Tinplate [HS721012, as well as HS721011 and HS721210] were among the products subject to high tariffs. One U.S. steelmaker, announcing plans to build a new mill, estimates imports’ share of the sheet steel market dropped to 13% in 2020, down from 19% in 2015, while finished steel imports fell to 18% from 29% in 2015.
Nonetheless, global metals prices inevitably influence those of domestic markets. Potential competition from steel producers abroad has been stifled by pandemic-related disruptions. China has vowed to cut back steel production, but market analysts project an 8-9% increase in output this year.
China’s next moves also figure in forecasts for other metals markets. For instance, China’s restrictions on energy usage disrupted production of aluminum this year. Power curbs may also hit copper production in China, which has released supplies from its strategic reserves to ease shortages. Overall, tight stocks of metals are expected to keep prices elevated into 2022.
More Insight from Global Trade Data
For importers and exporters navigating the post-pandemic era’s global market prices swings and scarcities, Descartes Datamyne bill-of-lading trade data is key to identifying opportunities to buy, sell and arbitrage. As in the examples cited above, the ability to drill down to the record of an inbound shipment of electrolytic tinplate coil provides meaningful insight into the transactions that underlie the statistics on tin imports. These records also yield the names of consignees, shippers, and notify parties, as well as descriptions of cargos.
Descartes Datamyne international databases provide comprehensive coverage of the cross-border commerce of critical metals markets. For tin, that would be Mexico and Canada (top destinations for U.S. tin exports, accounting for 37% and 23% of trade value, respectively) and South America (together Peru, Bolivia and Brazil supply slightly more than half of U.S. tin imports). Data is also available for top Asian source for tin, Indonesia (18%).
How Descartes Can Help with Global Trade Data, including U.S. Imports and Exports Data
Descartes Datamyne delivers business intelligence with comprehensive, accurate, up-to-date, import and export information that help companies save significant time in accessing in-depth market insights and identifying new suppliers, markets, customers, and sources of products, all with a view to making supply chains more resilient.
Our multinational trade data assets can be used to trace global supply chains and our bill-of-lading trade data – with cross-references to company profiles and customs information – can help businesses identify and qualify new sources.