


The U.S. International Trade Commission has filed a report on the measurable effects of U.S. free trade agreements on U.S. imports and exports, domestic production, income, and employment – new considerations for the ongoing debate regarding the pros and cons of reduced trade barriers.
The second of two reports to Congress required by the Bipartisan Congressional Trade Priorities and Accountability Act of 2015, the USITC’s Economic Impact of Trade Agreements Implemented Under Trade Authorities Procedures, 2021 Report finds a measurable gain overall for the U.S. from the trade agreements entered into effect since 1984.
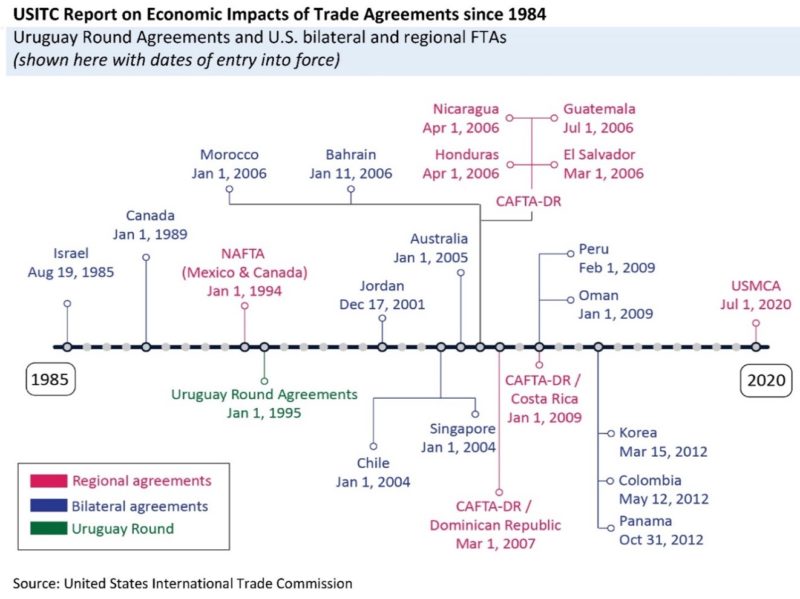
As of January 1, 2021, the U.S. has 14 free trade agreements with 20 countries in force. These FTAs, along with the Uruguay Round Agreements, affect a large share of U.S. merchandise trade. U.S. trade with fellow members of the World Trade Organization (WTO), bound by Uruguay agreements, accounted for approximately 99% of U.S. merchandise exports and imports in 2019.
Our Descartes Datamyne data provides a measure of the value of U.S. trade with its 20 FTA partners, as shown in the following charts:

The USITC report also estimates that bilateral and regional trade agreement partners account for more than 20% of U.S. cross-border services, trade, and affiliate transactions in services.
Impacts of Free Trade Agreements on the U.S. Economy as a Whole
For the most part, the results reported rely on historical data fed through economic models based on gravity modeling frameworks designed to isolate the impacts of trade agreement provisions. All USITC estimates of effects are relative to a counterfactual scenario in which the U.S. has no agreements with its FTA partners. [The USITC modeling release is available here.]
The most demonstrable gains reported are increased import-export trade flows, clearly the result of lifting tariffs, razing technical barriers to cross-border commerce, and lessening trade policy uncertainty. So, for instance, the report cites U.S. Free Trade Agreements with Peru and Colombia that give U.S. exporters of yellow corn the competitive advantage of lower price (by cutting tariffs) – and assure all parties that liberalized trade terms can be counted on over the long term.
Overall, the USTIC report concludes that in base year 2017, U.S. exports were 1.6% higher (for a $37.4-billion gain) than they would otherwise have been because of FTAs. That same year, imports were boosted an additional 3.4% ($95.2 billion) by FTAs.
Using a variety of quantitative and qualitative approaches, the USITC calculates more modest gains from FTAs for the U.S. economy as a whole. In base year 2017, the trade agreements can be shown to account for an estimated increase of 0.5% ($88.8 billion) in real GDP; 0.6% ($98.3 billion) in real income; and 0.3% (485,000 full-time equivalent jobs) in aggregate U.S. employment, accompanied by a 0.3% gain in real wages.
Not all economic gains are equally distributed. U.S. wage growth improved, but college-educated males profited most. NAFTA is estimated to have reduced wage growth from 1990 to 2000 for blue-collar workers in U.S. industries and locales vulnerable to competition from Mexican imports.
The jury is still out on the results obtained by trade pact provisions intended, in the words of the report, “to address systemic problems within U.S. Free Trade Agreement partners’ supply chains related to workers’ rights and the environment.”
NAFTA provisions aimed at improving collective bargaining rights in Mexico have had a limited effect on rebalancing that country’s labor costs against the higher wages in the U.S. It’s too soon to measure the impact of the more robust labor provisions in USMCA, the trade pact replacing NAFTA effective January 2020. The principal result of U.S.-Peru FTA provisions aimed at combatting illegal logging and deforestation appears to have made a reduction in Peru’s lumber exports to the U.S., while its illicit forest exports were diverted to other markets.
The evidence on whether trade agreements divert foreign direct investment (FDI) is mixed. As the USITC report points out, an FTA’s provisions on investment could boost FDI – but the same agreement’s reduction in barriers to trade could make exports a more profitable way to serve a foreign market.
Shifts in Trade Patterns
The USITC’s economy-wide simulations detected a shift in U.S. trade from non-FTA to FTA partners. In base year 2017, substantial gains in U.S. FTA trade offset declines in trade with non-FTA countries. U.S. exports to FTA partners increased 12.9% (by about $90 billion), offsetting a -3.1% decline ($52 billion) in exports to non-FTA countries. U.S. imports from FTA partners grew 15.2% (about $118 billion) as non-FTA imports declined -1.1% ($22 billion).
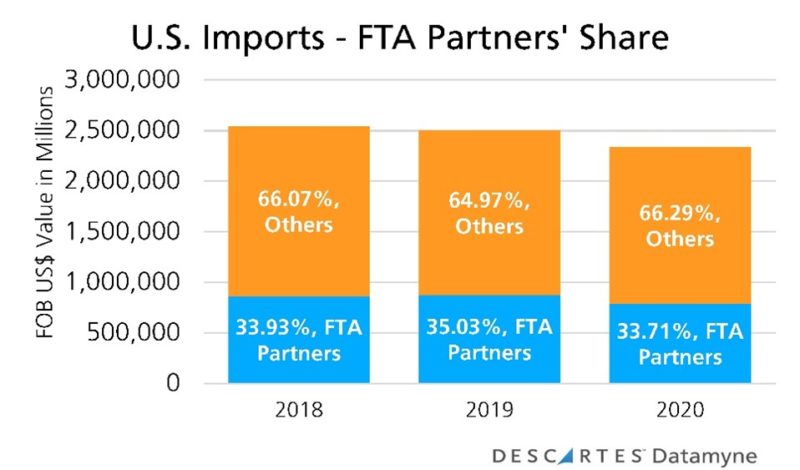
The USITC’s analytic models are designed to isolate the trade generated by the FTA from trade that would have occurred in the absence of the FTA. Looking at the historical trade data alone (as, for instance, in the above charts on FTAs’ share by FOB US$ value of U.S. imports and exports), it’s clear that FTAs’ have commanded a significant, and stable, share of U.S. trade in recent years. Here’s what the 2018 through 2020 data reveals about the rise and fall of U.S. exports, according to Descartes Datamyne data:
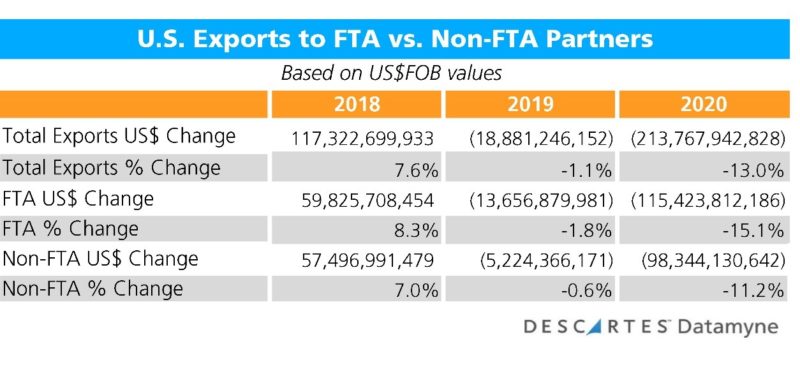
Exports to FTAs and non-FTAs contributed fairly equally to 2018’s growth (51% and 49%, respectively) and 2020’s decline (54% for FTA partners, 46% non-FTA). However, exports to FTAs accounted for 72% of 2019’s drop-off compared to 28% for non-FTA trade.
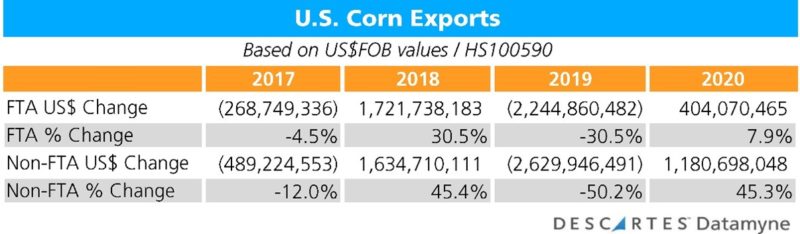
Narrowing the focus to the subject of one of the USITC report’s case studies, the importance of FTA partners to U.S. exporters of corn is clear:
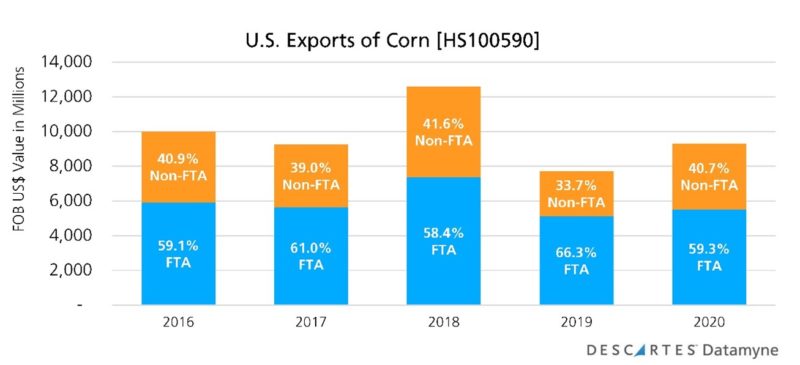
In 2020, the top four destinations for U.S. corn were Mexico (29%), Japan (20%), Colombia (9%), and South Korea (6%) – all, except for Japan, FTA partners of the U.S. In judging the relative stability of FTA vs. non-FTA trade, based on the trade data summarized in the next table, it appears that during the declines of 2017 and 2019, and the recoveries in 2018 and 2020, FTA trade accounted for a minority share (-4.5% in 2017, 30.5% in 2018, -30.5 in 2019, and 7.9% in 2020).
Eliminating Non-tariff Barriers to Trade
Perhaps the easiest case to make for trade liberalization’s benefits to the U.S. economy is based on the opening of a new markets to U.S. products. The USITC report cites the elimination of non-tariff barriers to the South Korean market as a case study. Descartes Datamyne South Korea import data captures the growing export market opportunity created by FTAs:

Note that most of this trade is with South Korea’s Free Trade Agreement partners. South Korea’s trade pact with the EU allowing imports of automotive vehicles that meet UN-ECE safety standards in lieu of Korean domestic standards entered into force in 2017. The U.S.-South Korea FTA that entered into force in 2012 also opened that market to imports compliant with U.S. standards; a renegotiated agreement raised the cap on the number of U.S. vehicles admitted in 2018. (While South Korea and Japan began talks about an FTA in 2003, they have yet to reach agreement.)
In contrast, the USITC report offers a case study that puts the potential costs of foreign technical barriers to trade into focus by looking at how the EU standards for chemicals – under its Registration, Evaluation, Authorization, and Restriction of Chemicals (or REACH) regulations – are challenging U.S. exporters. As U.S. domestic producers are finding it costly to adapt to REACH, the EU standards are being embraced by other trading partners around the world.
The Chemicals Tariff Harmonization Agreement, part of the Uruguay Round of Agreements, may serve as a precedent for what happens next. According to industry representatives invited to comment by the USITC, the 1995 agreement helped shift chemicals production from the U.S. to other countries (including those with lower labor costs). But they also saw the shift as boosting U.S. downstream competitiveness by reducing input costs.
The glass half-empty/half-full view depends on whether your company or industry stands to gain or lose as the global rules of trade evolve. In addition to the analyses of the historical data and surveys of the relevant research, the USITC report takes account of the differing viewpoints of trade associations, industry representatives and other interested parties in interpreting its findings. (Written comments and a transcript of the USITC’s virtual hearings are available on Commission’s Electronic Docket Information System -EDIS). The USITC report findings of a small, yet positive impact on the U.S. economy add fresh insight, but are not likely to settle the continuing debate about whether the benefits outweigh the costs of trade liberalization.
How Descartes Datamyne Can Help
Descartes Datamyne delivers business intelligence with comprehensive, accurate, up-to-date, import and export information that help companies save significant time in identifying new suppliers, markets, customers, and sources of products.
Our multinational trade data assets can be used to trace global supply chains and our bill-of-lading trade data – with cross-references to company profiles and customs information – can help businesses identify and qualify new sources.