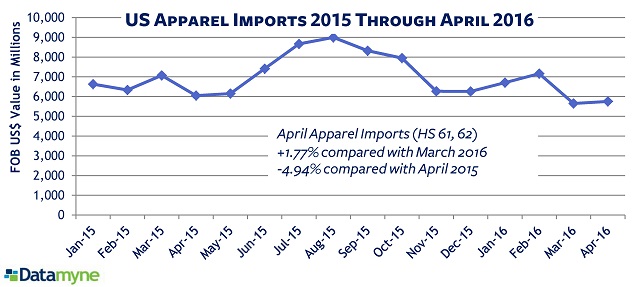
US apparel imports posted a 1.77% gain in April over March, but were down -4.94% compared with the same month a year ago, our data shows.
Hard to call April’s positive result the start of a rebound: As Sourcing Journal reports, weak demand and muted growth remain the forecast for the sector.
Leading apparel retailers from Kohl’s to Macy’s to Nordstrom’s have reported disappointing first-quarter results, following a slump in sales that began in second-half 2015.
In large part, this is the result of consumers bypassing these mall anchors to shop at fast-fashion chains and online. Amazon overtook Wal-Mart as America’s largest retailer last year. It is poised to overtake Macy’s as the largest clothing retailer next year.
But consumers are also spending less on clothing – opting instead to spend on “experiential activities” according to research from Mintel.
More encouragingly, consumer spending on non-durables such as clothing rose 1.4% in April, the biggest increase in more than six years.
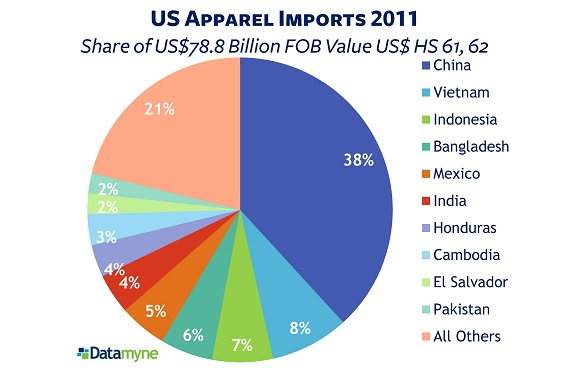
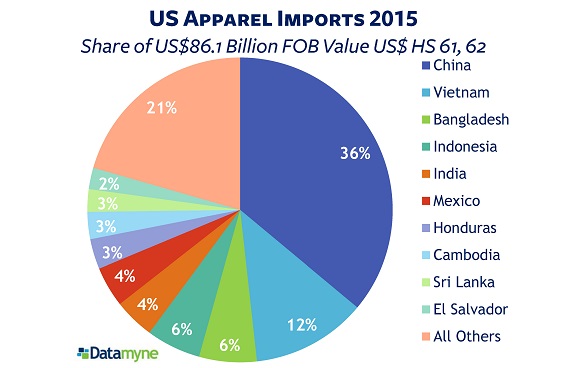
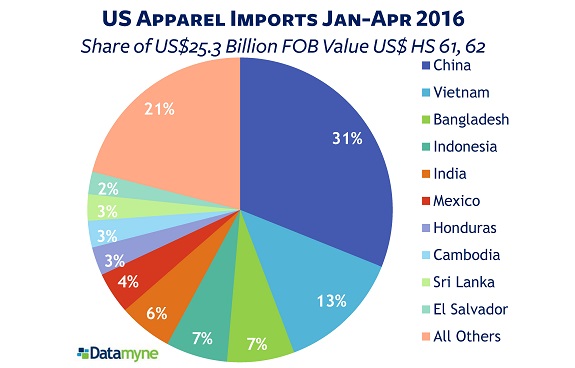
Our latest trade data indicates the shift in apparel production from China to lower-cost markets continues apace. China’s share of US apparel imports has eroded from 38% in 2011 to 31% this year through April. The biggest winner, Vietnam, now accounts for 13%.
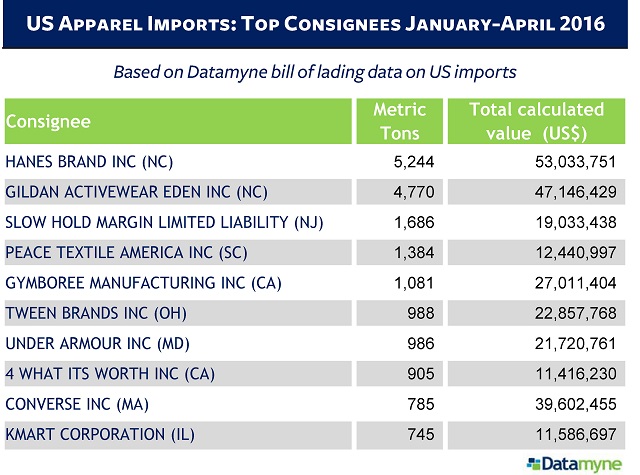
Our US waterborne import data reveals the top buyers and sellers in this trade. Here, ranked by volumes shipped through April 2016, are the top 10 consignees and shippers of US apparel imports. Note the related-party trade between US brands Hanes and Gildan and their affiliates in near-source Dominican Republic.