


The recent collapse of a critical bridge in Baltimore has sent shockwaves through the transportation and logistics industry, raising trade concerns through one of the East Coast’s busiest ports. The implications of this incident extend far beyond the immediate area, affecting trade routes, importers, exporters, and the broader economy.
The Backbone of East Coast Trade: The Significance of Baltimore in U.S. Trade
In 2023, Baltimore ranked as the 10th largest port in the United States for container imports, accounting for 2.1% of the nation’s total volume or 527,474 TEUs (see Figure 1). Situated strategically on the East Coast, in 2023 it represented 4.51% and ranked sixth of the top twenty East Coast ports by volume, alongside New York, Savannah, Norfolk, Charleston, and Miami (see Figure 2.). The bridge collapse threatens to disrupt this vital artery of trade, impacting not only Baltimore but also the interconnected network of ports and transportation routes along the East Coast.
Figure 1: Top 10 U.S. Ports for Container Imports
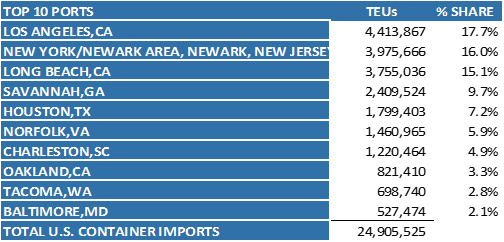
Figure 2: 2023 Top 20 East Coast Ports
| PORT OF ARRIVAL | Teus Quantity | % |
| NEW YORK/NEWARK AREA, NEWARK, NEW JERSEY | 3,980,034.29 | 34.01 |
| SAVANNAH,GA | 2,410,261.00 | 20.60 |
| NORFOLK,VA | 1,461,862.52 | 12.50 |
| CHARLESTON,SC | 1,220,611.12 | 10.44 |
| MIAMI,FL | 530,042.83 | 4.53 |
| BALTIMORE,MD | 527,474.08 | 4.51 |
| autoPHILADELPHIA,PA | 430,324.65 | 3.68 |
| PORT EVERGLADES,FL | 327,391.82 | 2.80 |
| JACKSONVILLE,FL | 211,014.54 | 1.81 |
| WILMINGTON,DE | 185,440.09 | 1.59 |
| CHESTER,PA | 130,089.34 | 1.12 |
| BOSTON,MA | 121,348.75 | 1.04 |
| WILMINGTON,NC | 111,534.51 | 0.96 |
| WEST PALM BEACH,FL | 32,524.65 | 0.28 |
| PORTLAND,ME | 21,772.42 | 0.19 |
| BRUNSWICK,GA | 442.50 | 0.01 |
| PORT CANAVERAL,FL | 97.00 | 0.01 |
| FERNANDINA BEACH, FL | 83.00 | 0.01 |
| ATLANTA,GA | 56.56 | 0.01 |
| NEW LONDON,CT | 51.40 | 0.01 |
| TOTAL | 11,702,679.31 | 100.00 |
Source: Descartes DatamyneTM
The container imports into Baltimore are a diverse mix of consumer and industrial goods (see Figure 2). Imports here include furniture, wood products, machinery, plastics, steel, vehicles, and electronics. The loss of access to Baltimore’s port facilities could disrupt the supply chains of numerous industries reliant on these imports, from retail and manufacturing to construction and automotive.
Figure 3: Top 10 Container Import Commodities at the Baltimore Port
| HS Code | 01/01/2024 – 03/24/2024 | |
| Teus Quantity | % | |
| 94 – FURNITURE; BEDDING ETC; LAMPS NESOI ETC; P… | 14,931.73 | 11.89 |
| 84 – NUCLEAR REACTORS, BOILERS, MACHINERY ETC.;… | 14,069.21 | 11.21 |
| 44 – WOOD AND ARTICLES OF WOOD; WOOD CHARCOAL | 13,482.53 | 10.74 |
| 39 – PLASTICS AND ARTICLES THEREOF | 9,242.74 | 7.36 |
| 87 – VEHICLES, EXCEPT RAILWAY OR TRAMWAY, AND P… | 5,095.20 | 4.06 |
| 73 – ARTICLES OF IRON OR STEEL | 4,369.99 | 3.48 |
| 85 – ELECTRIC MACHINERY ETC; SOUND EQUIP; TV EQ… | 4,095.81 | 3.27 |
| 40 – RUBBER AND ARTICLES THEREOF | 3,825.79 | 3.05 |
| 48 – PAPER & PAPERBOARD & ARTICLES (INC PAPR PU… | 3,722.80 | 2.97 |
| 72 – IRON AND STEEL | 3,698.37 | 2.95 |
| Total | 125,606.90 | 100.00 |
Source: Descartes DatamyneTM
Baltimore’s Specialized Role in Vehicle Imports
Regarding automotive imports, Baltimore stands out as the top import destination in the United States, with 16.5% of the total imports. The specialized handling and infrastructure required for automotive shipments, may not be readily available in alternative ports. With Mexico and Japan being major sources of these imports, companies like GM, Daimler, Stellantis, Mazda, Subaru, and Mitsubishi could face logistical challenges in redirecting their shipments to other ports along the East Coast.
Looking Ahead: Rebuilding Supply Chains
The timing of this incident, so close to the end of the month, adds another layer of complexity for businesses already grappling with supply chain disruptions brought on by the pandemic. While alternative ports may have some capacity to absorb additional container volume, the reconfiguration of inland logistics and transportation routes will require significant time and resources.
Importers and logistics companies are undoubtedly prioritizing contingency plans to mitigate the impact of the Baltimore bridge collapse. This includes identifying alternative transportation routes, securing additional warehouse space, and coordinating with suppliers and customers to minimize disruptions to supply chains. However, the scale of the challenge ahead should not be underestimated, and proactive measures will be essential to navigate this turbulent period.
The broader implications of the Baltimore bridge collapse extend beyond immediate logistical concerns. It underscores the importance of infrastructure resilience and investment in maintaining and upgrading transportation networks to support the flow of goods and sustain economic growth. As policymakers and industry stakeholders assess the fallout from this incident, there is a pressing need for collaboration and innovation to build more resilient supply chains capable of withstanding unforeseen disruptions in the future.
Harnessing Data for Insight: The Role of Descartes Datamyne
To assess impact of the collapsed Baltimore bridge, Descartes Datamyne will continue to track critical data. Datamyne serves as a critical asset for all stakeholders impacted by this event. By providing comprehensive data and analytics on global trade flows, shipping trends, and import-export activities, Descartes Datamyne offers insights that can inform strategic decision-making and risk management strategies. As the situation in Baltimore continues to unfold, leveraging the power of data-driven insights from Descartes Datamyne will be crucial in mitigating the impact and charting a path towards recovery and resilience for global trade.