


Russian consumers will likely top the list of losers under Moscow’s one-year ban on all meat, fish, poultry, dairy, fruit and vegetables imports from the US, the EU, Canada, Australia, and Norway, effective August 7, 2014.
Or, as the New York Times put it, Russia Sanctions Itself: the larger and more diversified exporting countries are better positioned to absorb the sales losses than Russia, which imports 40% of its food by value, is to withstand shortages and inflated food prices.
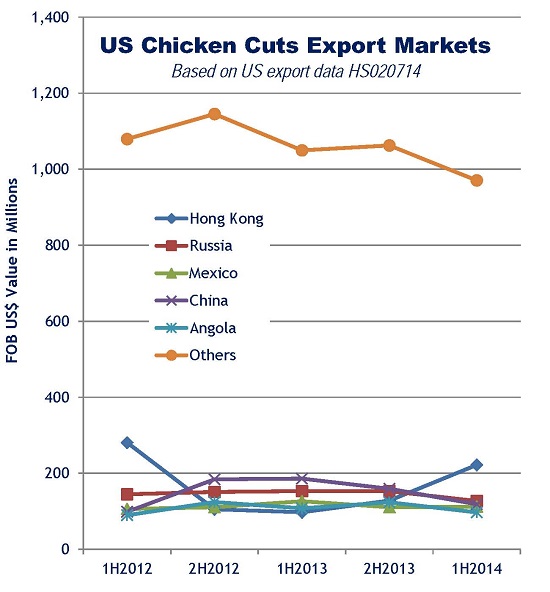
Take, for example, chicken cuts (HS02714).
Introduced as US food aid in the 1990s – when they earned the nickname “Bush legs” – chicken cuts imports have been banned by Russia before (in 2002, 2008 and 2010). Still, they remain the third ranked US export to Russia. But Russia is one of many customers for US chicken, accounting for 7.65% of US chicken cuts exports by value in the last half.
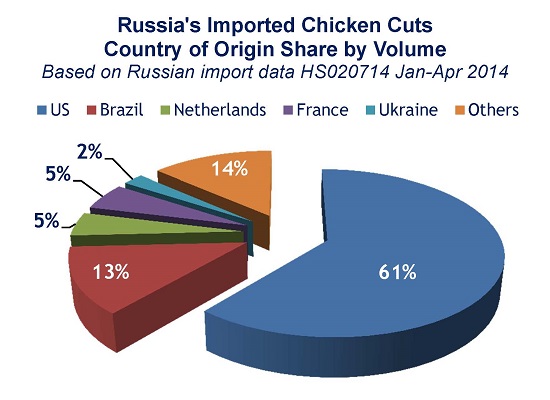
Meanwhile, as data from our Russian trade database shows, the US accounted for slightly more than half of chicken cuts imported by value – and 61% by volume.
But, while the Russian bans (to date) may have muted impact on the US national trade ledger, individual US exporters to the Russian market will feel the loss more keenly (while Latin American exporters reportedly stand to gain).
Who stands to lose from Russia sanctions? As we wrote in back in March, our Trade Data Points to Potential Impact of Russia Sanctions. (Click through to see more data on the ports that handle Russia trade, top imports and exports, based on year-end 2013 data).
Based on our US export manifest data in first half 2014, these exporters will feel the impact on Russia’s ban on chicken:
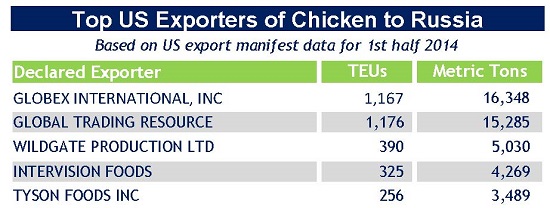
The list is led by Globex International, an American trading company founded in 1992, headquartered in New York City with branch offices in Riga, Hong Kong, and Moscow. The company specializes in the export of poultry and meat products from the US, Europe and other countries around the world.
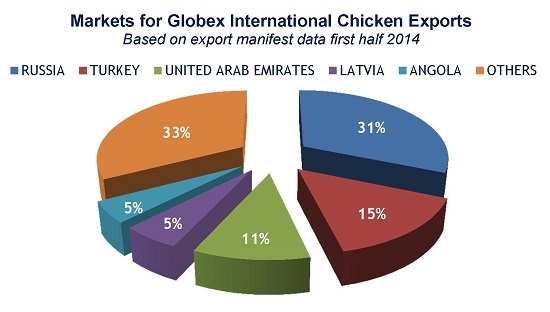
The trade data can also provide a measure of the exporters’ exposure to the Russian ban. For instance:
Our multinational trade database can be used to gauge the impact of what threatens to become a tit-for-tat exchange of trade sanctions on US, Canadian, EU and Russian importers and exporters (as well potential gainers in Latin America). Ask us for a free demonstration.