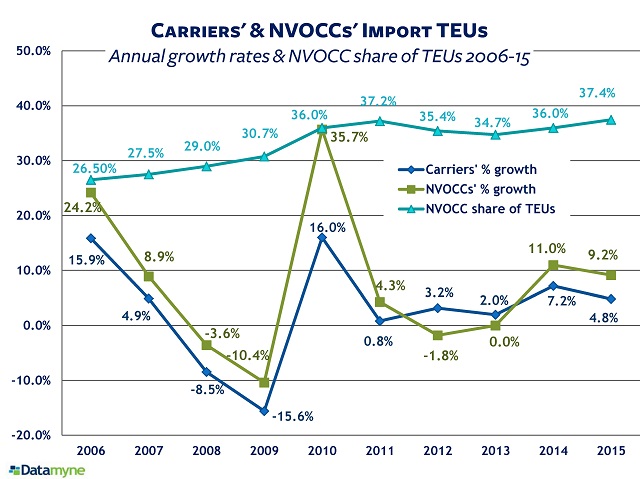
NVOCC US import TEU share reached 37.4% in 2015, a bump up from 2014’s share of 36.0%, and a 10 percentage point gain over 10 years, our trade data shows.
Global companies’ confidence that more shippers will be outsourcing their logistics is seen as driving M&A activity in the 3PL sector [see Betting on Outsourcing: 3PL Mergers and Acquisitions]. The trade data should encourage that confidence.
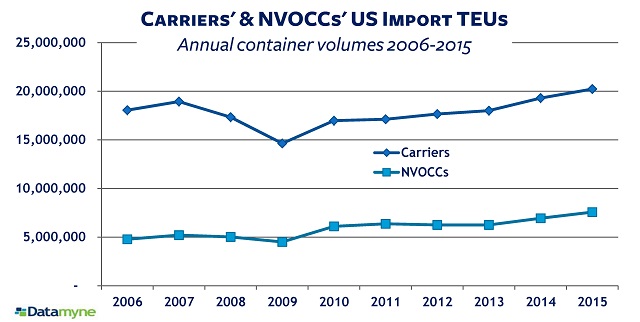
Ocean carriers brought 20,226,253 TEUs of imports to US ports last year, with 7,573,180 TEUs contracted by ocean transport intermediaries known as non-vessel operating common carriers – or NVOCCs. TEUs – or 20-foot equivalent units – are the standard measure of containerized cargos. Our final tally of carrier US import volumes shows a 4.8% increase in 2015 over 2014; NVOCC TEUs increased 9.2% in 2015 compared with the year before.* Both growth rates were off 2014’s pace. Here’s a look at the 10-year trend data on US import volumes and the rising NVOCC US import TEU share:
3PLs See Volumes Rise, Growth Slow in 2015
Meanwhile, 3PLs told the Transportation Intermediaries Association (TIA) they saw an increase in total shipments of 8.5% overall, yet total revenue dropped 4.7% in fourth-quarter 2015 compared with the same period a year earlier, reports Material Handling & Logistics.
The numbers, from the TIA’s quarterly 3PL Benchmarking report, are based on data from the trade association’s members. 3PLs are a broader category of ocean transport intermediaries in which NVOCCs are well represented.
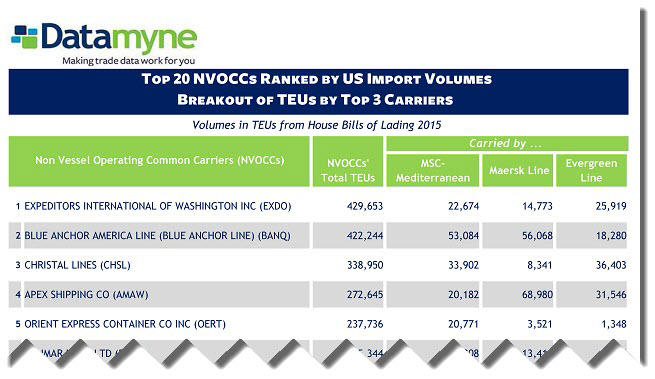
2015’s Top NVOCCs
Our year-end 2015 ranking of NVOCCs by US import TEU volumes puts Expeditors International of Washington Inc. (EXDO) in the lead, with Blue Anchor America Line (BANQ) in second. These two have held these positions over the last decade – although Expeditors International’s lead over Blue Anchor narrowed last year. Expeditors accounted for 5.67% share of TEUs handled by NVOCCs in 2015; Blue Anchor’s share was 5.58%.
You can download our 2015 report ranking the top 20 NVOCCs by US import TEUs, and including a break-out of their TEUs by the top three carriers, here.
[*The text in our original post transposed the growth rates for carrier import TEUs vs NVOCC TEUs. They now match the correct rates shown in the graph. – Editor]
Related:
- Betting on Outsourcing: 3PL Mergers and Acquisitions
- Hot Properties: Freight Forwarder, NVOCC M&As Stoked
- Datamyne issues free monthly ranking reports on Carriers, NVOCCs and US Ports in US import trade. Our report on the top 20 NVOCCs x top 3 Carriers is updated each quarter. To browse our maritime data reports, go to our Free Report Library
- For a closer look at our maritime data – including the opportunity to dig into the details of the bills of lading that document each shipment – just ask us.