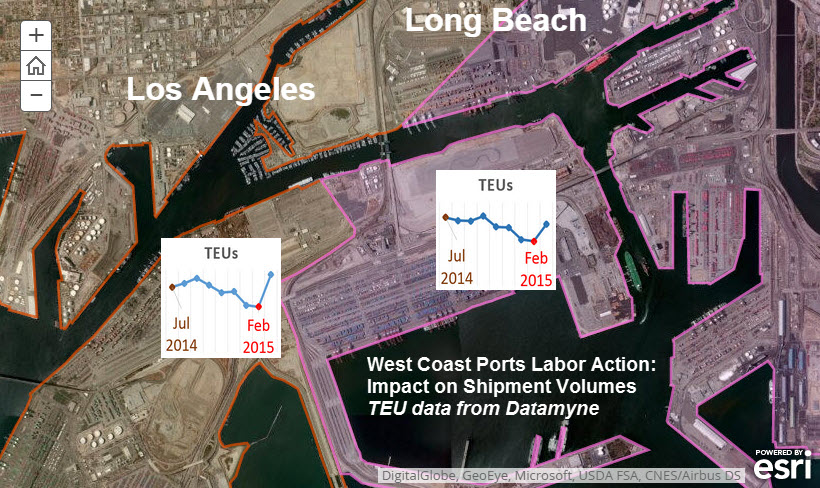
Our partners at Esri have used their GIS (geographic information systems) software to create a series of interactive story maps illustrating the impact of the West Coast ports’ slowdown during the dispute over terms of a new longshoremen’s contract. The old contract expired July 2014; agreement on a new one was not reached until February 2015.
The Esri story maps begin with a global view of the world’s trade lanes and ports. The focus then tightens on the US, then southern California and the ports of Los Angeles and Long Beach. A time slider map takes the viewer through 20 years of volume growth at these neighboring rivals, with TEU volume data sourced from Datamyne. The series winds up with our LA-LB port slowdown data on TEUs before, during and after the labor dispute – and a promise of a Part 2 on the ports’ effects on the US economy.
See the Esri story map series on the LA-LB slowdown here.
Related: