


The trade data shows US polyethylene net exports decreased 20% in October and 7% in November 2014 compared to the same months in 2013 – continuing a downward trend that has persisted since 2009 and through last year’s first three quarters:
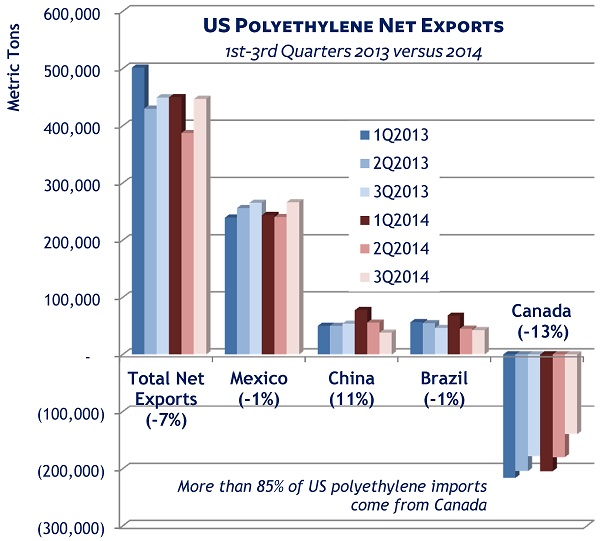
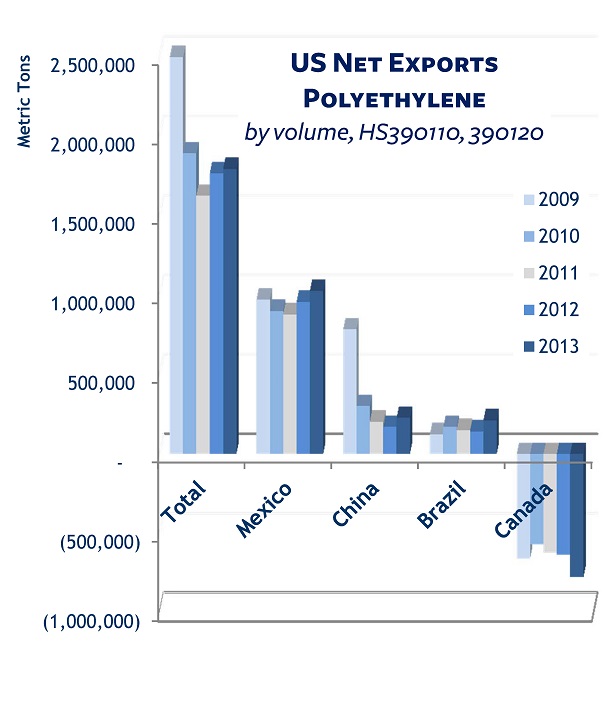 The US is still a net exporter of PE, the plastic polymer that is used to make packaging, from retail carrier bags to bottles and containers to buckets and pipes. But are the markets for the US product drying up? The trade data seems to point to that risk.
According to the American Chemistry Institute, the US produced a total of 38,671 million pounds of PE in 2013 (of which 18% was Low Density or LDPE, 36% Linear LDPE, and 46% High Density or HDPE). Based on our trade data, 19% of that production went to export markets.
The shale revolution that is transforming the entire petrochemicals sector was expected to give a global price advantage to US PE, which mostly uses a shale or natural gas isolate-based petrochemical feedstock.
“That may yet turn out to be the case, but there are other factors at work,” says Brian J. McCormick, founder and managing director of Chemcost Interactive.
He notes that “the cheaper shale gas isolates haven’t translated into price cuts on the finished PE product until recently.”
For one thing, US PE prices were propped up in 2014 by domestic production outages that constrained supply. Another, ironically, is that the price of PE is pegged to the price of crude oil, the basis for most other countries’ PE production – as Plastics News points out in its November report of the first price cut in US PE in two years. (Note that Platts reported a further price drop in December.)
“But the lower cost of US gas-based PE is now matched by the lower cost of oil-based PE,” says McCormick. “The falling global oil price levels the global PE playing field and blunts any shale gas-based price edge for US exports.”
Finally, McCormick adds, “the uncertainty of the current pricing environment causes buyers to proceed cautiously – further depressing export sales.”
The outlook in 2015 is for PE oversupply as restored, new and expanded US production revs up. Overall output is expected to increase 30+% by 2018.
“Since the US is deemed a mature market, the producers seem to be betting on growth in export market demand,” comments McCormick. “But the US is far from alone in building out PE production. In fact, its top three export markets – Mexico, China and Brazil – look likely to dial back imports from the US.”
China, the world’s top importer of PE, has routinely accounted for 18-20% (by value) of all PE imports since 2009 – but since that year, China has shifted its PE sourcing from the US to other countries, most notably Iran:
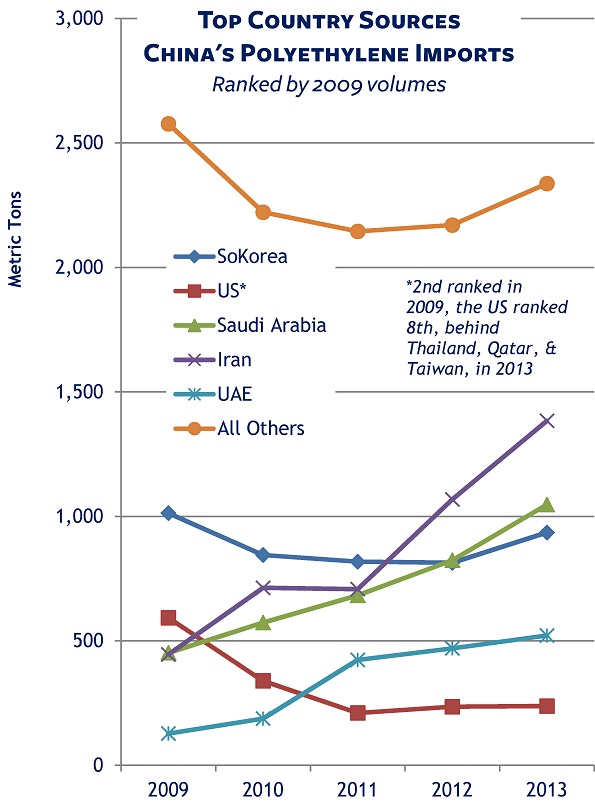
During that same period, China has made expanding its domestic production a priority. According to analysis from Platts, China’s planned new PE production through 2020, based on coal-to-olefins technology, will match that of North America’s new shale gas projects.
Meanwhile Braskem S.A. has just completed an expansion in Brazil that, says Plastics News, should allow it to meet that country’s demand for LLDPE. With its partner, petrochemical group Idesa, Braskem is also launching production in 2015 at its new ethylene/polyethylene complex in Mexico.
The preliminary conclusion: Finding themselves competing in a broader, price-conscious field, US PE producers might well seek new export market demand for PE from Latin America and likely beyond, given the mixed near-term economic growth forecasts from that region. Longer term, Platts expects more balanced global markets by 2020 – and, so long as there are no new production projects, a PE deficit by 2022.
We’ll continue to monitor and share the trade data. If you have questions about this, or any other chemical product in trade, just ask us.
Related:
- Fasten Your Seatbelts for Turbulence in Chemicals Prices
- Free download: Top 25 US Chemical imports & exports, ranked by value of the latest available month’s trade + year’s cumulative stats compared with the previous year.