


As the U.S. Commerce Department examines whether to impose section 232 tariffs on passenger vehicles, data from Descartes DatamyneTM reveals significant changes in U.S. automobile imports and exports.
U.S. Automobile Imports
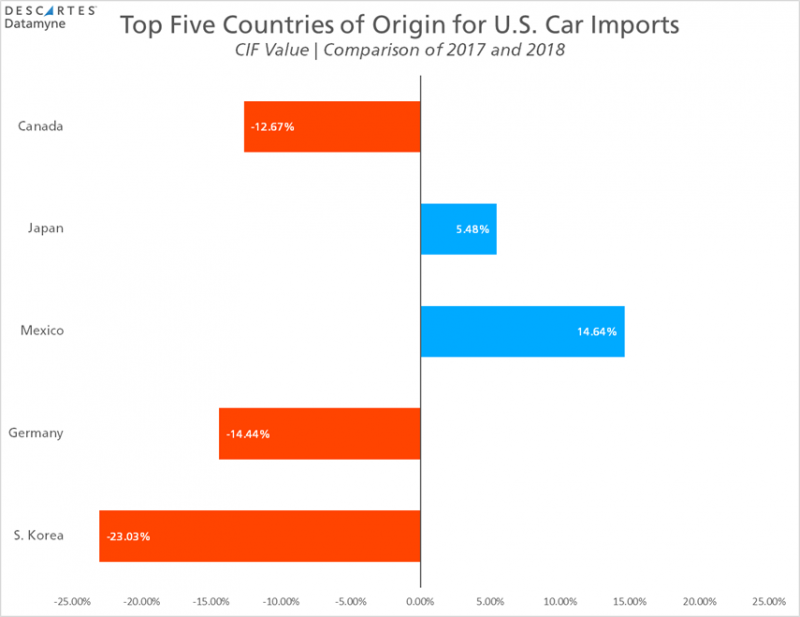
According to data from Descartes Datamyne, the General CIF Value of U.S. car imports dipped by 0.51% in the first half of 2018 compared with the same period in 2017. The rankings of the top five countries of origin remained the same but the value of imports from each country changed significantly.
The decline from several former top countries of origin, alongside the introduction of India as a major source for U.S. automobile imports, indicates a dramatic shift in the supply chain for automobile manufacturers.
Korea
Datamyne Market Insight suggests 23 percent decrease in value of South Korean imports is due, in part, to a combination of the transfer of production lines from South Korea to Mexico and a decision to stop producing several models for the U.S. market.
Canada & Mexico
The 14.6 percent increase in import value from Mexico and 12.7 percent decrease from Canada reflects shifting production capacity to plants south of the border. The final outcome of NAFTA negotiations will determine whether or not this trend continues.
Sweden
Imports from Sweden doubled on strong demand several SUVs produced in the country. While showing strong growth, the increase could ultimately be temporary due to newly opened domestic assembly plants in the United States.
Finland
Finnish imports rose more than fourfold, claiming a 1.2 percent share of the total. This is primarily due to a shifting production from European Manufacturers that is now utilizing the assembly plant in Uusikaupunki, Finland.
India
The biggest rise in U.S. automobile imports comes from India. The value of cars imported from India rose by an astonishing 41,516 percent, going from $1.5 million in Jan-Jun 2017 to $619 million (0.71 percent of total import value) in 2018, drawing almost even with Chinese imports, which dropped in value by $158 million to a 0.79 percent share. This surge from India can be attributed to several Indian-made automobiles to the U.S. market.
Almost overnight, the U.S. has become India’s third largest car export market and this growth may continue as other manufacturers move to sell their Indian-made cars stateside. India’s exports data indicates declining exports to other countries as their exports to the U.S. has skyrocketed. Indian car exports to Spain (-30 percent), Italy (-25 percent) and the U.K. (-50 percent)
Jan-Jun 2017 imports included 23 countries that do not appear in the current tabulation; only 4 new countries made the list in 2018. The General CIF Value of imports from these 27 countries was small and therefore had little impact on the overall numbers.
U.S. Automobile Exports
U.S. production of automobiles increased 10.29 percent from June to July to a total of 3 million units. This comes after a year-long slowing of production from a recent peak in April 2017. Despite the fluctuations in production, In the first six months of 2018, the FOB Value of car exports increased by only a modest 0.72% over the same period in 2017, with no change in the rankings of the top five destination countries.
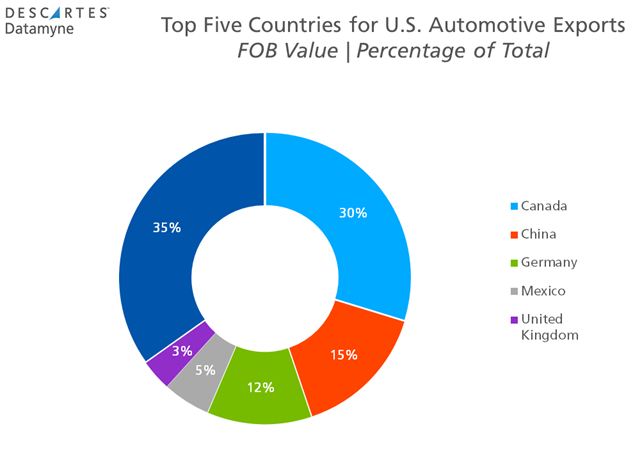
The value of exports to China declined by 24 percent, cutting China’s share of total exports to 15 percent, down from 20 percent in 2017. China is the single largest market in the world for cars—and is still growing—so despite this dip in U.S. exports, it seems likely that the upward trend will eventually reassert itself when the current trade dispute blows over. China recently announced that it would cut import duties on passenger vehicles from 25 percent to 15 percent, making the world’s largest automobile market that much more attractive to foreign producers.
Read more about shifting trade policy here.
Exports to Canada increased in value by 11%, giving the country a 30 percent share of the total in 2018. Value of exports to the U.K. dropped by roughly 11 percent. The collective FOB Value for the top five destination countries decreased by $757 billion, from 68.4 percent of total exports in 2017 to 65.2 percent in 2018.
Keeping Pace with Shifting Markets and Emerging Suppliers
Descartes Datamyne
Stay ahead of the competition with a comprehensive database of accurate, up-to-date import-export information. Descartes Datamyne delivers actionable intelligence for market research, sales insight, supply chain management, enhanced security and competitive strategy. The solution is powered by the world’s largest searchable trade database, covering the global commerce of 230 markets across 5 continents.
Manufacturers, shippers, wholesalers, transport and logistics service providers, management consultants, legal practitioners, industry analysts and more use our data to initiate growth strategies, explore new markets, benchmark performance, monitor commodity volumes and values, simplify trade data research, discover buyer-seller relationships and refine sourcing strategies.