by Brian J. McCormick, guest columnist
The Chemcost search for the new cheap in US chemicals continues … even as chemical price storm clouds appear to be gathering.
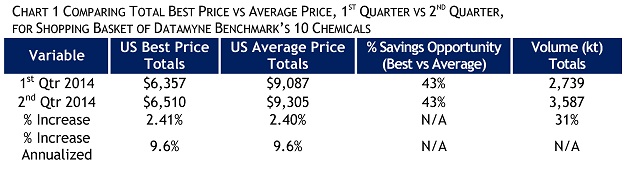
We’ve compared first-quarter with second-quarter best and average prices for the 10 chemical commodities that make up the Datamyne US Best Price Benchmark (posted on the Datamyne home page). Chart 1 below reviews high-level trends between the two quarters.
There are three key striking measures here.
- The first is the continuing opportunity for as much as 43% in price savings for best prices as opposed to average prices. Significant savings can still be had by diligent US buyers who qualify best price producers.
- An apparent 10% average annualized price increase seems to be taking effect now.
- While increased volumes might well be due to seasonal shifts in demand – and assuming that 2014 US production capacities remain comparable to those of 2013 – the noted 31% increase in 2nd quarter trade volume may be the primary or sole factor boosting prices. Put another way: demand appears to be spiking and producers, not buyers, are seeing a pricing opportunity now.
With prices on the rise, buyers are left with a choice: Lock in deals now and avoid assuming any further price risk. Or decide to hunker down and wait out the price storm that appears to be on its way.
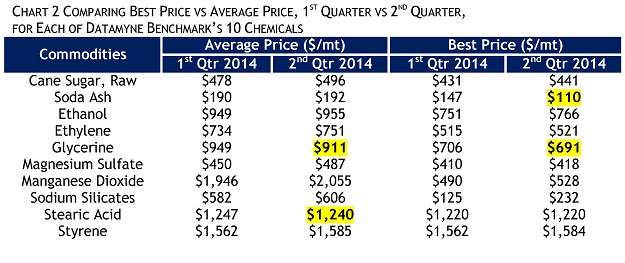
In Chart 2 below, we examine first- and second-quarter actual average and best prices for each of the benchmark’s 10 chemical commodities. Cheaper second-quarter US prices are highlighted in the chart.
Some notes:
- Average prices for glycerine and stearic acid are slightly less in the second quarter.
- There are lower best prices in the second quarter for US soda ash exports and glycerine imports from Argentina.
- All other best and average prices are comparable to or higher than first-quarter prices.
It is certainly possible that annualized price creep of 10% noted in Chart 1 may remain in force into the next quarter or beyond. Given the downside potential of prolonged periods of chemical price creep, Chemcost will continue to monitor price risk. Please stay tuned.
Chemcost Interactive LLC ©2014
About Brian J. McCormick
 Brian J. McCormick was instrumental in developing procurement costing and quality assurance for P&G over a 34-year career. He is the founder and managing director of Chemcost Interactive LLC* (CI), a company offering research and analysis to support cost-efficient supply chain management.
Chemcost can assist Datamyne’s customers in identifying lower price opportunities through consulting and training. Chemcost offers annual subscriptions to global and regional price bulletins on 225 commodities across 9 major chemical spend classes. New! Production cost analyses of key commodity and specialty polymers containing your choice of best or average feedstock prices are available for purchase via PayPal. Contact Chemcost for more information at www.chemcostinteractive.com or call 513-519-7585 in the USA.
The opinions expressed in this article are those of its author and do not purport to reflect the opinions or views or Descartes Datamyne. In addition, this article is for general information purposes only and it’s not intended to provide legal advice or opinions of any kind and my not be used for professional or commercial purposes. No one should act, or refrain from acting, based solely on this article without first seeking appropriate legal or other professional advice.
* Chemcost Interactive is a trademark of Chemcost Interactive LLC