


Erin go bragh! You may well plan to hoist a glass of beer in honor of St. Patrick’s Day March 17. Whether your choice is lager, ale, stout, or porter, you will likely be in luck if you ask for a brew from the Auld Sod itself. The U.S. imported 134,106,004 liters of beer from Ireland in 2022, making it No. 3 among sources for U.S. beer imports by volume, just edging out Canada (132,991,882 liters), but behind the Netherlands (499,304,367 liters) at the No.2 spot, according to Descartes Datamyne global trade data covering U.S. imports.
These figures pale in comparison to Mexico (see Figure 1), just next door and far and away the leading exporter of beer to the U.S., and the world. In 2022, Mexico shipped 3,771,794,936 liters, accounting for nearly 80% of U.S. imported beer and assuring plenty on hand to toast Feliz Cinco de Mayo!
Figure 1: Top Countries of Origin for U.S. Imports of Beer [HS2203]
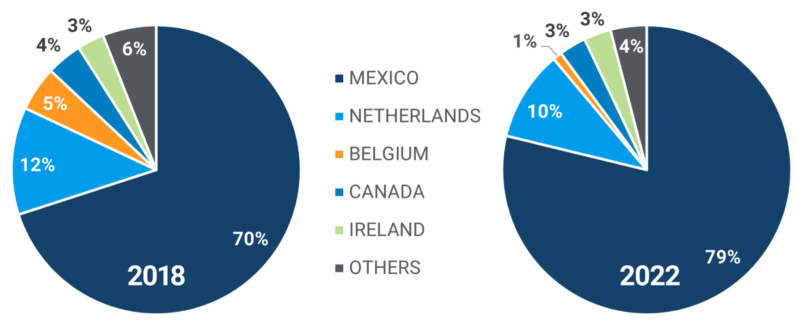
Indeed, Mexican beer has helped drive imported beer’s share of the U.S. market to 21%, according to the Brewers Association. The craft beer industry, which includes regional breweries as well as microbreweries, brewpubs, taprooms, and contract brewing companies, now claims 13.1%. The rest of the U.S. beer market – 65.9% in 2021 – belongs to national brands.
This map from the Visual Capitalist offers a state-by-state view of beer consumption, with national brands consumers’ top choice in most, but not all states. (Note that only Arizona’s favorite beer is an import.) But the beer market is far more globalized than consumption by label global trade statistics suggest.
The terroir of beer
The terroir of beers is not so neatly defined as it is for wines and spirits identified by their geographic origins. As any craft brewer will attest, a key determinant of a beer’s distinctive flavor, aroma, and color is the provenance of its basic ingredients – malted barley, hops, yeast, and water. But that brewer in, say, Mexico might choose malt made in the U.S. from Canadian barley, hops from Australia, South Africa, and/or Belgium, with an extract of hops from Germany.
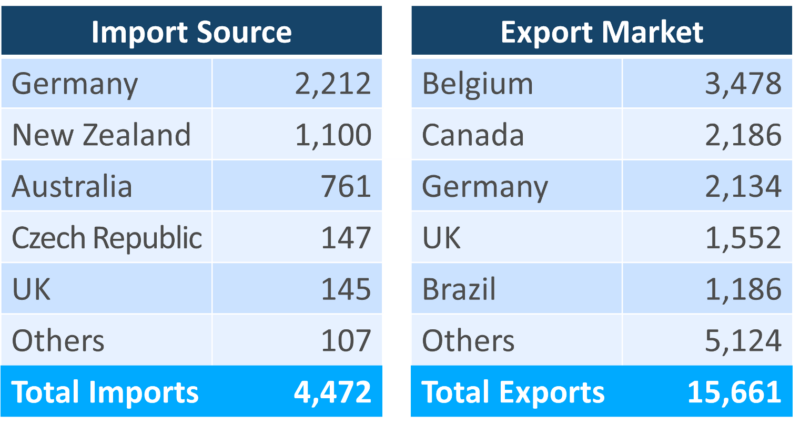
Start with barley. Other grains such as wheat and rice may be in the mix, but barley is the most common basic grain. Most barley grown in the U.S. is contracted for malting, according to the U.S. Grains Council. The USDA reported that just 8% of the country’s barley production was exported in 2021. Our latest available full-year trade data (see Figure 2) confirms that the U.S. supplements its domestic stock of barley with imports, with scant supply left for foreign markets.
Figure 2: U.S. Trade in Barley for Malting 2022 (U.S. Census Date | Metric Tons | HS100390)
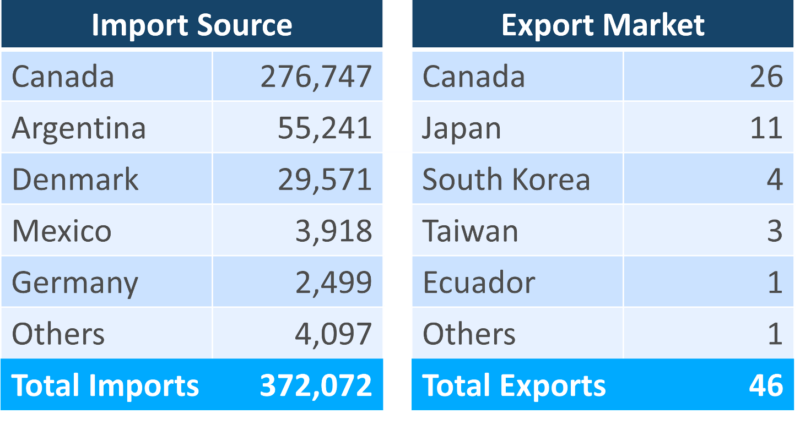
Source: Descartes Datamyne
It’s worth comparing the 2022 data with that of 2021, a more representative year. While still a net importer, inbound volumes were almost 60% lower in 2021 than in 2022, while the U.S. exported nearly seven times as much barley in 2021 compared with last year (see Figure 3). Also note that Argentina, a top source for imports in 2022 did not ship barley to the U.S. in 2021.
Figure 3: U.S. Trade in Barley for Malting 2021 (U.S. Census Date | Metric Tons | HS100390)
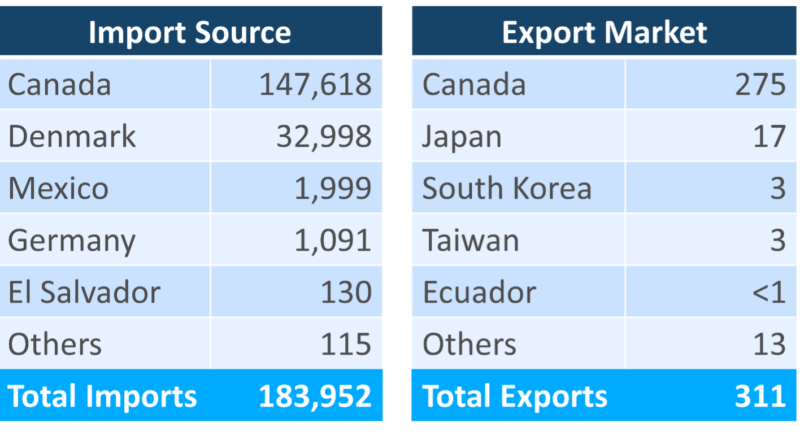
Source: Descartes Datamyne
These shifts in trade were not limited to the U.S. As World Beer and Spirits reported, the U.S. and Canada made rare purchases of malting barley from Argentina and Australia, respectively, in 2022 as drought conditions took a toll on domestic barley production.
A different challenge awaits in 2023, as the USDA Foreign Agricultural Service cautions. Commodity prices already on the rise due to the post-pandemic growth spurt in demand as well as supply shortfalls in the drought-stricken Northern Hemisphere, look likely to get a further boost from the Ukraine conflict. Ukraine sent 5,344,595 metric tons of barley to the global marketplace in 2021, accounting for about 15% of this trade, with most bound for China (over 50%) and the Middle East.
The sweet taste of malt
In the U.S., the leading national brewers source their two-row and six-row barley malt from domestic suppliers. Indeed, their long-standing collaborative relationships with homegrown suppliers is a selling point of their brands. Similarly, marketing campaigns for craft beer often emphasize qualities of a specific malt barley variety, whether domestic or imported.
These differences in varietals and growing conditions matter, of course, in the production of beer. But they can be difficult to distinguish by tasting the beer, as The Western Producer reports, citing recent research by the Canadian Malting Barley Technical Centre.
Not so the malted barley, the product of soaking, sprouting, and drying the grain to ready it for the fermenting process that produces beer. There are many versions of malt but, in general, the malt brings the sweet and bread-like taste to beer. Malt also delivers the sugars the yeast will work with to generate alcohol and carbon dioxide.
As with barley, much of the U.S. trade in malt is with its USMCA partners Canada and, especially, Mexico. As our 2022 trade data shows (see Figure 4), Mexico is the top market for malt made in the U.S.
Figure 4: U.S. Trade in Malt 2022 (U.S. Census Date | Metric Tons | HS110710, -20)
Source: Descartes Datamyne
The spice of hops
As one homebrew guide notes, “if malts represent the sugar in beer, then hops surely represent the spice.” Added to the brew (or, technically at this stage of beer-making, the wort) hops counter the malt’s sweetness with bitterness, while adding distinctive flavor and aroma.
The craft-beer industry gave a tremendous lift to hops farmers, who increased acreage and brought more varieties into production to meet the steady rise in demand (this growth may have plateaued ahead of the pandemic) and the quest for artisanal brews.
Popular varieties include Hallertauer, Cascade, Kent Goldings, Willamettes – names that harken back to the region of origin. Hops can make a strong claim to having terroir, that is, discernible characteristics intrinsic to their growing environment, a recent Oregon State University study confirms.
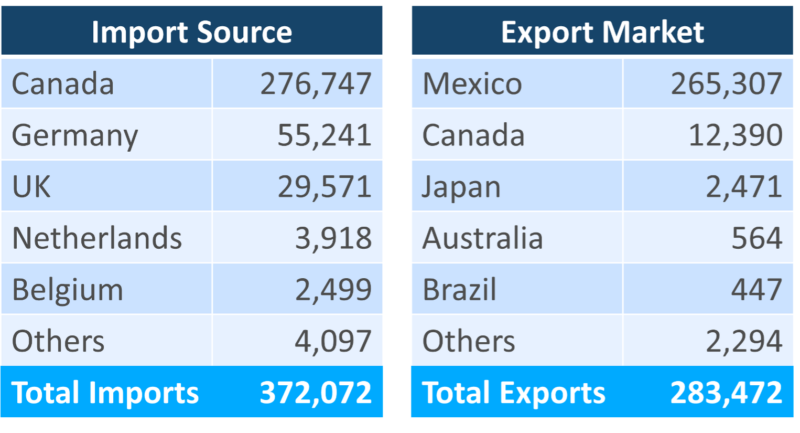
Our 2002 global trade data yields this line-up of top sources for U.S. imports of hops and top markets for its exports (Figure 5).
Figure 5: U.S. Trade in Hops 2022 (U.S. Census Data | Metric Tons | HS1210)
Source: Descartes Datamyne
Note Brazil’s appearance among the leading markets for U.S. hops. Brazil is the world’s third largest producer of beer, behind China and the U.S. and ahead of Mexico and Germany.
While growth in craft breweries may have peaked in the U.S., the craft beer market is on the upswing in Brazil, creating an export opportunity for U.S. hops farmers, according to the USDA FAS. Indeed, our Brazilian trade data shows the volume of hops imported from the U.S. reaching record levels on a 19% increase in volume in 2022 compared with 2021 – enough to lift the U.S. above Germany as the country’s top supplier.
The USDA FAS sees a similar opportunity to increase exports of extracts of hops used by brewers to Brazil, already a top market for the U.S. product, as our global trade data shows (Figure 6).
Figure 6: U.S. Trade in extracts of Hops 2022 (U.S. Census Data | Kilograms | HS130213)
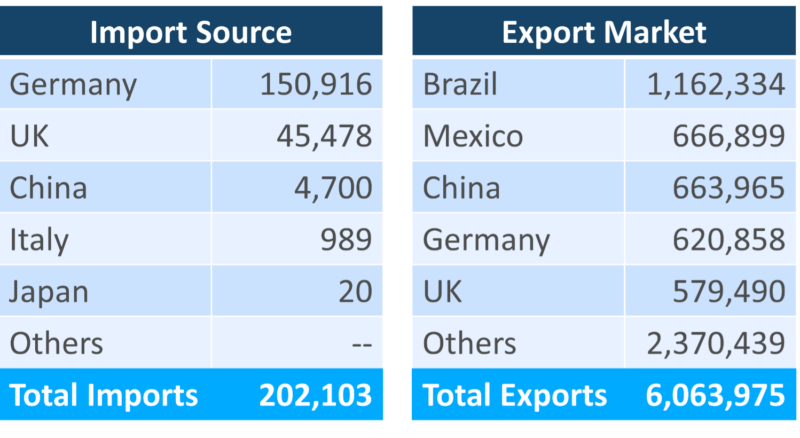
Source: Descartes Datamyne
Also noteworthy is the near balance in hops trade volumes between the U.S. and Germany. The U.S. leads the world in hops production, most of it centered in the Pacific Northwest (where Cascades and Willamettes, among many others, were developed). It is also a top exporter of hops, second only to Germany, source for Hallertauer hops.
How Descartes Datamyne Can Help
Descartes Datamyne delivers global trade data and intelligence with comprehensive, accurate, up-to-date, import and export information that helps companies save significant time in spotting supply and demand shifts, optimizing trade lanes, expanding into new markets and identifying new buyers and suppliers.
Datamyne features the world’s largest searchable trade database covering 230 markets across five continents. Gathered directly from official filings with customs agencies and trade ministries, including bills of lading, our data is detailed (down to company names and contact details), timely and authoritative.
Descartes software solutions include a landed cost tool to calculate the economic viability of importing from a range of markets. Our applications can also screen against multiple denied parties lists simultaneously to help ensure organizations are not doing business with entities named on official government watch lists. Read also Building Supply Chain Resilience for more information.