


The sun may shine on everyone, but for the photovoltaic (PV) cells that convert sunshine into electricity, the world depends on China. Descartes Datamyne trade data provides deep insights for the global energy industry. This article provides an overview of the global solar supply chain and avenues to de-risk and diversify sourcing of PV cells and modules.
Key Takeaways:
- Solar developers are speaking out about the need to diversify solar supply chain to achieve clean energy goals, given reliance on China.
- Uyghur Forced Labor Prevention Act’s (UFLPA) impact on the U.S. solar industry, leading to supply disruptions and delays.
- China’s dominance in the global solar PV market, can pose supply chain vulnerability and geopolitical risks.
- Competing trade policies have increased concentration in the solar PV space, with China now at the forefront.
- The importance of supply chain diversification and the role of global trade data in managing risks and advancing clean energy transitions.
Solar developers and solar panel importers are emphasizing a need to diversify PV supply chains or risk falling far short of clean energy goals, as reported by the Financial Times.
For a preview of the downside risk of over-reliance on a single source, look to the U.S., where the Uyghur Forced Labor Prevention Act entered into force in June 2022. Under the Act, U.S. Customs and Border Patrol (CBP) will deny entry to imports originating in whole or in part from China’s Xinjiang province unless evidence is presented that they were NOT produced by forced labor. By mid-September of this year, CBP reported it had detained 5,346 shipments for examination and denied entry to 2,325. [See the CBP data here.]
According to the Solar Energy Industries Association (SEIA), shipments delayed or denied entry in the worthy effort to curb forced labor, along with new anti-circumvention tariffs imposed by the U.S. Commerce Department, resulted in a 16% drop in new U.S. solar capacity in 2022. Utility-scale installations fell by 31% year-over-year to 11.8 GW, the lowest annual total since before the COVID-19 pandemic. Backlogs continued to slow installations this year. Nor was the impact limited to the U.S. Developers in the EU reported projects stalled due to disruptions in supplies from the U.S. Some projects were shelved as delays coupled with high inflation pushed costs beyond available financing.
China shapes the global solar supply chain
The International Energy Agency (IEA) identifies five stages in the manufacture of solar PV (Figure 1), from the raw material polysilicon, through intermediate fabrication of ingots, wafers, PV cells, through assembly of finished solar panels or modules. China’s share of solar manufacturing at all stages exceeds 80%. This is more than double the capacity China needs to meet its very high domestic demand, leaving plenty for exports.
Figure 1: International Energy Agency’s 5 Stages of Solar PV Manufacturing
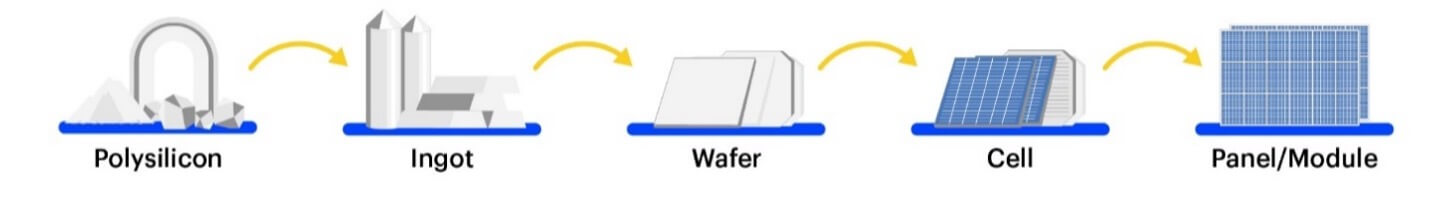
Source: IEA Special Report on Solar PV Global Supply Chains
In its 2022 Special Report on Solar PV Global Supply Chains, the EIA reports more telling statistics. The Xinjiang province accounts for 40% of the world’s polysilicon manufacturing. One out of every seven panels produced worldwide is manufactured by a single Chinese facility. Based on capacity now under construction, China is on track to boost its share of global polysilicon, ingot, and wafer production to almost 95%.
As the EIA comments, the world will rely almost completely on China for the supply of key building blocks for solar panel production through 2025. This level of geographic concentration in any global supply chain would represent a considerable vulnerability; solar PV is no exception. But, as the Ukraine conflict has made starkly clear, geopolitics amplify the risks of over-reliance on a few dominant sources.
China’s quest for solar PV leadership
China’s government formally launched industrial policies designed to achieve global solar supply chain leadership among other strategic sectors in 2010. Stoking domestic demand for solar enabled the Chinese industry to achieve economies of scale and continuous innovation throughout its supply chain. These policies helped drive down costs more than 80%, making solar the most affordable way to generate electricity in many parts of the world. But Chinese manufacturing costs are far more competitive when compared to foreign suppliers.
In 2011, U.S. solar imports from China more than doubled in value (up 115%) and China’s share of the U.S. market jumped to almost 12 percentage points to 48% compared with the year before, according to Descartes Datamyne census data. As Figure 2 shows, 2011 turned out to be the peak year for U.S. solar imports direct from China.
Figure 2: Changing Share of the U.S. Import Market for Solar Panels and Cells
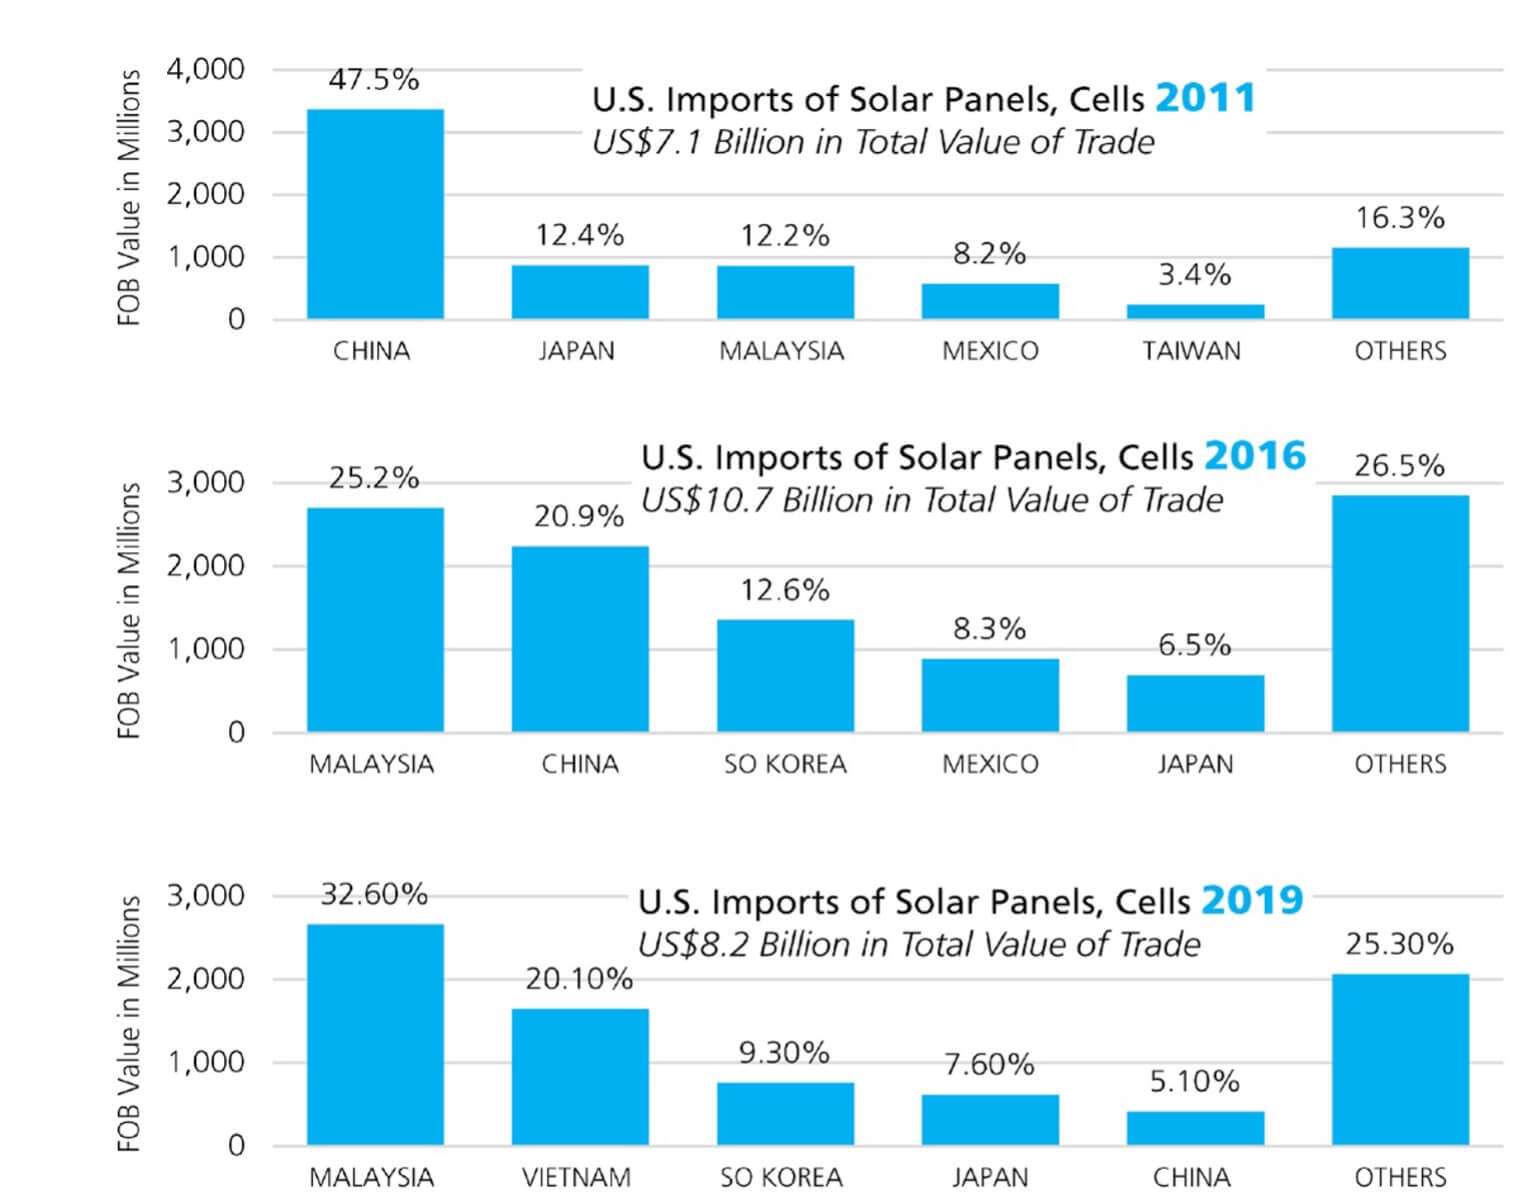
Source: Descartes Datamyne
By 2016, China’s share of U.S. imports had declined to 20.9%, as Malaysia jumped to the top, and China gave way to a more diverse group of sources, the global trade data shows. In the pre-pandemic year 2019, Malaysia’s share accounted for almost a third of total imports, while Vietnam joined the top ranks and China slipped to fifth place.
Figure 3: Top Countries of Origin for U.S. Imports of Solar Modules and Cells Post-pandemic
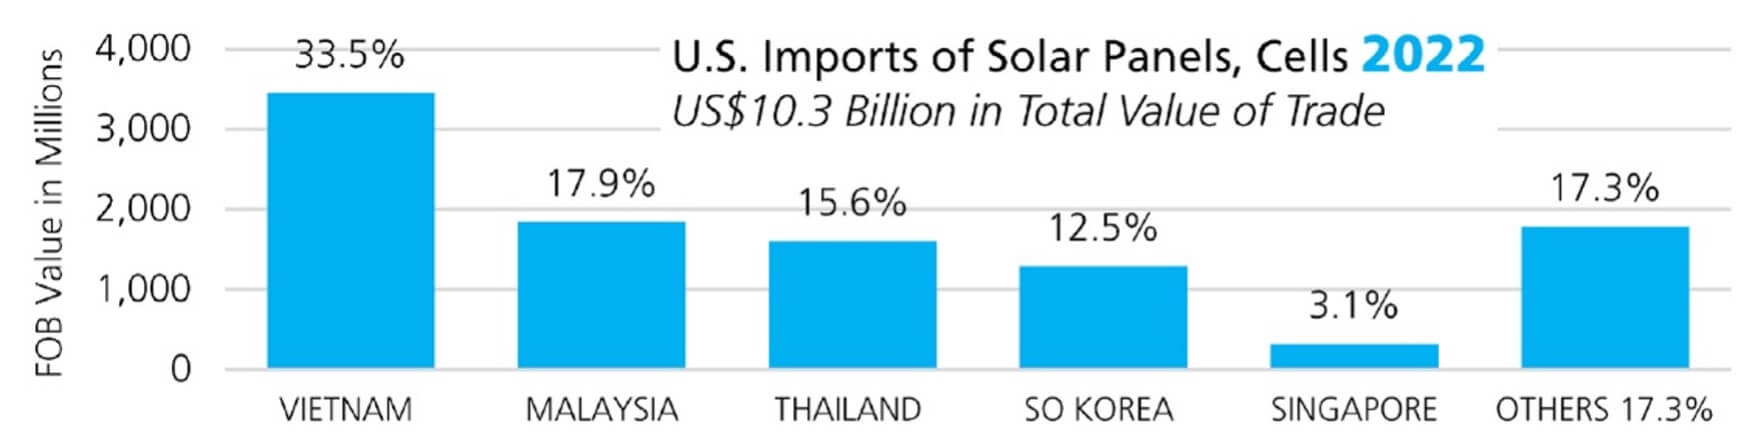
Source: Descartes Datamyne
Successive waves of U.S. tariffs were effective in raising the price of Chinese solar products and slowing imports. In response, China invested heavily in manufacturing capacity abroad. By 2018, the U.S. was applying import duties to stem the tide of imports not only from China but worldwide, plugging what U.S. solar manufacturers called a loophole that exposed them to unfair competition and caused nearly 30 firms to fail, as Solar Magazine reported. At the same time, U.S. solar installers worried that higher trade barriers would push up their costs, thus lowering customer demand, and ultimately put them out of business.
The U.S. and China were not alone in implementing trade policies to protect their domestic industries. The EU, India, and Turkey are among the countries that have implemented solar import duties or other restrictions on solar inputs or finished products. Since 2011, the number of antidumping, countervailing and import duties levied against parts of the solar PV supply chain increased from just one import tax to 16 duties and import taxes, with eight more policies under consideration, according to the 2022 IEA report.
Geopolitics amplify the risks of supply chain concentration
Ironically, the result of competing government trade policies has been more, not less, concentration in the solar PV space. In 2008, the top 10 solar PV equipment manufacturers, operating in four countries – Germany, the U.S., Switzerland, and Japan – accounted for almost 90% of the global market. By 2021, their share had been cut in half. Today’s top 10 manufacturers are all in China and represent 45% of the global market.
While the U.S. may no longer rely on solar panels shipped directly from China, it remains ultimately dependent on suppliers that are owned by or sourcing from China, at least for the near-term.
Leave aside the IEA projection that a reshored U.S. solar module manufacturing capability will still depend on China for inputs. Consider that most U.S. CBP enforcement actions against shipments with Xinjiang-sourced content have been directed at shipments originating in Malaysia and Vietnam, the countries that account for most U.S. solar imports (Figure 4).
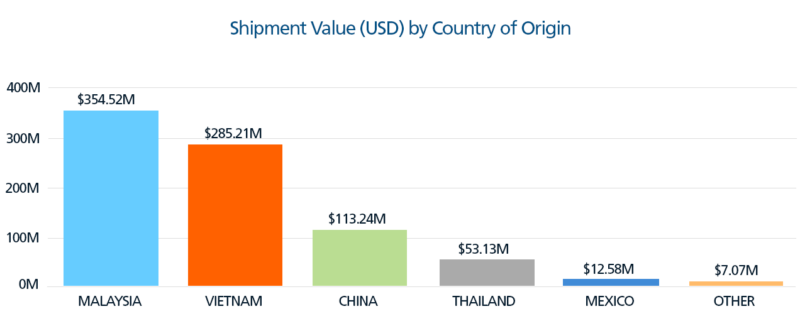
Source: U.S. CBP Uyghur Forced Labor Prevention Act Enforcement Statistics
Of course, governments juggling policy priorities inevitably must make trade-offs. For instance, the U.S. prioritized enforcement of the Forced Labor Act starting in June 2022, and caused shortfalls for solar suppliers and delays in rolling out solar installations. That same month, the U.S. government announced tariffs on cells and modules from Cambodia, Malaysia, Thailand, and Vietnam would be suspended for a maximum of two years to “ensure electric resource adequacy.”
As the IEA notes, the pandemic, record commodity prices, and the Ukraine conflict have underscored how reliant countries are on imports and how vulnerable national economies are to supply chain disruptions.
In the IEA’s view, the time has come to move solar PV supply chain diversification up the policy agenda – not at the cost of delaying, but rather as an integral part of advancing clean energy transitions.
Enhance Supply Chain Visibility with Descartes Datamyne Global Trade Analytics
Global trade analytics offer a bird’s-eye view of trade flows and hubs for companies prioritizing supply chain resilience. Descartes Datamyne Global Trade Analytics (GTA) leverages all our data assets – based on records sourced from 58 trading nations accounting for nearly 80% of world trade – to provide comprehensive views of import and export trade flows, markets and shipping hubs, volume and value trends.
GTA leverages Microsoft Power BI capabilities to streamline and automate the fundamentals of data research. Rules of work, search parameters and filters, visualizations, report formats and frequencies – all the “preliminaries” can be saved to be run automatically as needed. Overviews and variance analyses are provided.
Of special value in the quest for de-risking and diversification strategies, GTA results can be centered on global statistics or company names, making it possible to trace not only the what, when, and where of trade up and down supply chains, but the buyers and sellers who are parties to the trade.