


Tossing aside the Head of Women’s Design for the J.Crew brand and trimming 175 from the payroll, the J.Crew Group last week announced alterations aimed at “critical improvements to our J.Crew women’s assortment including fit, design aesthetic and styling.”
As Business Insider reported here and here, J.Crew’s inventory has been piling up while sales have stalled, with a resulting drop in operating income of 54% in first-quarter 2015.
You can blame it on a sweater – a long-sleeved, cropped, merino-wool, crew-neck sweater called the Tilly. J.Crew executives have. CEO Mickey Drexler called last season’s Tilly “a big mistake” on an earnings call. He also said the brand failed to deliver the right cardigan.
In fact, the retailer of an upscale “lifestyle” brand of apparel missed anticipating its customers’ tastes in fashion by a wide margin across its women’s line – which really is bad news for J.Crew. It is one of those US businesses that doesn’t actually make products, but invents and markets them. According to J.Crew’s latest 10-K, its merchandise is sourced from 230 vendors who operate 385 factories in 22 countries, but the bulk comes from Asia, mostly China and Hong Kong. Only 2% is sourced from the US.
When Lululemon (another lifestyle brand we’ve covered) lost its luster, it traced problems with product quality to its offshore suppliers. But J.Crew’s woes seem to be down to its poor fashion sense (coupled, suggests the New York Times, with its rich price-tags).
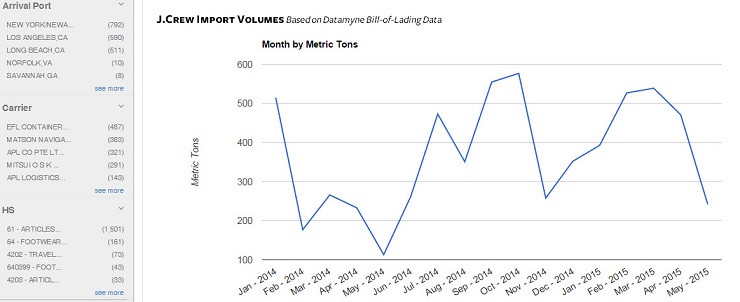
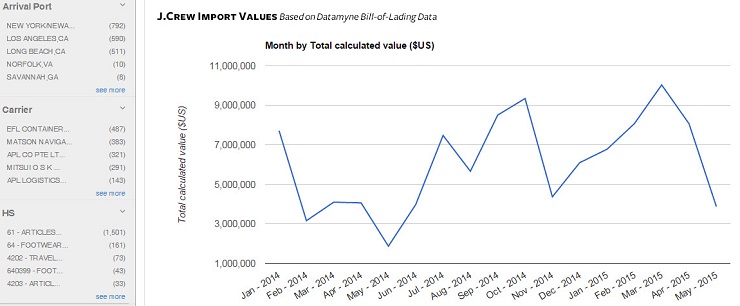
You can track J.Crew inventory inflows with our US import bill-of-lading data – now easier to see than ever on our new Datamyne 3.0 platform. Here are shipment volumes and values month-by-month, January 2014 through last month:
The Datamyne 3.0 Trade Partners Tree offers a graphic way to trace supply chains: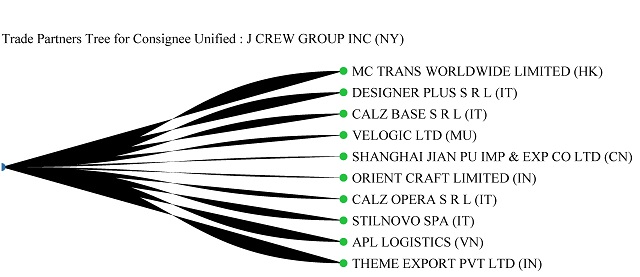
As always, you can also drill down to the individual shipment records for more detail. (We looked at the bills of lading data and found last season’s merino-wool sweaters shipped from Hong Kong.) Or link to our Profiles of consignees and shippers for a month’s worth of the company’s trade stats, business demographics, and contact information.
If you’d like to see more data about this or any other cross-border supply chain – contact us.
Related: