


Descartes Datamyne global trade data shows merchandise imports cresting in May for the second year in a row, well ahead of the traditional August-October peak shipping season. Consumers are expected to spend more on holiday shopping, but they are spending earlier on merchandise imported months ago. Meanwhile, third-quarter waterborne imports have dropped sharply.
For U.S. retailers, ’tis the season to be (cautiously) optimistic assures McKinsey & Company, citing market research that finds consumers are ready to spend on year-end holidays despite uncertainty about the new year’s economy. Indeed, more than half reported they began shopping for Christmas well before Halloween.
The National Retail Federation’s forecast for retail sales projects a November-December increase in the range of 6% to 8% compared to 2021, besting a year-over-year gain of 4.9%, on average, over the past 10 years. The NRF also reports more consumers kicking off the shopping season in October.
Last year, anticipating shortages due to supply chain bottlenecks, retailers urged consumers to shop early before shelves emptied. This year, having built up record stockpiles of inventory as economic headwinds slowed consumer buying, retailers began luring shoppers with deep discounts and promotions well before summer’s end.
Following import volumes peaking in May for the second consecutive year, businesses curtailed overseas orders for merchandise, resulting in a precipitous decline in inbound shipments in September, as the global trade data in the following chart shows (See Figure 1).
Figure 1: U.S. Container Import Volume Year-over-Year Comparison
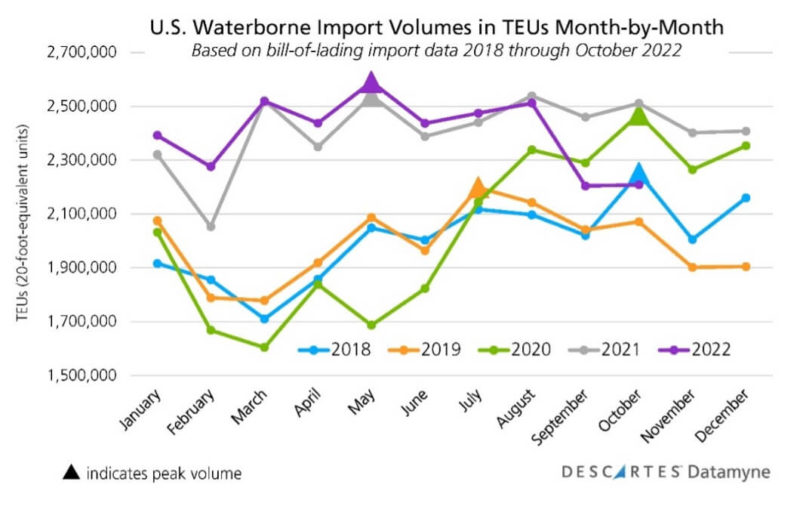
September’s 11% year-on-year drop in U.S. waterborne import volumes was the steepest since 2020’s pandemic lockdowns. In October, imports posted a year-on-year loss of 13% compared with 2021, and underperformed 2020 by 11%. Based on currently available data, October TEUs eked out a fractional gain over the preceding month. (See also the Descartes Global Shipping Crisis Report for October 2022).
A decline in TEUs during what is supposed to be the peak shipping season is not without precedent, as the following review of the archives illustrates:
- In 2019, U.S. tariffs on imports from China consigned the traditional peak shipping season to the ghosts of Christmases past.
- In 2018, importers rushing to stock up ahead of then still pending tariffs helped lift peaks to record heights.
- Even further back, in 2015, retailers’ excess inventories help depress peak period import volumes.
The key (but by no means the only) disrupter of established trade patterns in 2021-22 has been the aftermath of the global pandemic, which fueled demand for consumer goods while choking global supply lines. Now goods ordered as a hedge against more shortages have become excess inventory, lifting the inventory to sales ratio to 1.33 in September (it was 1.38 in 2015).
Next year, it may be inflation, recession, or war – or something unforeseen – that shifts trade patterns. As the global trade data makes clear, the timing and amplitude of peak shipping has become highly variable.
Unpacking this year’s peak shipping
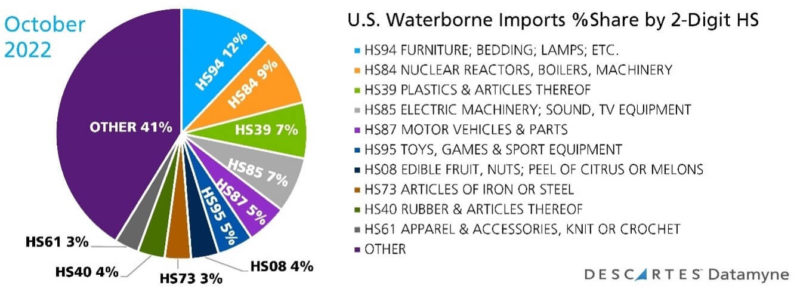
Our global trade data indicates little difference in the mix of merchandise received in peak-month of May (see Figure 2) versus October (Figure 3). This, too, represents a break from previous trade patterns. For example, imports of toys, games & sports equipment [HS95] generally surge in the peak month, ranking fifth among product categories by volume, eclipsing motor vehicles & parts (HS87). Not so this year, as a comparison of these charts shows.
Figure 2: U.S. Imports in the peak month of May 2022
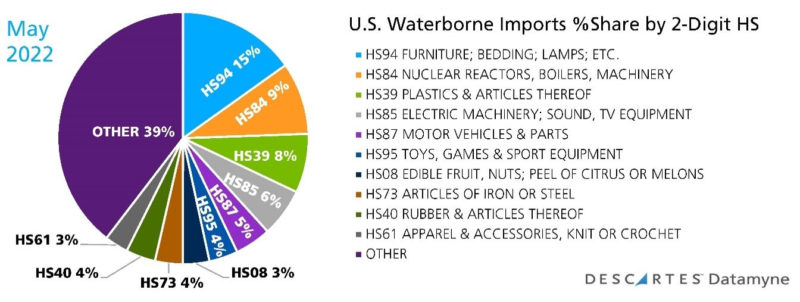
Figure 3: U.S. Imports in the month of October 2022
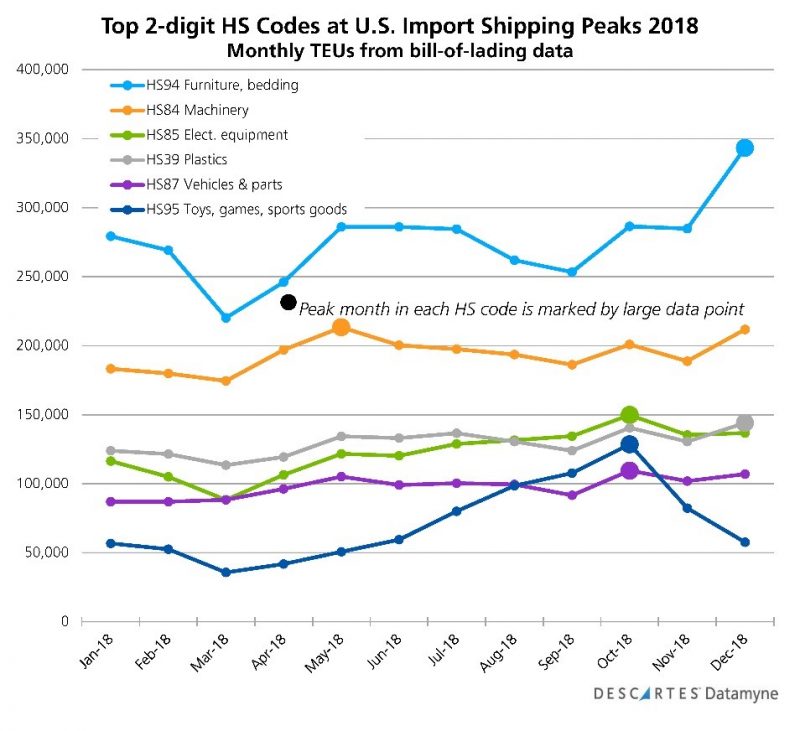
A review of the global trade data finds that in past years (see 2018, for example), shipments of machinery [HS84] would peak in the spring, while furniture [HS94] and plastics [HS39] would crest at year-end. Electronics [HS85], toys [HS95], and cars [HS87] – generally in that order – typically reached top volumes in October.
A dive into the data at the six-digit HS code level does reveal a late-season surge in some imports clearly associated with year-end holiday demand, as this graph shows (Figure 4)
Figure 4: Import surges associated with year-end holiday demand
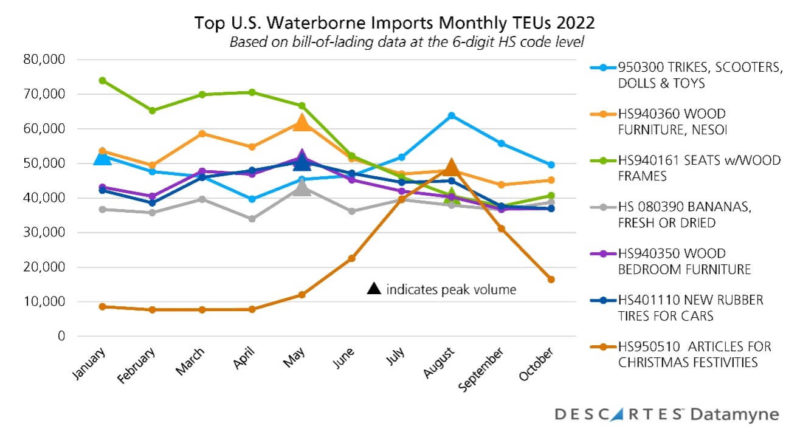
The first five products in the graph above (Figure 4) consistently ranked as the top five by volume month-after-month this year, with two exceptions: Bananas [HS080390], routinely among the top 10 U.S. imports, jumped into fourth place in the volume rankings in October. Well down the rankings for most of the year, articles for Christmas festivities [HS950510] vaulted into second place just behind trikes, scooters, dolls & toys [HS950300], with both product categories reaching peak volumes in August – an earlier peak than in 2018, perhaps, but within the traditional peak shipping season.
Note that, together these seven product categories consistently accounted for 12% to (with a lift from holiday decorations) 13% of waterborne import volumes each month.
More global trade data to unpack in the New Year
As happens every five years, a fresh edition of the Harmonized System of tariff codes entered into effect in 2022, creating new opportunities to develop data-based global trade intelligence.
The World Customs Organization (WCO) is charged with updating HS classifications to reflect the evolution of products and commodities in cross-border commerce, adding codes as trade in new products grows, and eliminating codes for products in which trade has become negligible.
The 2022 edition added 350 new tariff codes to denote products that have gained in global markets, including smartphones, drones, and 3D printers. In a nod to the usefulness of the HS in gathering data on the global movement of goods and resources, new classifications for e-waste, photovoltaic DC and AC motors, and other alternate energy system components are provided.
The first full year of U.S. Census data for these newly classified products will be available in first-quarter 2023. The next graphs (Figures 5 and 6) offers a preview of the data available for the smartphone under new header HS851713 (previously denoted by HS8517120050).
Figure 5. U.S. Imports of Smartphones 5-Year Trend (Based on Census data for HS8517120050 (through 2021) and HS851713 (through September)
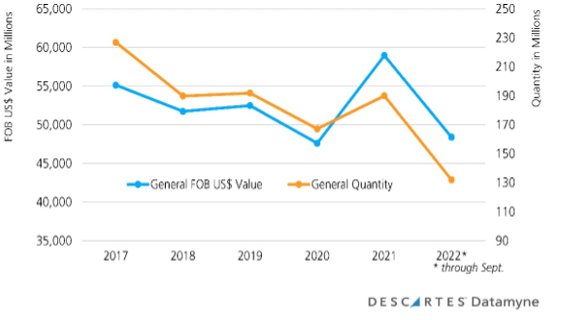
Figure 6: U.S. Imports of Smartphones Value and Volume (Based on Census data (new code) HS851713 in 2022 (through September)
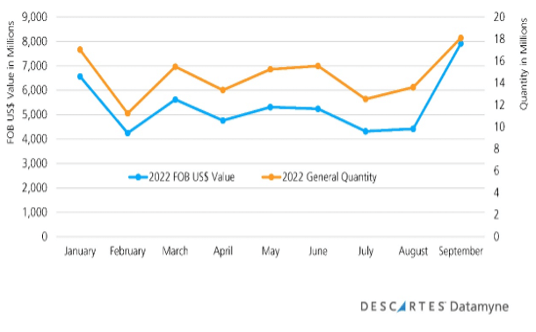
Note that the currently available data under the new code suggests a traditional peak shipping surge (along with an increase in price) in imports – an indication, perhaps, that smartphones will be among the top gifts this holiday season.
How Descartes Datamyne Can Help
Descartes Datamyne delivers global trade data and intelligence with comprehensive, accurate, up-to-date, import and export information that helps companies save significant time in spotting supply and demand shifts, optimizing trade lanes, expanding into new markets and identifying new buyers and suppliers.
Datamyne features the world’s largest searchable trade database covering 230 markets across five continents. Gathered directly from official filings with customs agencies and trade ministries, including bills of lading, our data is detailed (down to company names and contact details), timely and authoritative.
Descartes software solutions include a landed cost tool to calculate the economic viability of importing from a range of markets. Our applications can also screen against multiple denied parties lists simultaneously to help ensure organizations are not doing business with entities named on official government watch lists. Read also Building Supply Chain Resilience for more information.