


U.S. sparkling wine imports continue to rise, data from Descartes Datamyne reveals. Champagne still provides a year-end holiday lift, but Spain’s cava and – especially – Italy’s prosecco are boosting volumes all year round.
The bubbly is not just for New Year’s Eve anymore. Our import data indicates U.S. consumers find reason to pop, fizz, clink on just about any occasion – and not only with champagne
Champagne is still the choice for welcoming the New Year, helping to lift sparkling wine imports in the months before the winter holidays. As this chart illustrates, this year’s peak is 5.42% ahead of last year’s volume, and 11.39% higher in value:
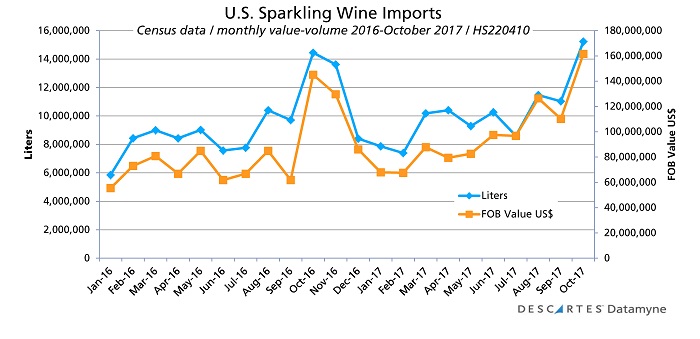
Much of the increased value is accounted for by seasonal shipments of champagne. The leading French export among sparkling wines is costlier than Italy’s prosecco and Spain’s cava. Together, these three dominate U.S. sparkling wine imports.
Sparkling Wine Imports: Champagne Taste, Prosecco Budget
Marketed as lower-cost alternatives to champagne, and promoted as “year-round” drinks that can be enjoyed at summer barbecues as well as New Year’s Eve parties, the Italian and Spanish sparklers have reshaped import trade.
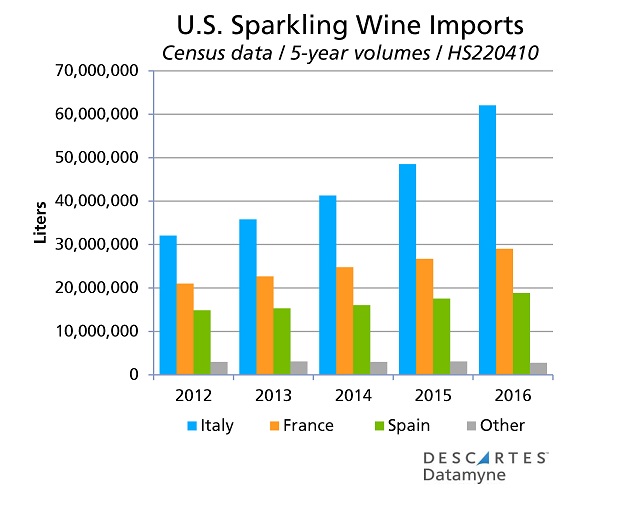
Look at the difference a decade has made in U.S. sparkling wine imports between 2007 and 2016:
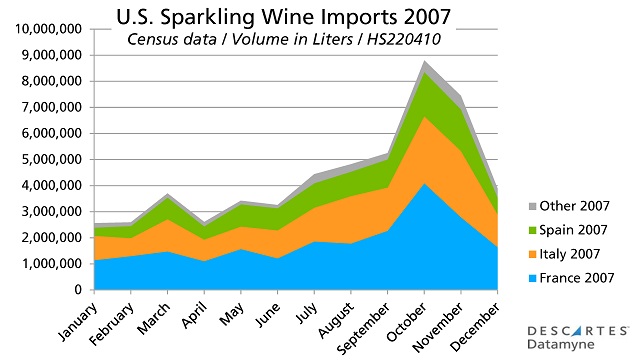
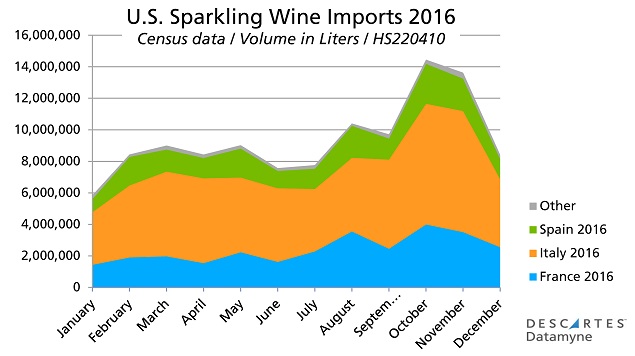
The volume of imports has more than doubled since 2007, increasing 113% over 10 years. There is still an October-November peak shipping season, but the peak is not quite so steep. Volume jumped 68% between September and October 2007, compared with a 49% climb in 2016.
U.S. market share by product category has also shifted. In 2007, France held 42% share by volume, followed by Italy with 32% and Spain with 20%. As of 2016, both France and Spain had ceded share, falling to 26% and 17% respectively, while Italy’s sparklers commanded 55% of U.S. imports.
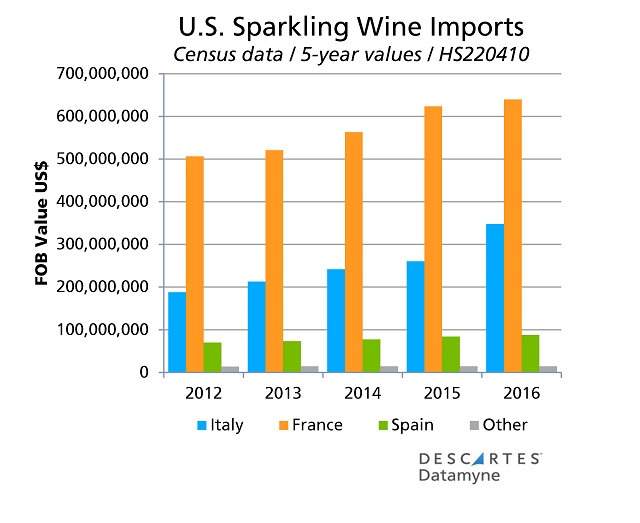
France maintains the lead in U.S. sparkling wine imports when the measure is value, but Italy is well ahead when the yardstick is liters, as the next charts illustrate:
The top destination for sparkling wines, according to our 2016 global trade data, the U.S. is following the global trend in uncorking more prosecco. According to the OVSE, the Italian Wine Observatory, prosecco global sales first outstripped champagne’s (307 million bottles against 304 million) in 2013.
Some good news (from The Sip) for French vintners: buoyed by millennials and hip-hop, sales of champagne are on the rise in the U.S., the world’s top market for champagne ranked by value, No. 2 by volume.
More worrisome for France’s exporters is Brexit and the possibility that ensuing economic woes and trade barriers will staunch the flow of champagne to the U.K., the No. 1 destination for the bubbly by volume in 2016, according to Decanter. But that is a trade story for the New Year.
However you choose to ring in 2018, may the year be a happy and healthy one for you and those dear to you.
Related:
From our blog: