


To share a report on Tesla Model S export data, as we did last month, is to engage a community of avid Tesla watchers eager to see more data.
Download the New Tesla Model S Exports Free Report (2015 vs. 2014).
That’s because Tesla Motors is not only pioneering new automotive technologies with its electric vehicles (EVs), the company is breaking ranks with the rest of the automotive industry to pursue a new business model for marketing, selling and delivering cars.
So, for instance, the company does not sell its EVs through authorized dealerships; it sells directly to customers through a network of strategically-located interactive “Tesla stores.” These stores do not carry significant inventory and buyers may wait up to months from the time they place their orders until they receive their “custom manufactured” vehicles.
In another break with conventional automotive industry practice, Tesla does not release monthly vehicle sales. It reports quarterly vehicle deliveries – which added up to 31,655 Model S deliveries for 2014. Like every element of the Tesla game plan, withholding sales figures has its (sometimes quite passionate) fans and critics. The undeniable result is that Tesla watchers scramble for other indicators to supplement and interpret the information the company does release.
That’s where Datamyne’s US export data comes in: Based on the manifests filed by exporters, the data captures a majority of shipments from Tesla Motors to its overseas markets. Datamyne has been using this data to track monthly Tesla EV shipments, useful for keeping tabs on the direction of Tesla foreign market sales, and is making this data available by subscription.
Our free sample report of shipments of Tesla Model S sedans in 2014 – released in April to promote our new subscription product – has been snapped up. Based on conversations with analysts, we have refined our trade data mining methods to home in on Tesla EV shipments using the car maker’s code embedded in the Vehicle Identification Number – or VIN – that uniquely identifies each car.
We’ve revised our free sample report on 2015 vs. 2014 month-to-month counts by country market accordingly – and you can download the revised report here. If you downloaded the earlier report, you’ll see that the change in methodology yields more comprehensive results. For instance, we now count a total of 6,539 vehicles shipped in 2014 compared with the 5,313 we reported in April.
There are few changes in our initial country market rankings. The most notable is that the number of shipments bound for the Netherlands (2,669) exceeds those bound for China (2,388).
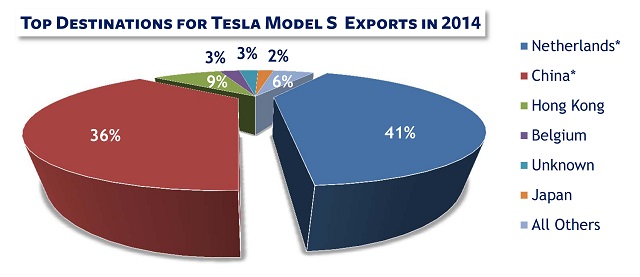
*Note, however, that given the available data, China remains the top single country market for Model S EVs, as reported earlier, as the Netherlands deliveries include those arriving at Rotterdam and destined for Tesla’s pan-European distribution center in near-by Tiburg. The Netherlands report of 1,465 registrations of Model S in 2014 indicates that the majority of vehicles shipped through Rotterdam moved on to buyers throughout Europe.
Related:
- To download our FREE Tesla Model S 2015 vs. 2014 report, click here.
- To inquire about subscribing to our up-to-date monthly Tesla report, contact us.
- You may also be interested in our blog posting Seeking Alpha Cites Datamyne in Inquiry into Tesla Deliveries