


Whiskies were the top tipple in U.S. trade in distilled spirits in 2016, with one notable exception.
Our 2016 U.S. Census-sourced data shows whiskies with the leading share of imports by value (27%) and volume (31%), and exports by volume (76%) of trade in the category of distilled spirits (HS 2208). Brandies accounted for 62% of U.S. liquor exports by value, taking top share for the first time last year. Vodka ranks No. 2 by value and volume among U.S. imported spirits – as these pie charts from our annual report Descartes Datamyne Quick Look @ US Trade in Distilled Spirits illustrate:
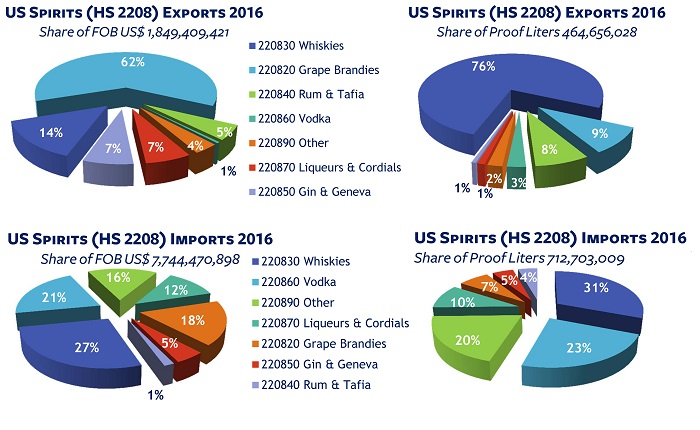
While the export volume of U.S. distilled spirits (HS 2208) increased in 2016 by 3.52% to 465 million proof liters, the value (here, FOB – Freight on Board) dropped to US$1.8 billion, down 5.96% from 2015.
Meanwhile, the U.S. imported 713 million proof liters of spirits valued at US$7.7 billion in 2016, representing a 6.3% increase in volume, and a 6.65% increase in value over the preceding year.
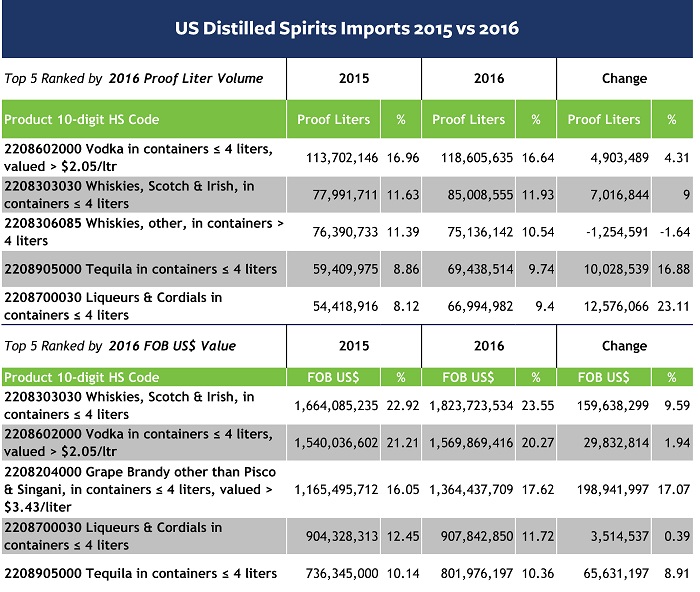
A breakout of the 2015-16 trade data by 10-digit Harmonized System code (the top 5 imports and exports by value and volume are summarized in the tables below) shows that the volume of U.S. exports of brandies surged nearly 70% for a gain in value of 6.16%.

U.S. Trade in Distilled Spirits: Dollar’s Impact
The 10-digit HS code breakout reveals an interesting shift in U.S. trade in distilled spirits:
Exports of whiskies except bourbon – that is, rye and Tennessee – showed robust growth, as forecast last year [see Whiskey, whiskey: Top US distilled spirits]. In containers up to four liters, whiskies (HS 2208309020) were up 25% by volume, 64% by value.
Exports of bourbon whiskies, however, faltered: As shown in the table, volume growth was flat for bourbon in containers larger than four liters (HS 2208306040), as value edged down -1.7%. Ranked below the top 5 (and therefore not included in the table), the volume of bourbon in containers up to four liters (HS 2208306020) dropped precipitously by 63.6% while the value of these bourbon exports fell by 70%.
What’s happening here? The growing taste for “brown spirits” is confirmed by last year’s increase of nearly 8% in domestic sales of bourbon, Tennessee whiskey and rye whiskey, reports Louisville Business First. In markets abroad, however, the strong dollar jacked up prices and dampened sales of the American-made products, according to the Distilled Spirits Council.
Other factors are at work in key markets.
In Australia, imports of this distinctive U.S. product are down sharply, as this chart shows:
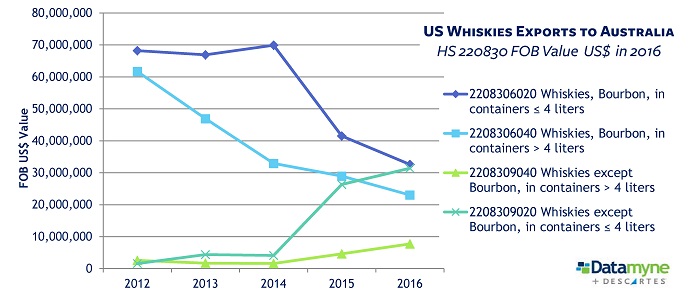
The chart also shows shipments of the other American whiskies on the rise, a sign of diversifying tastes in Australia. Another possible inhibitor of bourbon sales down under: the rise of domestically distilled “bourbon style” whiskies.
Top Markets for the Top Tipple
The top destinations for U.S. trade in distilled spirits in 2016 ranked by US$ value were Canada (with “other” leading the list of 10-digit HS codes, followed by bourbon). Ranked next in order: Panama (whiskies and brandies), the Netherlands (whiskies and brandies), the U.K. (whiskies), and Australia (bourbon and whiskies). Note that the U.K. slipped from top customer for U.S. spirits in 2015 to No. 4 with a 46.3% drop in US$ value of exports.
When the ranking is by volume, the list of markets for U.S. spirits is reordered, with Panama going to the top, followed by Spain (bourbon), Canada, Australia, and the Netherlands rounding out the top five.
North America Free Trade Agreement (NAFTA) partners Canada (whiskies) and Mexico (tequila) lead the countries of origin for U.S. imports of spirits, followed by the U.K. (whiskies), France (brandy and vodka) and Sweden (vodka), ranked by volume. The top five ranking changes when the measure is value: France, the U.K., Mexico, Ireland (whiskies), and Canada.
Related: