


When COVID-19 shut down retail outlets, sales inevitably faltered. Then stuck-at-home consumers decided to redecorate – or move on and furnish someplace new – and orders for furniture surged. Sales are better than expected, but less than they might have been had supply kept up with demand.
While generally decimating sales of consumer goods, the pandemic lockdowns boosted demand for products that promised to make staying at home day-in and day-out more bearable. Retailers of comfy loungewear, video games and home furnishings were among those who profited.
Now that COVID-19 restrictions are being eased, market watchers are looking for pointers to “the new normal.” For furniture, growth appears to have held steady through April. Indeed, gains in shipments have more than made up for ground lost in the year of the pandemic and are reaching new heights. Descartes Datamyne global trade data illustrates the impact on imports, which account, in whole or in part, for a majority of U.S. furniture sales.
Here’s a comparison of the first four months’ value of U.S. furniture imports (denoted by Harmonized System tariff code 94) across the five years from 2017 through 2021:
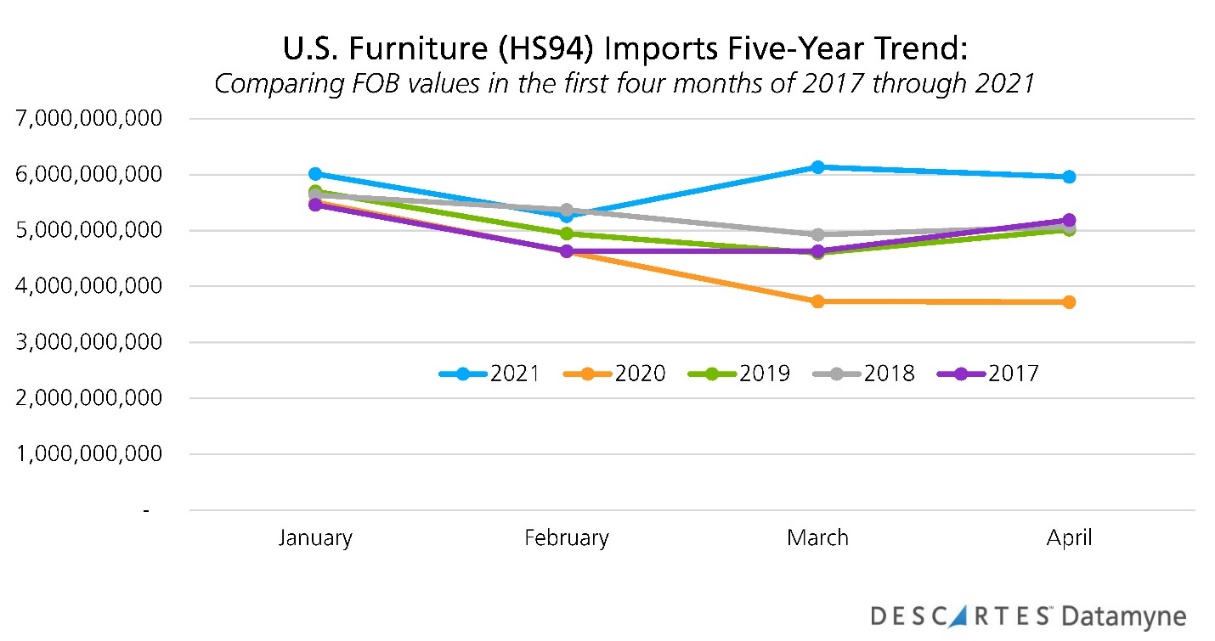
The data lends credence to the belief that this year’s surge in demand is driven by a shift in consumer behavior, and not just a glut of purchases deferred by the pandemic. The value of U.S. furniture imports in first-quarter 2021 was 26% higher than in 1Q20, an historic gain that goes well beyond recovering the 9% year-over-year loss incurred at the height of COVID-19 restrictions. The value of this trade in 1Q21 was 14% higher than in 1Q19, 9% above 1Q18, and an 18% improvement over 1Q17.
Note that tariffs on furniture imports helped squeeze inbound shipments in 2019, resulting in a 4% year-on-year decline in value. Conversely, the anticipation of tariffs accelerated shipments in 2018; the first quarter that year posted an 8% year-on-year gain. (Coming before punitive tariffs and pandemics, 2017 may be the better benchmark year.)
The global trade data from Descartes Datamyne indicates that the tariffs of 2018-19 were only partially successful in achieving their intended objectives. As the next chart shows, China’s share (by FOB value) of U.S. furniture imports fell under the weight of punitive tariffs – though the pandemic likely gets more credit for the sharp drop in 1Q20.
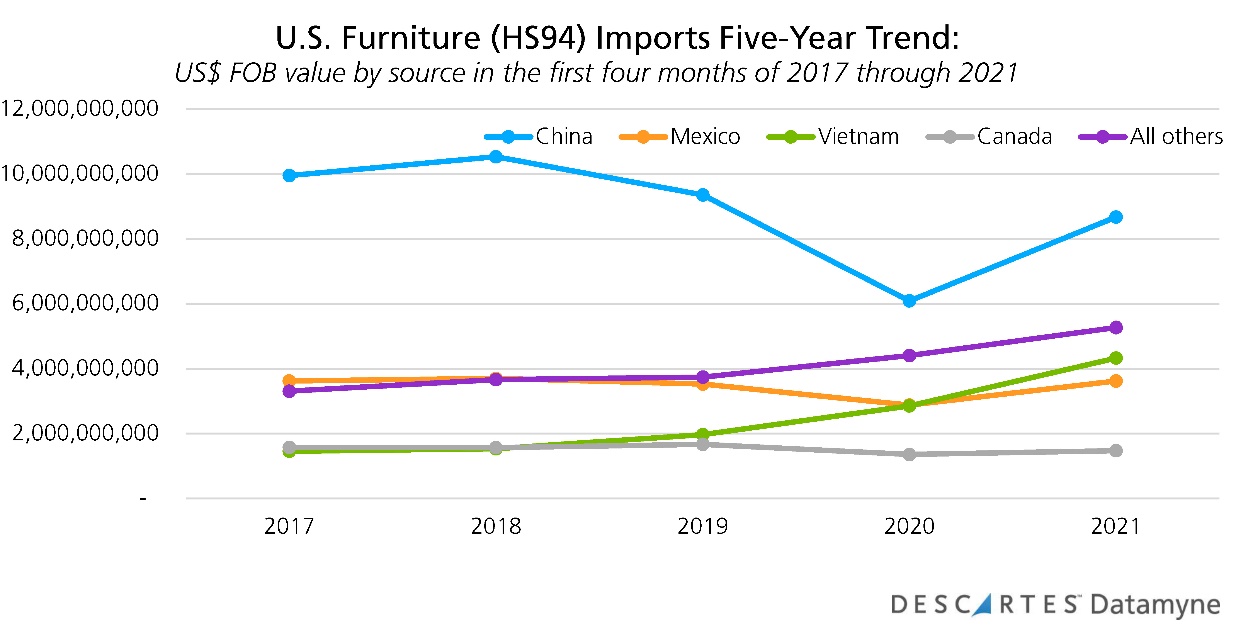
But the tariffs have not to date resulted in a reshoring of U.S. factory production, as the Wall Street Journal reports. Instead, U.S. companies have turned to other countries for supply.
For furniture companies, the up-and-coming center of production is Vietnam. Now the sixth largest source of U.S. imports overall, Vietnam is the second-ranked source for inbound shipments of furniture. Vietnam accounted for 19% by value of this trade in the period from January through April 2021, behind only China with a 37% share. Just five years ago, Vietnam ranked third with a 7% share, while China supplied 50%.
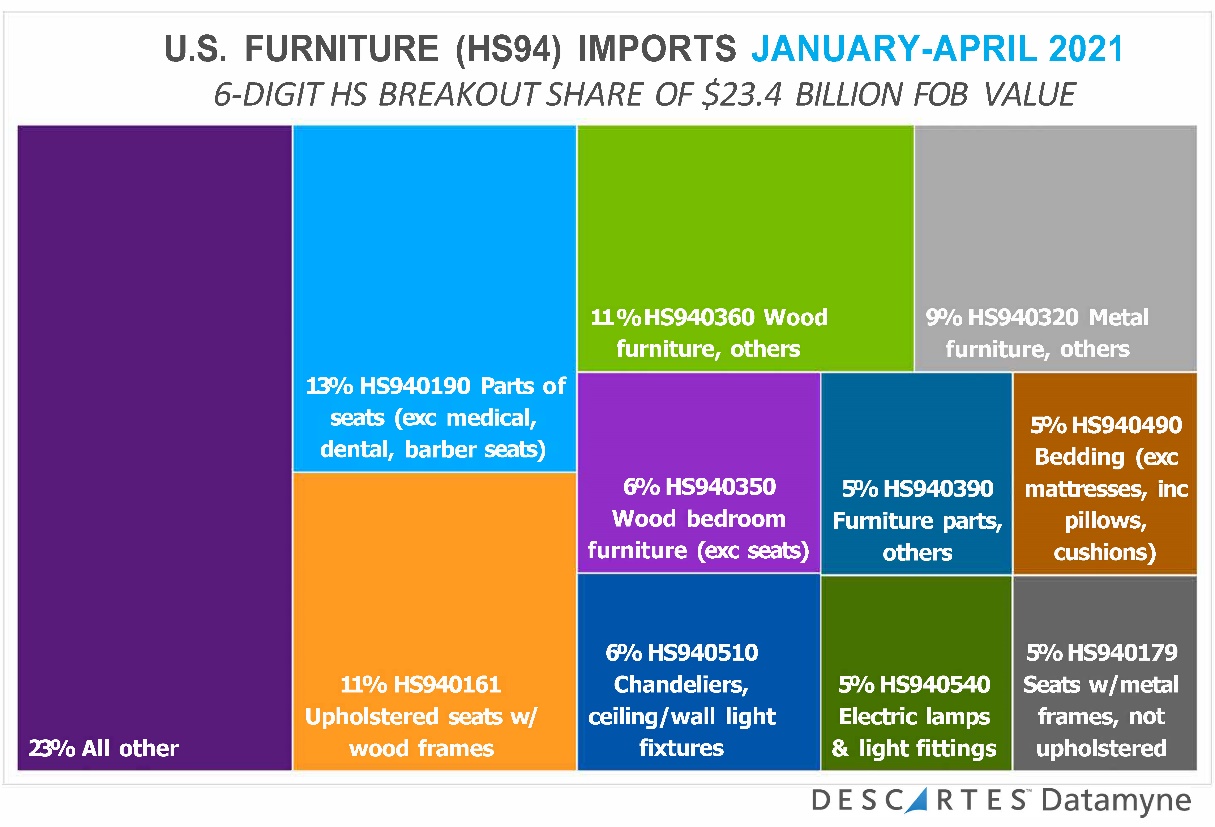
Significantly, Vietnam is the top source for U.S. imports of wood furniture (HS940360 and HS940350 in the chart below), with a 43% share of this market, followed by China with 15%.
The supply-demand imbalance
The 2021 furniture import trendline departs from the pattern of recent years with a sharp rise in March. The precipitous decline of March 2020 is, of course, due to the imposition of Covid-19 lockdowns. But shipments also dipped in March in 2019, 2018 and 2017.
Also running contrary to prior years, this April saw imports decline 2.9% from March – compared with nearly flat growth from March to April in 2020, and a 2.9% month-to-month gain in 2018.
Is this slippage an indicator of slackening market demand? Not necessarily. Global supply chain snarls seem to be putting the brakes on deliveries, not a falling off in orders.
In fact, Highpoint accountants and consultants Smith Leonard found (as reported in Furniture World News) that new orders this March were up 96% over March 2020, when the pandemic closed furniture sellers. Orders placed in the first quarter of 2021 were up 50% over the same period in the year of COVID-19.
More evidence that the buying surge has been driven by more than pent-up demand: March 2021 orders recorded a 40% increase over those of March 2019, and 1Q21 orders posted a 38% increase compared with 1Q19.
Domestic shipments have also increased, but to a lesser degree. This March’s shipments were up 34% over March 2020, and 19% above March 2019. The first quarter’s shipments posted a gain of 19% over 2020, and 15% above 1Q19 levels.
As deliveries have lagged behind orders, backlogs have soared, up 251% in March compared with March 2020, and 229% over March 2019. So far, retailers report no significant increases in order cancellations. But furniture companies stymied by shortages of raw materials, labor, and containerized shipping capacity worry: Will consumers be willing to wait nine months or more for a new couch?
Global supply strains
Global supply chains are straining to meet demand driven by two irresistible forces: the need to recover and restock after the COVID-19’S disruptions and the desire of consumers to splurge on goods and services to make up for the pandemic’s deprivations.
The unprecedented nature of the demand is underscored by the U.S. import data: Import volumes have exceeded two million TEUs each month for a record 11 months in row – as this chart illustrates:
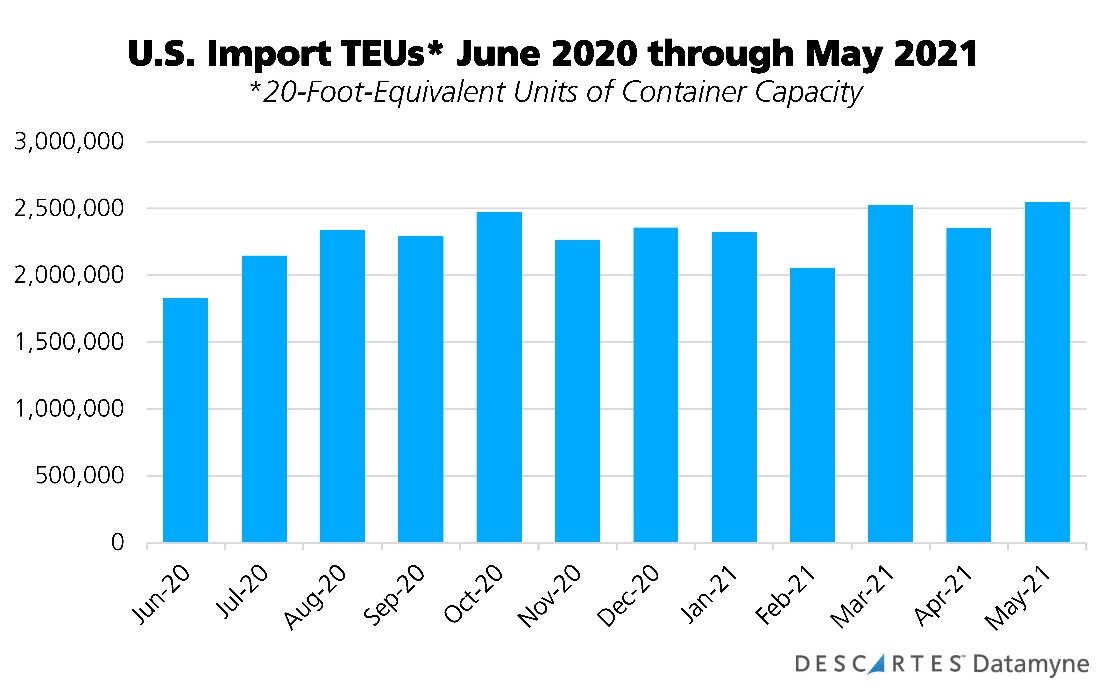
The high throughput has carried the top U.S. port of entry to record heights: In June, Los Angeles became the first port in the Western Hemisphere to process 10 million container units in a 12-month period.
Even so, the lack of containers and long waits for terminal space at ports continue to compound shortages up and down supply chains.
As John W. Butler, president and CEO of the World Shipping Council, told a House Subcommittee hearing on the impact of the delays on the North American supply chain, the problem is not so much that there are not enough containers, but that containers are not moving through the supply chain as they should.
“The bottom line is that congestion exists at each of these intermodal links in the supply chain,” Butler continued. “Container shortages—the subject of this [June 15] hearing—are being caused by the fact that thousands and thousands of containers are stuck aboard ships at anchor, on port terminals waiting to be picked up, on railcars and trucks, waiting to be unloaded, and at inland warehouses and distribution centers that cannot process cargo fast enough to empty containers and put them back in circulation. Therefore, it is taking much longer to move cargo, and until the cargo moves, the equipment it sits upon is idled and cannot be used to move additional cargo.”
In the wake of tight supply come price increases. Bloomberg reports transport, storage and inventory costs are nearing record highs in the U.S. Federal Maritime Commission chair Daniel B. Maffei, testifying before the House subcommittee hearing, said that the cost of a container has gone up to four times what it cost last year. He added: “Just finding space on a carrier is very difficult. And even if a shipper’s box does make it on the ship, there will likely be substantial delays in transit time.”
On June 14, the National Retail Federation delivered a letter to the White House asking to meet with President Biden and other top administration officials regarding the challenges retailers are facing from continued supply chain disruptions, especially the congestion affecting key maritime ports.
One day later, the Department of Commerce released its monthly retail and services sales data for May. Retail sales overall declined 1.3% in May. While retail furniture sales in the first five months of 2021 were up 40.5% compared with 2020, sales began to falter in May, declining 2.1% from April.
Exports missing out on the boom
In his testimony to Congress, Maffei expressed particular concern about the effects of higher prices and lower availability of containers on U.S. exports. “While carriers are actually moving more exports than in previous years, the increase does not match the boom in imports. Moreover, the amount a carrier makes moving an import container is so much compared to what they make on an export box that, in some cases, a ship will carry fewer containers full of exports than its capacity in order to more rapidly move empty containers back to foreign ports and fill them with new U.S.-bound imports.”
Descartes Datamyne global trade data confirms that furniture exports do seem to be missing out on the post-pandemic boom in trade. The value of this trade only began to recover in March and remained below previous years in April, as this chart shows:
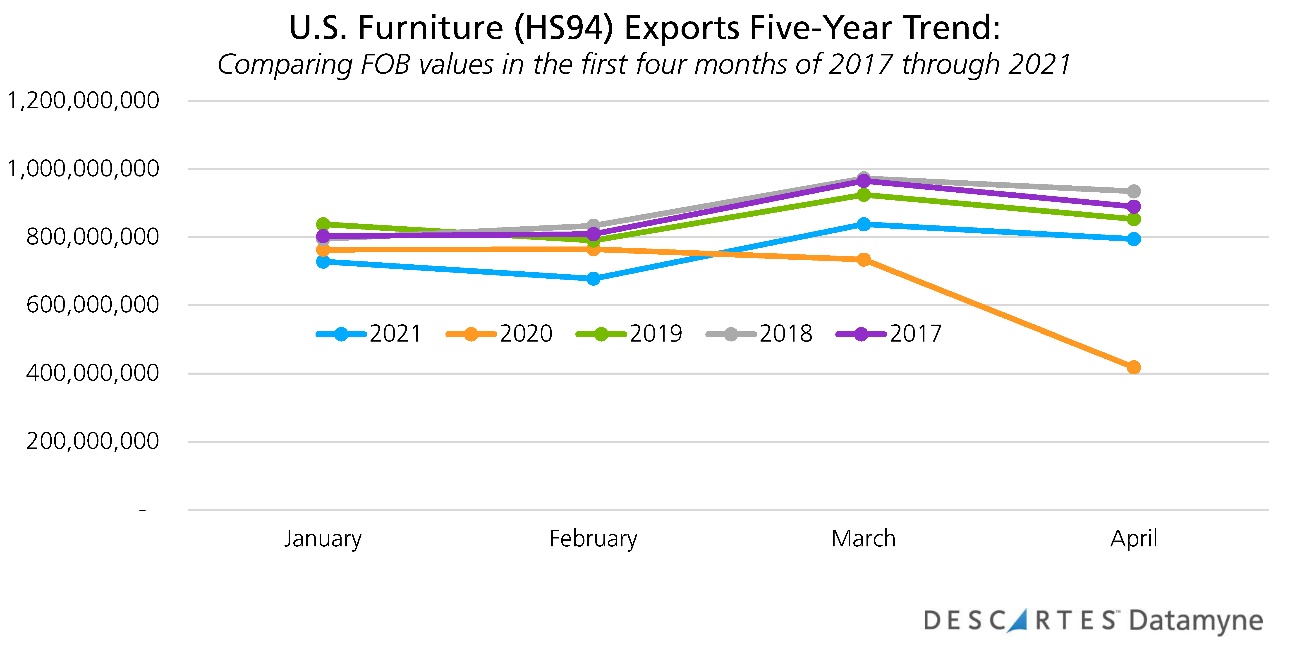
While delays in getting out through the maritime trade gateways is a contributing factor, the bigger obstacle to U.S. export recovery is that the rest of the world has not emerged from the pandemic shutdown and started shopping again. Testified Butler, “The epicenter of the import cargo surge and import/export imbalance is the United States.”
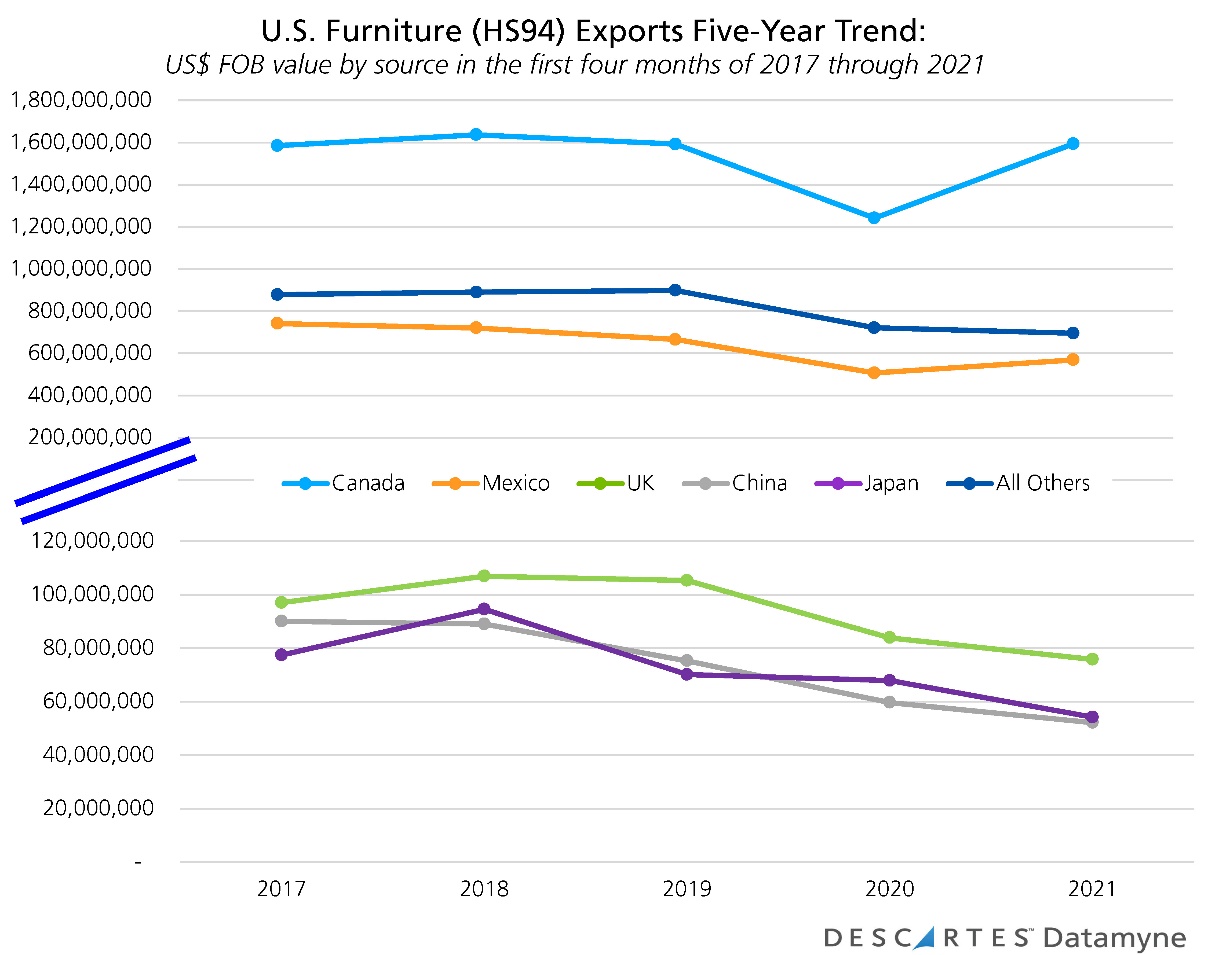
The trade data supports this view. With the exceptions of the North American trading partners, Canada in particular, demand from the top destinations for U.S. furniture exports has yet to rebound, as this chart makes clear:
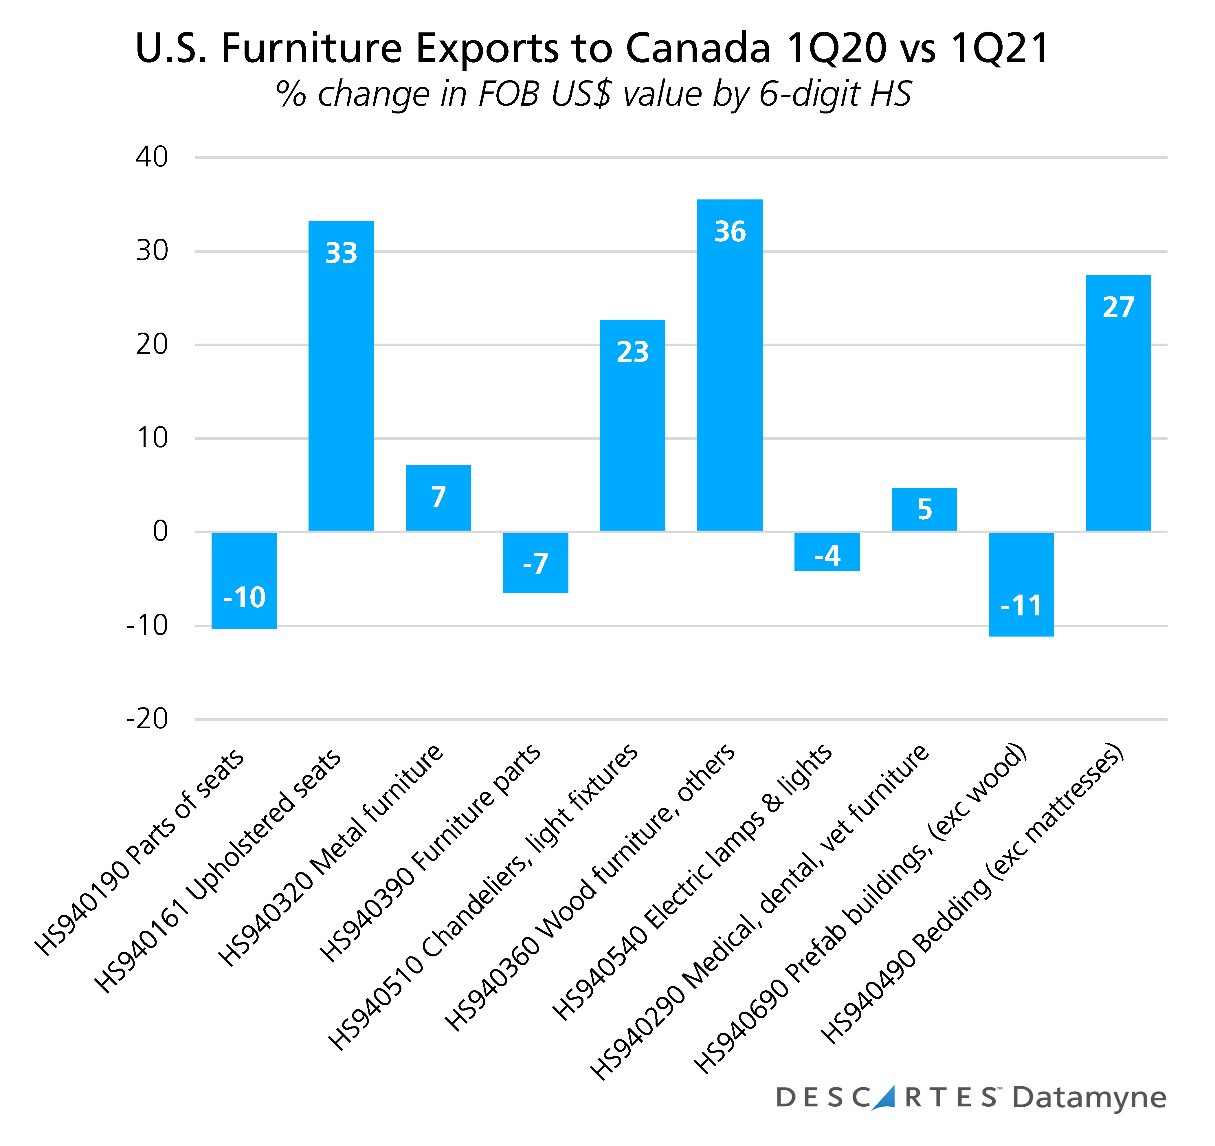
The data also points to a principal driver of the lift in furniture exports starting in March. Most of these exports were bound for Canada. During the first quarter of 2021, upholstered seating was the second-ranked product by value, accounted for nearly 10% of the U.S. furniture exports to Canada (compared with a 12% share for top-ranked parts of seats). The year-on-year 33% increase in exports of upholstered seating (shown in the chart below) may have been due to stockpiling product ahead of steep tariffs on upholstered seating from China and Vietnam effective in May.
Getting the balance right
In publicly available briefings to analysts, furniture company executives remain optimistic that U.S. consumers’ new-found appreciation for (and spending on) the comforts of home will remain as the country re-opens after the pandemic.
But they also express concerns about supply chain challenges. They need to scramble for raw materials, parts and finished goods. At the same time, given the long lead times and higher costs, they worry about having too much invested in supply pipelines should order cancellations start to climb and consumers shift their spending from big-ticket furniture to long-postponed travel and entertainment.
Smith Leonard’s Ken Smith told the Winston-Salem Journal, “It seems that no one would have thought that, for once, business in the furniture industry could be this good with consumer demand this high, yet so many problems have developed to make it hard to appreciate how good business is.”
How Descartes Can Help
Descartes Datamyne delivers business intelligence with comprehensive, accurate, up-to-date, import and export information that help companies save significant time in identifying new suppliers, markets, customers, and sources of products.
Our multinational trade data assets can be used to trace global supply chains and our bill-of-lading trade data – with cross-references to company profiles and customs information – can help businesses identify and qualify new sources.