


U.S. port data remains essential for importers, logistics providers, and supply chain leaders navigating today’s volatile trade environment. The latest Top 30 U.S. Port Report from Descartes Datamyne reveals how U.S. tariffs, front-loading, sourcing shifts, and changing carrier strategies reshaped containerized import flows in 2025. With total U.S. containerized import volumes essentially flat year-over-year at 28.09 million TEUs (twenty-foot equivalent units), the report offers valuable insight into how the nation’s leading ports responded to one of the most unpredictable trade years.
In this Article…
2025: A year of trade volatility and flat growth.
According to the Top 30 U.S. Port Report, U.S. containerized import volumes totaled 28,093,126 TEUs in 2025, effectively unchanged from 28,112,319 TEUs in 2024. But while the topline number points to stability, the year’s shipping patterns were anything but.
In 2025, U.S. tariffs played a major role in shaping import activity. U.S. port data shows a spring rush of orders ahead of rising duties, followed by a drop in May as tariffs on Chinese goods climbed to 145%, created an unusually volatile first half. Volumes rebounded again in the summer after a temporary U.S.-China tariff truce and another wave of suspected front-loading ahead of reciprocal U.S. tariffs taking effect in August.
For the second straight year, July was the peak month, reaching 2,610,363 TEUs, while August also exceeded 2.53 million TEUs before volumes began to decline through the rest of the year (see Figure 1).
Figure 1: U.S. Monthly TEUs Comparison (2024 vs. 2025)

Source: Descartes 2026 Top 30 U.S. Port Report.
Ranking the top ports by volume with U.S. port data.
Los Angeles held onto its position as the nation’s busiest port in 2025, even as import volumes dipped 0.85% year-over-year. Long Beach remained second and posted a modest 1.08% gain, while New York-New Jersey ranked third with a 3.5% decline in TEUs.
Among the top five ports, gains and losses were relatively modest. Savannah rose 1.95% and Houston gained 1.02%, while growth at Long Beach was the best improvement in the top tier.
The year’s biggest winners were outside the top five. New York, NY led all growth among the top 30 ports with a 59.4% increase in TEUs as newly expanded facilities gained traction. Baltimore surged 57.3% as it recovered from the Key Bridge collapse that constrained operations in 2024. Freeport, TX also had a standout year, growing 33.1% on the strength of infrastructure investments and fruit imports.
By contrast, several secondary ports lost volume as carriers redeployed services toward larger gateways. Port Manatee saw the steepest decline, down 31.3%, while Wilmington, NC fell 24.9% and Mobile declined 12.5% (see Figure 2).
Figure 2: 2025 Top 30 U.S. Ports by TEUs
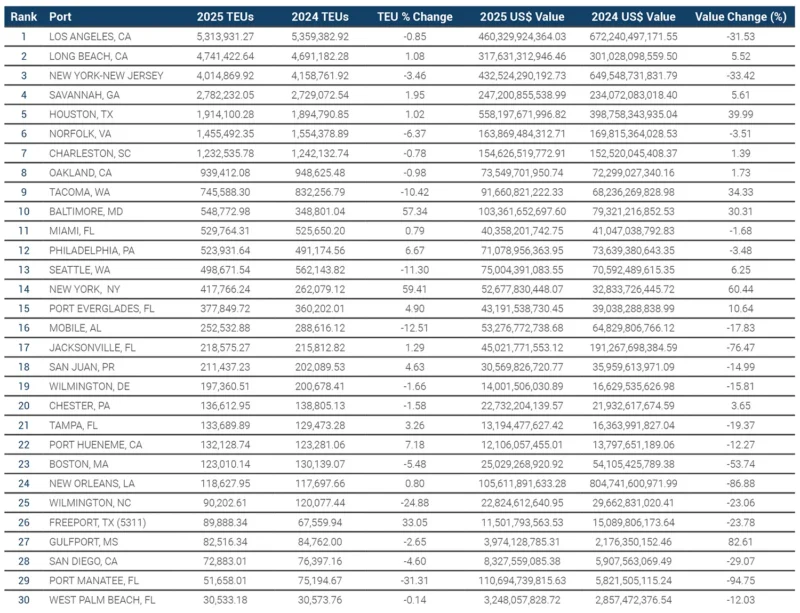
Source: Descartes 2026 Top 30 U.S. Port Report.
According to U.S. port data, these imports and origins shaped 2025.
At the product level, the mix of leading imports shifted. Articles of plastic [HS392690] rose 17.8% to become the top-volume import category, replacing upholstered seats with wooden frames [HS940161], which fell 46%. Bananas [HS080390] also moved up in the rankings, reflecting the strength of tropical fruit imports through ports such as Philadelphia, Port Everglades, Freeport, Gulfport, and Port Hueneme.
The report also highlights major changes among importers. The Home Depot vaulted from No. 15 to No. 2 overall among importers, increasing TEUs by 378.2%. It ranked as the top importer at Los Angeles, New York-New Jersey, Savannah, Houston, and Tacoma, and appeared in the top five at several other major ports.
What’s apparent in the U.S. port data is that country-of-origin trends continued to reflect U.S. sourcing diversification. China’s share of containerized imports fell from 38% in 2024 to 34% in 2025 (see Figure 3), extending the decoupling trend. Vietnam gained two percentage points of share, while India climbed to the No. 3 position among source countries. These shifts were especially visible at major West Coast ports, where China still accounted for the largest share of imports, but at lower levels than in 2024.
Figure 3: Top Countries of Origin for U.S. Container Imports (2024 vs. 2025)
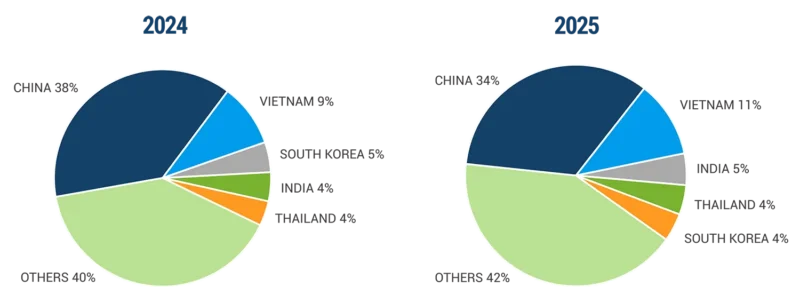
Source: Descartes 2026 Top 30 U.S. Port Report.
How U.S. tariffs and carrier shifts reshaped port performance.
U.S tariffs were the dominant story behind 2025’s U.S. port data. West Coast ports were especially exposed, with China accounting for 47.7% of TEUs at West Coast ports, compared with 25.9% at Gulf ports and 22.4% at East Coast ports.
As tariff pressure escalated, imports from China fell sharply at many of the nation’s busiest gateways. Los Angeles, Oakland, Tacoma, Savannah, Miami, and Boston all posted visible drops in China-origin volumes during the spring, followed by rebounds in July after the tariff truce. That volatility created sharp monthly swings in TEUs and encouraged more front-loading through faster Asia–West Coast routes during the summer.
At the same time, carriers adjusted networks in response to shifting demand, often cutting calls at smaller or secondary ports. This helped major ports hold their positions while contributing to volume losses at ports such as Wilmington, NC, Boston, and Port Manatee.
By year-end, there was little daylight between East and West Coast trendlines, though the East Coast finished with a fractional edge. The report suggests that while the West Coast appeared poised to regain share during the summer rebound, that momentum faded after August (see Figure 4).
Figure 4: Year-Over-Year Volume Change by Port

Source: Descartes 2026 Top 30 U.S. Port Report.
Descartes Datamyne: Your Source for U.S. Port Data
In a year defined by tariff shocks, sourcing shifts, front-loading, and uneven port performance, reliable U.S. port data is critical for making smarter supply chain decisions. Descartes Datamyne gives importers, logistics professionals, and market analysts access to one of the world’s most comprehensive trade intelligence platforms, with shipment-level visibility across more than 190 countries.
Use Descartes Datamyne to:
Monitor port activity and carrier performance
Track container flows, monthly throughput, and carrier activity across major U.S. and international ports to better anticipate disruptions and adjust routing strategies.
Discover sourcing trends by HS Code
Analyze import patterns at the product level using Harmonized System codes to uncover shifts in supplier markets, category demand, and tariff-driven trade changes.
Identify top importers and consignees
Access detailed shipment records to see which companies are importing through key ports, benchmark competitors, and uncover new business opportunities.