


U.S. port data is more vital than ever as logistics leaders navigate shifting trade routes, labor disputes, and macroeconomic challenges. Descartes Datamyne’s 2024 Top 30 U.S. Port Report offers detailed insight into containerized import trends across the nation’s leading maritime gateways. With 2024 container volumes rising nearly 13% year-over-year, this report is a must-read for importers, logistics professionals, and analysts seeking data-driven strategic direction.
In this Article…
- U.S. container imports rose 12.8% in 2024, reaching 28.1M TEUs.
- Los Angeles regained the top spot with 5.36M TEUs.
- 25 of the top 30 ports saw year-over-year volume increases.
- East Coast labor disputes impacted growth at NY-NJ and Charleston.
- Solar panel imports declined, while furniture remained the top category.
2024: A Year of Volume Recovery and Volatility
According to the report, U.S. containerized import volumes reached 28,112,319 TEUs in 2024—second only to the record year of 2021. This rebound in U.S. port data reflects sustained consumer demand and adaptive supply chains despite major headwinds including labor strikes, geopolitical instability, and climate disruptions.
July marked the peak with over 2.55 million TEUs, and despite brief slowdowns in August, volumes remained high throughout the holiday season (see Figure 1).
Figure 1: U.S. Monthly TEUs Comparison (2023 vs. 2024)
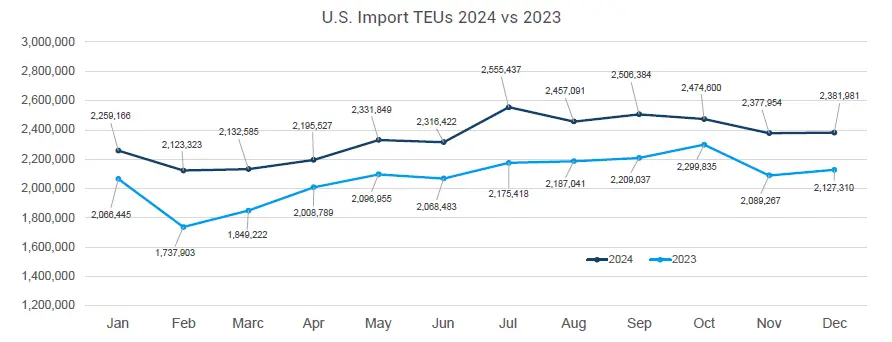
Source: Descartes 2024 Top 30 U.S. Port Report.
Ranking the Top U.S. Ports by Volume
Los Angeles reclaimed its title as the nation’s busiest container port with 5.36 million TEUs, a 21.4% increase over 2023. Long Beach followed closely, while New York-New Jersey fell to third due to October’s East Coast labor strike.
Notably, Freeport, TX posted the biggest TEU growth (+47.6%), while Portland, OR saw the largest decline (-15.7%)(see Figure 2).
Figure 2: 2024 Top 30 U.S. Ports by TEUs

Source: Descartes 2024 Top 30 U.S. Port Report.
Which Imports and Origins Drove Growth?
Furniture (Harmonized System [HS] Code 94) remained the dominant import category, led by upholstered wood frame seats (+44.4%) and wooden furniture. In contrast, solar panel imports dropped by 19%, hinting at reshoring trends.
China maintained its lead with 38% of all container imports, followed by Vietnam (9.4%) and South Korea. Vietnam’s 28.9% growth helped it secure the second spot (see Figure 3).
Figure 3: Top Countries of Origin for U.S. Container Imports in 2024.

Source: Descartes 2024 Top 30 U.S. Port Report.
Where Delays and Disruptions Hit Hardest
Port operations were disrupted by extreme weather and labor negotiations. The Baltimore bridge collapse paused operations for seven weeks, leading to a 33.8% drop in its TEUs (see Figure 4). Meanwhile, East and Gulf Coast ports faced uncertainty due to International Longshoremen’s Association (ILA) labor negotiations.
Figure 4: Year-Over-Year Volume Change by Port

Source: Descartes 2024 Top 30 U.S. Port Report.
New York-New Jersey had an average delay of 8.93 days, one of the highest nationally, while Gulfport and San Diego performed best, averaging 1.67 days (see Figure 5).
Figure 5: Average Monthly Transit Delays at Top Ports

Source: Descartes 2024 Top 30 U.S. Port Report.
Descartes Datamyne: Your Source for U.S. Port Data
In a year marked by rerouted shipments, surging container volumes, and ongoing geopolitical uncertainty, reliable U.S. port data is not just helpful—it’s mission-critical. Descartes Datamyne delivers the world’s most comprehensive trade intelligence platform, offering granular, near real-time shipping data sourced and verified from over 230 global markets.
Use Descartes Datamyne to:
Monitor port activity and carrier performance
Gain real-time visibility into container flows at key U.S. and international ports. Track throughput trends, vessel calls, and carrier reliability to optimize logistics planning and reduce bottlenecks.
Discover sourcing trends by HS Code
Analyze trade patterns at the product level using Harmonized System (HS) Codes. Identify emerging import/export trends, detect shifts in supplier markets, and inform strategic sourcing decisions.
Identify top importers and consignees
Uncover detailed shipment records to see who is moving what, where, and how often. Build lead lists, benchmark against competitors, or find potential partners with up-to-date data on top trade participants.
Download the 2024 Top 30 U.S. Port Report Now!