


As U.S.-China trade tariffs kick in – and more are threatened – the costs are just starting to weigh on business and consumers on both sides of the Pacific.
The back-and-forth volley of tariffs between the U.S. and China that began in January hasn’t slowed for the dog days of summer. (For a fast summary of tit-for-tat tariffs through June, see this Descartes infographic.)
An initial round of U.S. Section 301 tariffs on $34 billion worth of Chinese trade goods became effective July 6. First proposed by the Trump administration in April, subject to a period of public review and comment, these Section 301 [of the Trade Act of 1974] tariffs are among the penalties the U.S. can impose on countries engaged in unfair trade practices.
July 11: The U.S. sets in motion the process of implementing another round of Section 301 tariffs on a new list of Chinese imports valued at $200 billion. In addition to finished goods such as furniture and luggage, the list pays special attention to materials and parts that flow through cross-border assembly lines, as the Financial Times reports.
August 2: The U.S. considers upping the tariffs on $200 billion worth of Chinese trade goods now wending through the review process from 10% to 25%.
August 3: China responds by threatening new tariffs on $60 billion in U.S. imports, including a 25% tariff on liquefied natural gas.
August 7: The U.S. boosts tariffs on $16 billion of Chinese goods 25%, effective August 23.
August 8: China counters with its own mark-up of an additional 25% duty on $16 billion of U.S. goods, including petroleum products, automobiles, and steel, also set to become effective August 23.
U.S.-China trade tariffs: costs to U.S. exports
Given the imbalance in merchandise trade between the U.S. and China, the U.S. has an advantage in this exchange of tariffs. The Financial Times calculates that taken together, the current and pending U.S. tariffs add up to $250 billion in trade value – or about half of China’s exports to its top market ($505 billion in 2017). In contrast, China’s tariffs, including those threatened, amount to $110 billion – or about 85% of the $130 billion in imports it received from the U.S. in 2017.
While China has fewer targets for retaliatory tariffs, it has taken care to aim at the most valuable. U.S. agriculture in particular has already sustained significant losses. Our blog has looked at the impact on U.S. exports of both soybeans and cherries in recent weeks.
The U.S. Department of Agriculture has authorized roughly $12 billion in farmer assistance which, the USDA says, is in line with the estimated $11 billion impact of China’s tariffs on U.S. agricultural exports.
It is too soon for the trade data to show the impact of the tariffs imposed in the last months. Indeed, June’s Census data shows U.S. exports to China increased 8.07% in first-half 2018 compared with the same period in 2017 – and 14.47% year-over-year in June. These gains reflect an acceleration of trade ahead of tariffs set for July.
For an indication of what may await U.S. exporters in the third and fourth quarters, consider the woes of U.S. exporters of waste and scrap following the virtual market closure of the China – the world’s top buyer of these recovered materials.
China notified the World Trade Organization last July of its intent to stop importing selected solid waste products by the end of the 2017.
According to the Institute of Scrap Recycling Industries, the U.S. sent $1.9 billion in recovered paper (13.2 million tons) and $495 million in scrap plastics (or 1.42 million tons) to China in 2017. A total of $5.6 billion in scrap commodities were exported last year from the U.S. to China, destination for almost a third of all U.S. exports in this product category.
Then China shut its doors to waste, as the trade data illustrates:
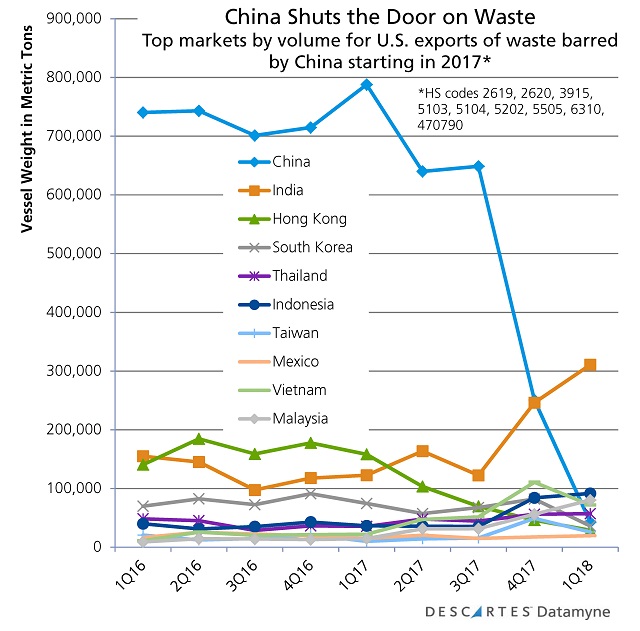
China’s stated aim in banning waste and scrap is environmental, not retaliatory (although China’s August 23rd tariffs will apply to at least 10 waste materials still accepted as imports). But China’s abrupt shut-down has had a devastating effect on U.S. exports. The latest available Census data shows June exports of waste paper down 92.89% by value, 94% by volume, year over year.
As the chart indicates, there is some growth in exports to alternative markets, most notably Mexico (whose trade relationship with NAFTA partner U.S. has also been shaken by an exchange of protective tariffs and is now being renegotiated).
The data also shows some promising upticks in exports to Southeast Asian countries and India, but would-be exporters to these markets are facing some logistics problems. As the Journal of Commerce reports, ocean carriers trans-Pacific services, largely structured around pre-tariff shipping patterns, are finding it difficult to adapt quickly to shifting demand.
Meanwhile, the U.S. waste-services sector is being upended notes the Wall Street Journal, while cities scramble to rewrite the rules on recycling, as the McClatchy DC Bureau reports.
The current bans are just a beginning. China has since announced new bans on scrap plastics, small electronics, and insulated wire starting this year and on scrap stainless steel and other metals starting next. The country has set a goal of eliminating scrap and waste imports by 2020.
U.S.-China trade tariffs: costs to U.S. imports
The latest available Census data serves as a benchmark on trade before the tariffs kick in rather than a measure of the impacts to come. U.S. imports from China gained 8.62% through first-half 2018 compared with the same period in 2017. June’s year-over-year increase was 5.46%, a bit better than May’s 4.77% growth, much better than April’s 2.02% … but well below the 11.85% year-over-year increased clocked in March.
As the first round of Section 301 tariffs takes effect, prices paid for products by the end purchaser will inevitably rise as the cost of duties is passed along. So consumers can expect to pay more for a color TV (HS85287264) now subject to a 25% tax. But it will be a while before the impact of the July 6 tariffs ripples through consumers’ wallets.
That is because, as this blog has reported, the U.S. strategy in selecting its tariff targets has been to identify the imports that get a boost from Chinese industrial policies. At the same time, the Trump administration wanted both to minimize disruption of the U.S. economy and to avoid depriving consumers of well-loved products.
Mainstays of U.S.-China trade as such as apparel, footwear, smartphones, tablets, video games, toys, and furniture are NOT among the products subject to the July 6 tariffs. Reuters calculates that less than 1% of the 1,102 products covered by the July 6 tariffs are finished consumer goods.
Minimizing disruption to the economy will be a challenge however. The list of July 6 tariffs runs heavily to product components. The U.S. manufacturing sector, sustained by cross-border supply lines, will bear the brunt of these tariffs.
The impact of the steel and aluminum tariffs that became generally effective at the end of March is instructive here. These Section 232 tariffs, aimed at protecting domestic steel and aluminum from surging imports due to global overcapacity, are exacting a toll on U.S. downstream manufacturers that rely on foreign inputs and assembly to bring finished products to U.S. markets. [See Market Changers. U.S. Section 232 Aluminum and Steel Tariffs.]
The Wall Street Journal reports that, as of August 7, more than 21,000 requests for exemption from the steel tariffs have been filed by U.S. manufacturers claiming they are unable to meet their production needs with U.S.-made substitutes. So far, the Commerce Department has issued over 1,300 steel exemptions, while rejecting roughly half as many. The backlog is slowing the turnaround on processing requests, which is supposed to take 90 days.
U.S.-China trade tariffs: global impact
On August 9, the European Central Bank warned that U.S. tariffs are edging toward their highest levels in 50 years. The down-side risks of the tit-for-tat exchange of tariffs between the U.S. and China (as well as the U.S. and its other trade partners) extend globally: “Complex supply chains could further amplify the adverse effects of protectionism on the world economy.”
As UNCTAD points out – and the next chart illustrates – world trade in goods largely consists of manufacturing products (roughly $12.5 trillion in 2016).
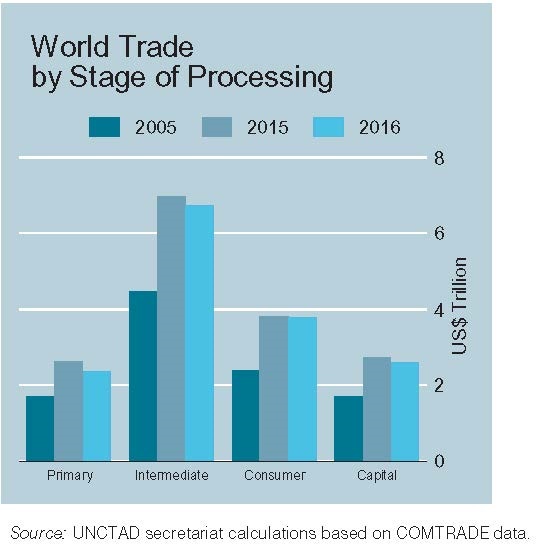
Beyond pricier TVs for U.S. consumers, the ability to make, buy and sell goods on a global basis could ultimately be at stake as threatened tariffs take effect and begin to take their toll on supply chains.
Related:
Blog coverage:
- Making Sense of Tariffs: What You Need to Know
- U.S. Tariffs on Chinese Goods: Overview and Timeline
- Market Changers. U.S. Section 232 Aluminum and Steel Tariffs
Trade content solutions:
- Descartes CustomsInfo™ Manager helps clients minimize trade barriers with a vast database of regulations, rulings, duties, and more. Learn more.
- Descartes Datamyne™ can provide a wealth of data on NAFTA trade including values and volumes by specific HS code. In addition, our maritime bill of lading data captures the transactional and logistical details of U.S. import trade – including consignees, shippers, and notify parties, cargo values and volumes. Ask for a demo.