


Month-by-month, this year’s peak shipping season for U.S. maritime imports broke volume records, surpassing 2 million TEUs in August and October.
This year’s peak shipping season, the August-to-October run-up to year-end holidays during which merchants stock up for their peak selling season, set records for U.S. maritime import volumes.
Our bill-of-lading (BOL) data tallied 5,962,260 TEUs (20-foot-equivalent units) received at U.S. ports during the three-month season, a 7.81% increase over the same period in 2016.
The 2017 season’s inbound volumes also followed a pattern laid down in 2016, rising to sharp peaks in August and October. Both months saw record import volumes of two-million-plus TEUs, as the next chart, covering the peak shipping seasons of the last five years – along with 2007, the year before the Great Recession’s fall, illustrates:
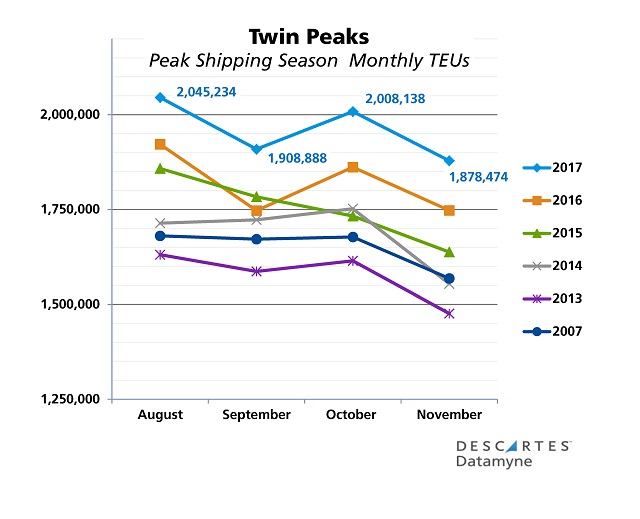
Compared with 2016’s twin peaks, this August’s import volumes were 6.43% higher, and October’s were up 7.88% year-over-year. This year’s September trough was shallower – falling just 6.67% from the preceding month compared with the 9.1% decline in September 2016. As a result, September 2017 led the season’s y-o-y gains with a 9.27% increase in TEUs.
Peak Shipping Season: What’s in Store?
The peak day of this year’s peak shipping season was August 16. We unpacked the BOL data for that day to see what might be in store for holiday gift-giving.
As the chart below shows, furniture (HS94) and machinery (HS84), the perennial volume leaders in U.S. containerized imports, took the top shares of TEUs arriving August 16.
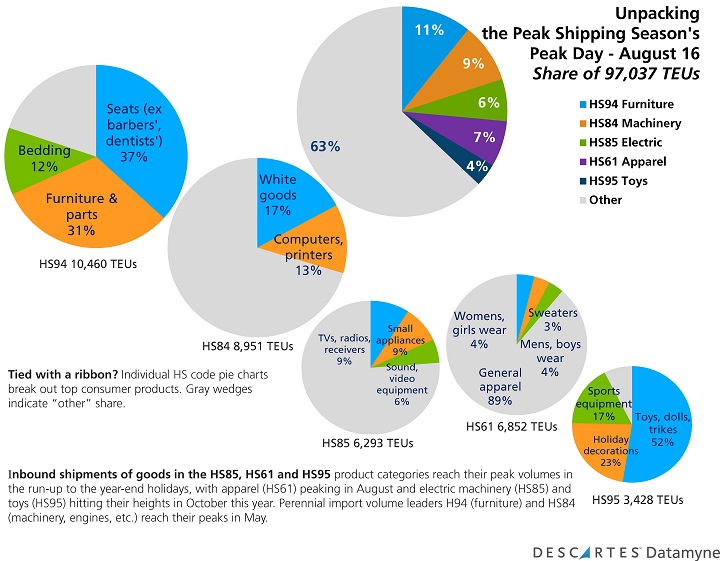
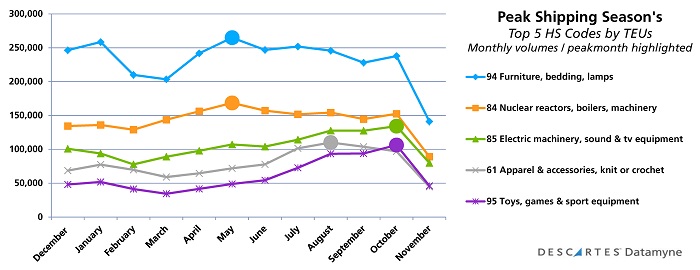
We suppose some consumers might splurge on a new couch or washing machine for the holidays. But it’s more likely that the demand for electronics, small appliances, sweaters and (especially) toys lifted the season’s shipping volumes. The BOL data bears out this intuition. As the next chart shows, August is off-peak for HS94 and HS84. The volume of imports in both categories topped off in May.
Shipments of apparel (HS61), on the other hand, peaked in August – and ranked third by TEU volume among imports arriving August 16. Giving a lift to apparel were shipments of such cold-weather wear as overcoats, gloves, hats and sweaters (including those Ugly Christmas Sweaters).
August saw a rise in shipments for HS85, the code that covers sound equipment, TVs and other media; and HS95, code for toys, sports gear and holiday decorations. But the summit for both product categories was October.
In particular, HS95, which ranks just below the top 10 by U.S. import volume for much of the year, surged to No. 4 in October, driven by trade between U.S. retailers, and mostly (almost 98%) Asia-based shippers.
Peak Shipping Season Traffic
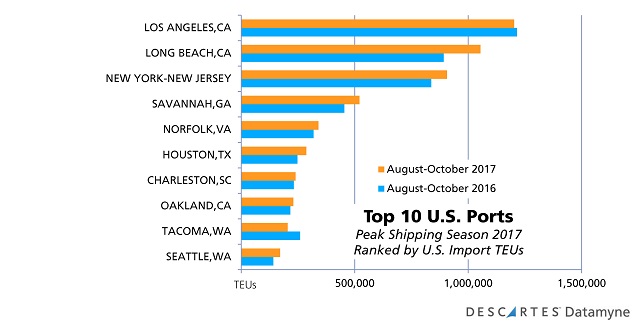
Los Angeles led ports by TEU volume during the 2017 peak season, even though it handled 1.05% fewer TEUs compared with the same period in 2016. Tacoma also experienced a decline in TEUs – down 21.04% for the season. Contributing to Tacoma’s slide: a 10.83% drop in volume of HS95 products in October.
The other ports in the top 10 (next chart) posted y-o-y gains for the August-October period, led by Seattle with 21.4% growth; Houston, up 15.95% (Hurricane Harvey notwithstanding); and Savannah with 14.61%.
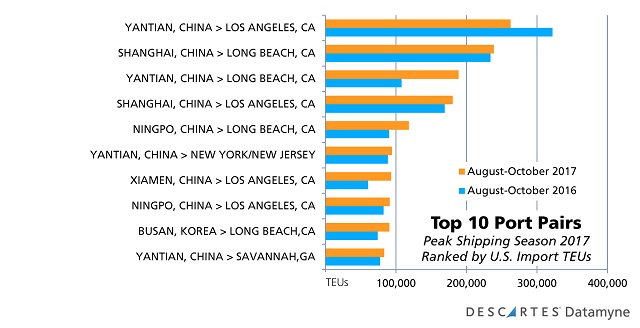
Finally, this last chart ranks the top port pairs by TEU volume during the peak shipping season for U.S. maritime imports:
Related:
Blog (in the spirit of holidays past):
Industry coverage:
Trade content solutions:
- Descartes Datamyne maritime bill of lading data captures the transactional and logistical details of U.S. import trade in this or any season. Ask for a demo.
- Follow monthly rankings by U.S. import volumes of carriers, NVOCCs and U.S. ports with our free reports, available for downloading from our free report library.