


Reviewing the logistics or economic metrics may lead you to think that your days are on repeat. U.S. Import data continues to show that the end to the global shipping crisis is not yet on the horizon. For this month’s review, we’re adopting a more holistic approach by considering another localized component – drivers—and have added additional metrics to help provide insight in the issues that companies will face into 2022 and possibly beyond. Here’s where we stand as of mid-November:
Another Strong Month for U.S. Import Container Volume.
October import volumes were up compared to September and October 2020 (see Figure #1). October is a longer month and not impacted by national holidays, unlike September, and benefits from being at the tail end of peak shipping season, so this month-to-month increase is expected. Year-over-year, October 2021 was 3 percent higher than 2020 and 23 percent higher than 2019.
By October 2020, the economy had fully adjusted and the peak holiday season was fully underway, so it is no surprise that 2021 did not show much growth. However, when comparing the last twelve months versus 2019, U.S. container imports are showing a 21 percent increase in total volume. As we stated in October, the 2021 TEU volume will likely continue to hover between 2.4M and 2.6M TEUs monthly through the end of the year. Assuming there are no major changes or disruptions, the peak season in the second half of 2022 will drown out any decline we might see in the next few months, leading 2022 to likely have similar volumes and port congestion as 2021.
Figure #1: U.S. Container Import Volume Year-over-Year Comparison
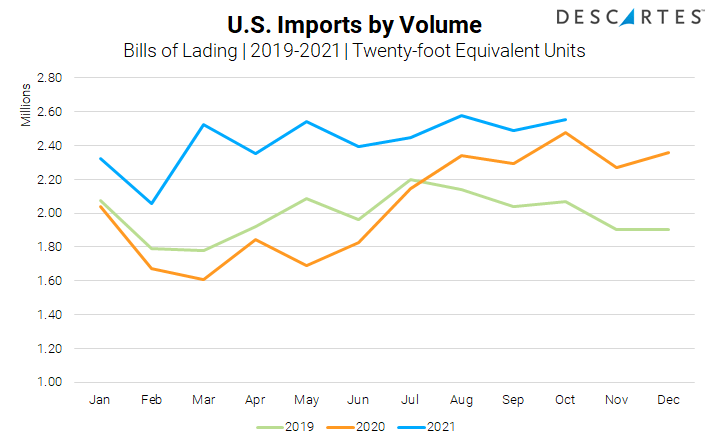
Source: Descartes Datamyne
L.A. Gets the Attention – But It is Not Alone
The extended run of high container import volumes and the impact on wait times has been highly documented by industry and national publications. Wait time at the Port of Los Angeles was down very slightly in October at 14.2 days versus 14.5 days in September and 15.3 in August 1. However, wait times in October at ports on the East Coast are also quite extensive with the Ports of New York/New Jersey currently at 8.4 days and the Port of Savannah at 9.7. What this means is that the crisis is a national one and, for importers and carriers, that there isn’t a simple solution of changing port of entry.
Major Carriers and Logistics Service Providers (LSPs) Announced Record Financial Performance.
Equally important, these businesses have also stated that they forecast strong demand for their services well into 2022. There has been a lot of press focus on high profile shippers chartering their own vessels, but the majority of these are relatively small and will provide very little capacity increase to help alleviate the current situation.
Inventory levels continue to lag and next year’s International Longshore and Warehouse Union (ILWU) contract will put more pressure on shipping volumes early in 2022.
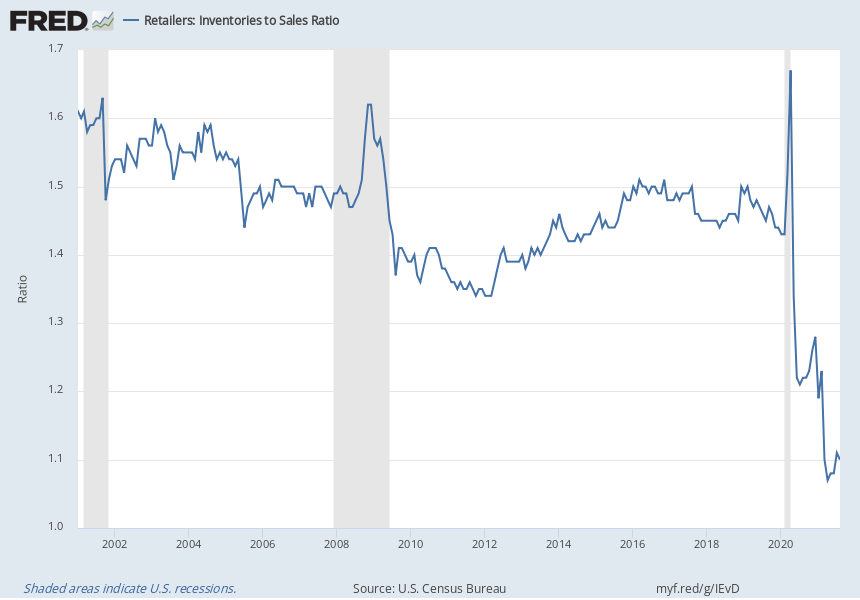
The retail inventory-to-sales ratio has improved slightly but is still lagging behind pre-pandemic levels (see Figure #2). Retailers have stated they want to carry more inventory to improve sales and customer experience.
On July 1st, the ILWU contract will expire, and, with a history of contentious negotiations, importers will want more inventory to mitigate the impact of any work stoppages.
The combination of inventory “catch up” and contract risk mitigation will most likely eliminate the traditional lower container import volumes over the winter and early spring and not allow the global capacity shortage and asset imbalance to correct itself before peak season arrives in the fall.
Figure #2: FRED Retail Inventory to Sales Ratio
The Word is Fully Out On the “Stuff Economy”
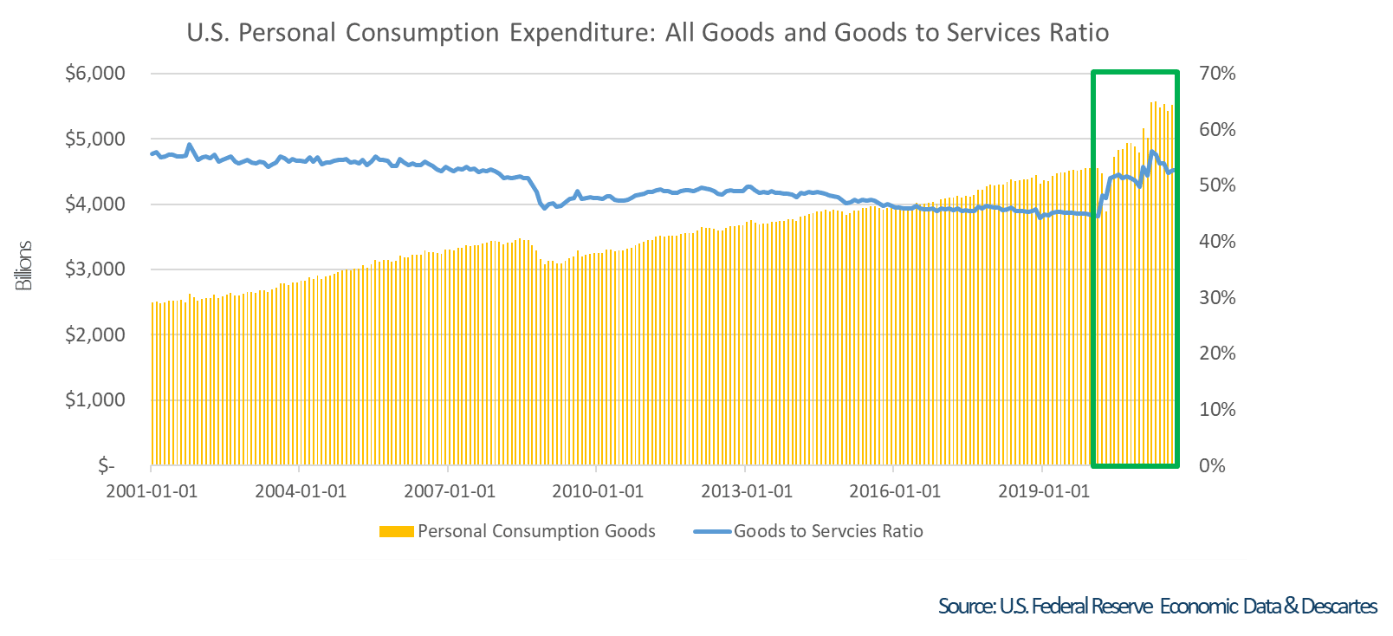
With nearly every publication now covering the “stuff economy”, there isn’t a need for detailed explanations about how consumer spending is impacting the crisis. However, Stuff Economy metrics need to be tracked (see Figure #3) because goods purchased are a significant factor driving container volumes. Until services (such as international travel) start to pick up again, there will not be significant places for consumers to spend and the stuff economy will remain. As of the end of October, the ratio of personal consumption of goods to services has increased 8% since the start of the pandemic.
Figure #3: Personal Consumption Metrics
The Driver Shortage May Eclipse Other Issues
The shortage of short- and long-haul truck drivers will dramatically affect both global and local trade. Whether it’s getting goods out of ports to last-mile deliveries, there are not enough drivers currently and the situation appears to be getting worse. The data tells the story:
- Current U.S. driver shortage stands at 80,000 and is projected to be 160,000 in 20302
- The overall unemployment rate declined to 4.6% in October
- October’s unemployment numbers were good overall and 54,000 jobs in transportation and warehousing were created, but only 8,000 were drivers3
How Top Performing Companies are Addressing the Global Shipping Crisis
Descartes recently conducted a benchmark survey and uncovered the supply chain resiliency strategies of top-performing companies.
Get your copy of the survey results and find out key steps you can take to reduce risk and create a more resilient supply chain.
Don’t Forget About the Pandemic
Given how much freight is continuing to move, supply chains and supply chain workers have been one of the unsung heroes of the pandemic. However, even the heroes cannot overcome the massive COVID-19 pandemic. We have to take into account that a large part of the world’s population is not fully vaccinated and outbreaks will continue to impact supply chains.
Vietnam is a prime example of what can happen. Vietnam did very well in 2020, gaining significant market share in key U.S. products and industries, but the country was hit hard with outbreaks and subsequent lockdowns in the summer of 2021. As a result, exports collapsed in some industries such as furniture where Vietnam had been considered a rising global star (see Figure #4).
Figure #4: Vietnam Maritime Furniture Exports to the United States
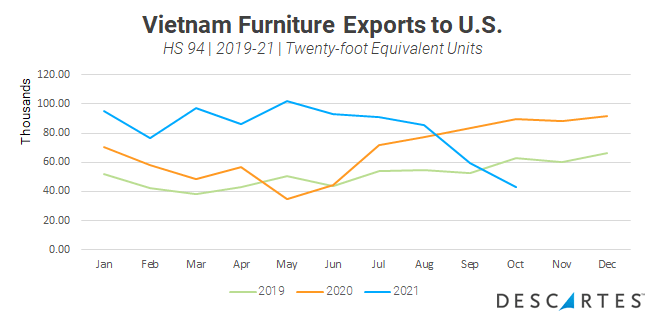
Source: Descartes Datamyne
What About Supply Chain Improvements?
There has been and will continue to be significant investment in a number of areas in the supply chain to help the current bottleneck. For example, there are already 619 container ships under contract for construction4 and 477 million square feet5 of warehouse space underway. These will come online in the next 1-5 years. The U.S. Infrastructure Investment and Jobs Act will provide money to help alleviate port congestion, but both these improvements could be 5+ years away from making any substantial difference.
Don’t treat this like a short-term problem or everyday you might find yourself waking up alongside Bill Murray.
There is no data showing the global logistics crisis to be a short-term problem. Risk mitigation tactics continue to be the way forward, but supply chain strategies need to be adjusted as well. Descartes will highlight key Descartes Datamyne™, U.S. government and industry data that provides insight into the global shipping crisis. Our recommendations remain the same with an additional one on resources:
Short-term:
- Shipping capacity constrained? Prioritize SKUs to ship higher velocity and margin goods to maximize profits.
- Focus on retaining supply chain resources, especially drivers. The old adage “a bird in the hand is worth 2 in the bush” definitely applies here. Planning and routing trips with the goal of reducing stress and improving quality of life to retain drivers is now as or more important than wage increases.
Near-term:
- Shift imports to less congested transportation lanes to improve supply chain performance. Total transit time is important, but so is supply chain reliability and predictability. Evaluate alternative transportation lanes into the U.S. including entry through northern and southern borders as well as inland ports.
Long-term:
- Evaluate supplier and factory location density to prevent reliance on over-encumbered trade lanes. Density creates economy of scale, but also risk, and the pandemic and subsequent logistics capacity crisis highlight the potential downside.
Notes
- Descartes Datamyne
- Fact Sheet: Biden Administration
- Port of Los Angeles