


At the height of COVID-19, soaring consumer purchases in the United States congested supply chains and threatened to overwhelm U.S. maritime ports. But last September, container trade volumes suddenly went into a decline from their record highs, according to global trade and shipping data included the Top 30 U.S. Port Report, published recently by Descartes Datamyne. The downtrend occurred as surging inflation pushed the economic outlook from rosy to murky, which helped to significantly curtail the buying spree.
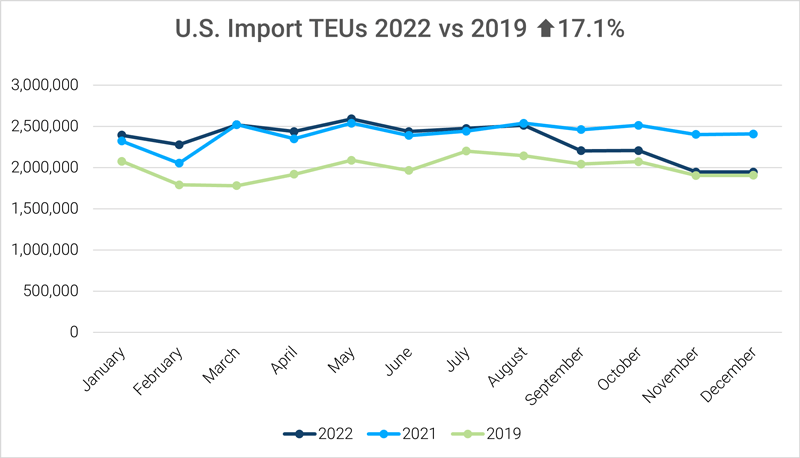
In the end, U.S. TEU imports for 2022 retreated more than 3%, compared with the year before, although they were still 17% above pre-pandemic 2019. But despite the year-on-year decline, indicators continue to point to challenging global supply chain performance in 2023. These include the underlying uncertainty over the economy, war in Europe, tensions in Asia-Pacific, unresolved West Coast ports labor situation, changing U.S. industrial and climate migration policies, among others.
The issues mentioned above, along with heavy import traffic, were also major factors that caused business leaders to rethink their supply chain and resiliency strategy last year. One of the ways they tried to keep their international business on track was to shift trade away from the American West Coast in favor of East and Gulf Coast ports, the shipping data showed.
Top 30 U.S. Port Report for 2022
Descartes Systems Group has been tracking global trade and shipping data in order to report on the scope and pace of change in import-export trade month-by-month through pandemic-era disruptions, the ensuing supply chain crunch as the world got back to business, and now the rapidly evolving global marketplace.
Our annual report shares data documenting the impacts on top 30 U.S. ports of entry for containerized shipments and offers an introduction to the commercial intelligence we can provide.
Designed as a reference on U.S. import trade trends for port authorities, carriers, logistics providers, importers and shippers, the Descartes Datamyne Annual Port Report, ranks the top U.S. ports of entry by volume in TEUs (20-foot-equivalent units, standard measure of containerized trade), compares the volume and values of imports entering the U.S. with the previous year, and provides a thumbnail of each port’s import activity, including import volumes, year-over-year comparison of monthly TEUs, top carriers, top consignees, and top countries of origin.
Shipping Data Comparing 2022 vs 2021 and Pre-Pandemic 2019
U.S. container imports started 2022 at the record high levels set the previous year, with the downtrend starting in September (See Figure 1). However, compared with 2019, the year before the COVID-19 outbreak, 2022 was still significantly higher (See Figure 2). To access more details, get our Annual Report.
Figure 1: U.S. Container Import Shipping Data for 2022 vs 2021
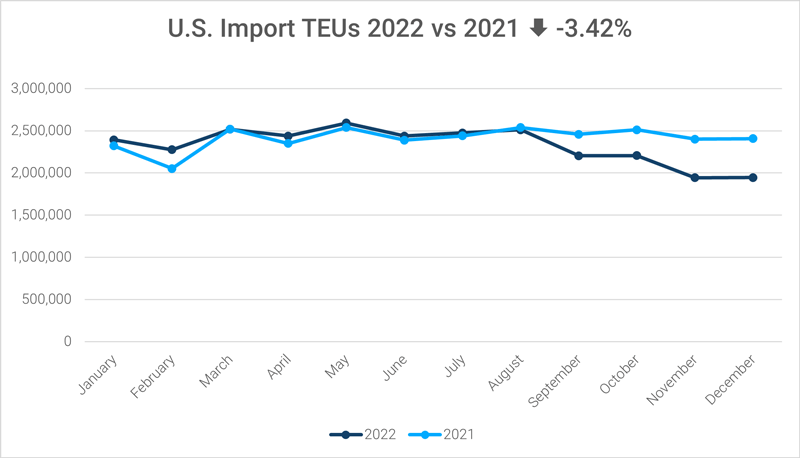
Figure 2: U.S. Container Import Shipping Data for 2022 vs 2021 and 2019
Port Transit Delay
A new feature in the U.S. Top 30 Port Report is port transit delay tracking, also calculated using Datamyne global trade and shipping data. According to the report, major ports saw delays dipping below 10 days in January 2023, compared with 15 or more days over much of last year. The situation was helped by easing traffic as well as improved container processing, especially at major ports.
Descartes’ definition of port transit delay is the difference as measured in days between the Estimated Arrival Date, which is initially declared on the bill of lading, and the date when Descartes receives the CBP-processed bill of lading
How Datamyne Global Shipping Data can Help Manage Supply Chain Risks
Descartes Datamyne delivers global trade and shipping data with comprehensive, accurate, up-to-date, import information that helps companies save significant time in spotting supply and demand shifts, optimizing trade lanes, expanding into new markets and identifying new buyers and suppliers.
Datamyne features the world’s largest searchable trade database covering 230 markets across five continents. Gathered directly from official filings with customs agencies and trade ministries, including bills of lading, our data is detailed (down to company names and contact details), timely and authoritative.
Apart from providing trade intelligence via shipping data, Descartes software solutions also include a landed cost tool to calculate the economic viability of importing from a range of markets. Our applications can also screen against multiple denied parties lists simultaneously to help ensure organizations are not doing business with entities named on official government watch lists.
Note: This report uses the initial compiled release of U.S. Customs and Border Protection (CBP) data and is subject to revision at a later date by CBP. The revised data can be seen in Descartes Datamyne.