


In November 2023, U.S. container imports fell 9% from October, particularly affecting East and Gulf Coast ports. This decline aligns with past year-end trends and includes a slightly faster drop in imports from China. The Panama drought is now impacting U.S. container imports, potentially worsening with planned reductions in daily transit slots. Descartes’ December update suggests a seasonal decline, signaling a potential stall in global supply chain improvements.
U.S. imports decline
In November 2023, U.S. container imports dropped 9.0% from October to 2,099,408 TEUs (refer to Figure 1). Compared to November 2022, there was a 7.4% increase, and it surpassed pre-pandemic November 2019 by 10.4%. The growth in import volume for the first eleven months of 2023 is within 4.0% of the same period in 2019.
Figure 1: U.S. Import Volume Year-over-Year
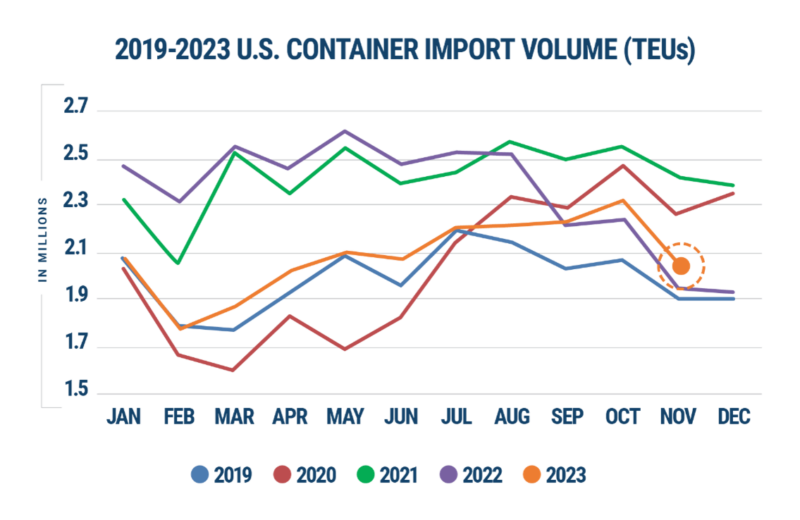
Source: Descartes Datamyne™
In the past six years, import volumes typically decreased from October to November due to the holiday season. November 2023 continued this trend, showing a 9% decline from October but aligning with the customary post-peak season reductions in other years (refer to Figure 2).
Figure 2: October to November U.S. Container Import Volume Comparison
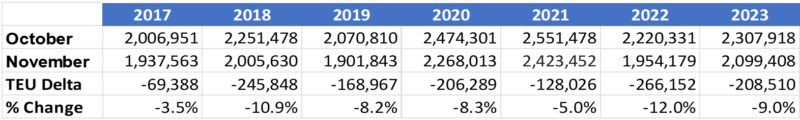
Source: Descartes Datamyne™
In November 2023, U.S. container imports at the top 10 ports decreased by 182,278 TEUs compared to October (see Figure 3). Nine ports saw declines, while the Port of Los Angeles recorded a 12,212 TEUs increase. New York/New Jersey (-62,062 TEUs) and Houston (-46,857 TEUs) experienced the most substantial decreases.
Figure 3: October to November Comparison of Import Volumes at Top 10 U.S. Ports
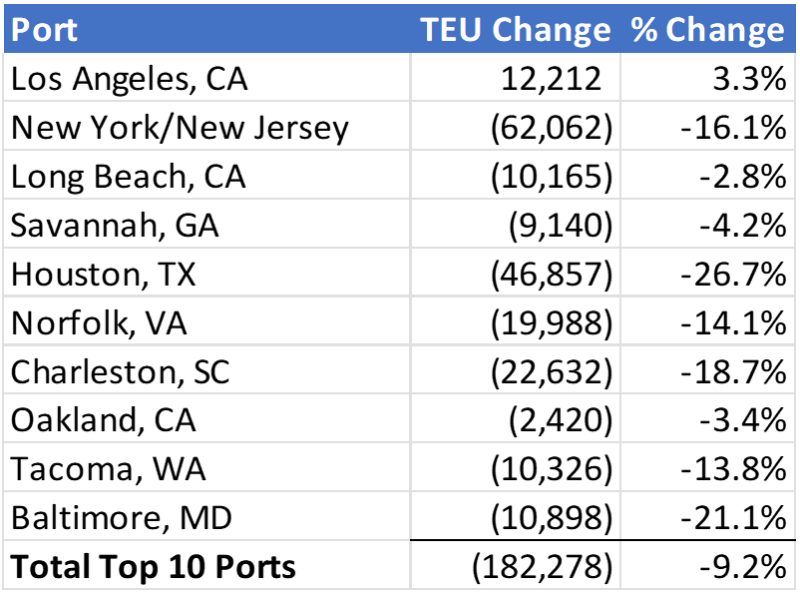
Source: Descartes Datamyne™
In November 2023, Chinese imports fell by 11.7% to 783,467 TEUs from October, remaining 21.9% below the peak in August 2022 (refer to Figure 4). China’s share of total U.S. container imports in October was 37.3%, a 1.1% decrease from October and 4.2% lower than the high observed in February 2022.
Figure 4: November 2022–November 2023 Comparison of U.S. Total and Chinese TEU Container Volume
Source: Descartes Datamyne™
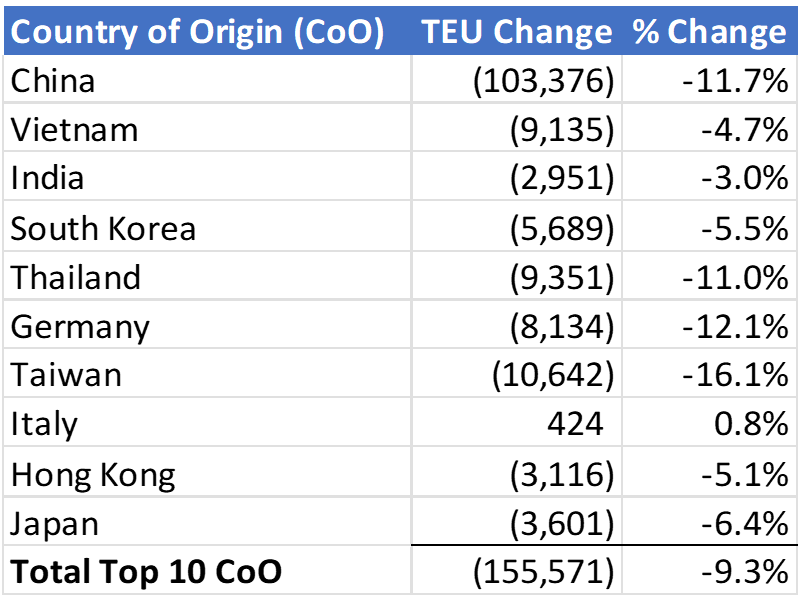
Among the top 10 countries of origin (CoO), U.S. container imports in November 2023 dropped by 9.3% (-155,571 TEUs) compared to the prior month. China saw the most substantial decrease (-103,376 TEUs), while Italy registered the only, albeit minimal, volume increase of 424 TEUs (refer to Figure 5).
Figure 5: October to November Comparison of U.S. Import Volumes from Top 10 Countries of Origin
Source: Descartes Datamyne™
Leading West Coast ports reclaim market share from East and Gulf Coast ports
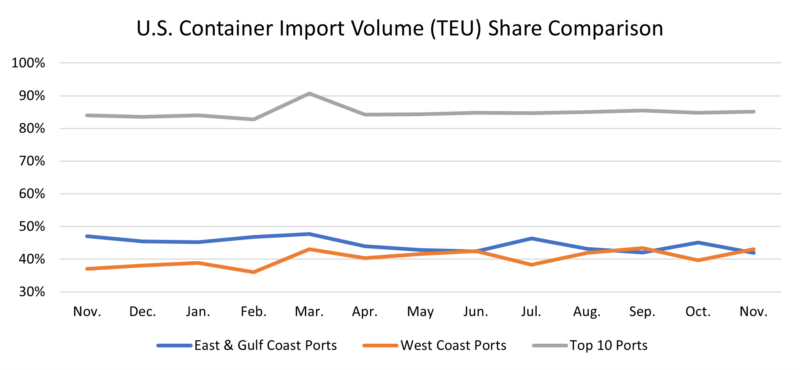
In November 2023, top West Coast ports gained import volume share due to a decline in top East and Gulf Coast ports. The top five West Coast ports rose to 43.1% (up 3.5%), while top East and Gulf Coast ports fell to 42.0% (down 3.1%). The top 10 ports collectively held 85.1%, a slight increase of 0.3% from October 2023 (see Figure 6).
Figure 6: Volume Analysis for Top Ports, West Coast Ports and East and Gulf Coast Ports
Source: Descartes Datamyne™
Port transit delays in November continue to be consistent for the majority of the top ports
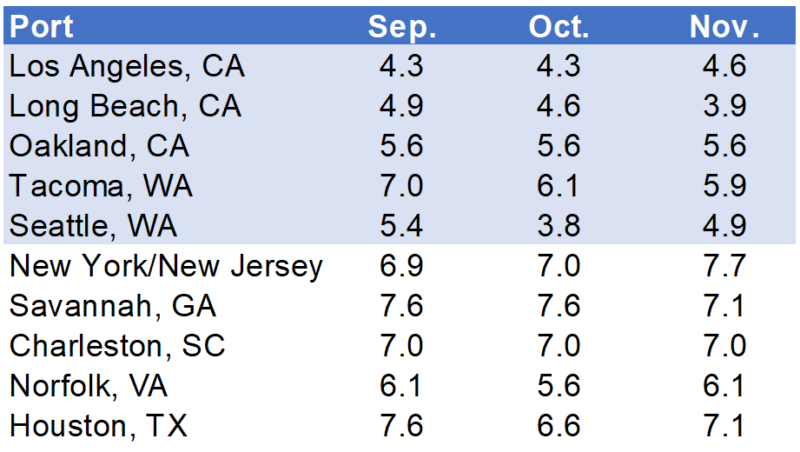
In November 2023, transit delays at ports varied (see Figure 7). Top West Coast ports had two with slight decreases, two with slight increases, and one unchanged. The top East and Gulf ports saw three with slight increases, one with a slight decrease, and one unchanged.
Figure 7: Monthly Average Transit Delays (in days) for the Top 10 Ports
Source: Descartes Datamyne™
Note: Descartes’ definition of port transit delay is the difference as measured in days between the Estimated Arrival Date, which is initially declared on the bill of lading, and the date when Descartes receives the CBP-processed bill of lading.
Panama drought affecting import volumes
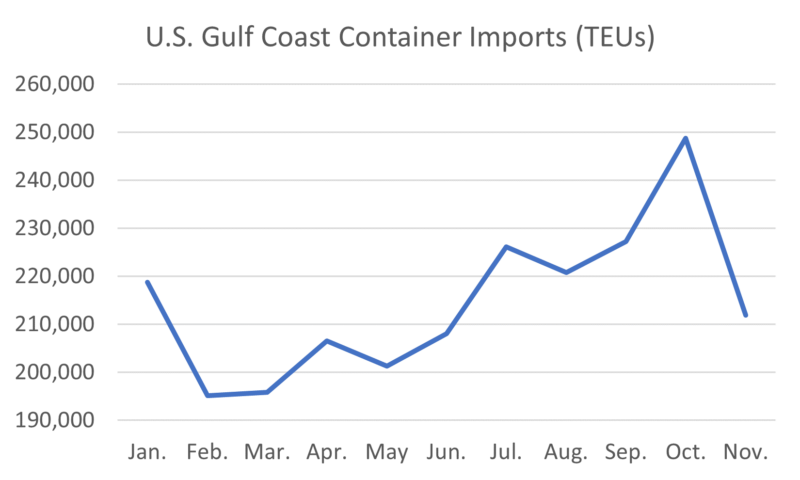
Panama’s escalating drought leads the Panama Canal Authority to reduce daily ship transits in anticipation of the dry season. In November, the drought impacted Gulf Coast container imports, with Houston down 26.7%. Top East Coast ports also saw declines (Baltimore -21.1%, Charleston -18.7%, New York/New Jersey -16.1%, Norfolk -14.1%). Despite this, port transit times only slightly increased, not uniformly across all ports. Transit changes for top Gulf Coast ports were mixed in October (Houston +0.5 days, Mobile -0.2 days, Tampa -1.1 days, New Orleans -0.3 days).
Figure 8: U.S. Gulf Coast Container Imports for 2023
Source: Descartes Datamyne™
Possible labor disturbance at ports along the South Atlantic and Gulf Coast in 2024.
The ILA and USMX agreement, expiring in September 2024, may lead to a labor disruption affecting South Atlantic and Gulf Coast ports. ILA leaders have indicated no extension and advised members to brace for a potential coast-wide strike in October 2024. No progress statements have been issued by either organization.
Monitoring end-of-2023 supply chain risks:
- Monthly TEU volumes between 2.4M and 2.6M stress ports; November’s 2.1M TEUs eased the pressure.
- Port transit wait times indicate supply chain efficiency; November showed stability.
- Ongoing pandemic impact, with rising COVID subvariants adding uncertainty globally.
- Economic health’s influence on U.S. container volumes; conflicting indicators persist.
- Panama Canal’s role, affected by the drought and ILWU agreement, may redirect trade flows.
- ILA/USMX contract negotiations: potential 2024 strike may disrupt U.S. container imports, especially on the South Atlantic and Gulf Coasts. Shifting volume to West Coast ports faces challenges or extended transit times. November posturing shows no progress.
Short-term recommendations:
- Monitor COVID variants, especially in critical supply chain areas like China.
- Track ocean shipments and carrier performance, addressing discrepancies in estimated arrival times.
- Stay informed about the Panama Canal situation due to potential shipping disruptions.
- Evaluate the impact of inflation, conflicts (e.g., Russia/Ukraine, Israel/Hamas) on logistics costs, and check for sanctions on key trading partners.
- Prioritize retaining supply chain resources, especially drivers, considering their well-being alongside wage increases.
- Assess the potential impact of an ILA strike in October 2024 on South Atlantic and Gulf Coast ports, exploring alternate ports or trade lanes.
Near-term recommendation: Reevaluate trade decisions for companies importing from Asia, especially regarding shifts away from West Coast ports.
Long-term recommendation: Assess supplier and factory location density to reduce reliance on overburdened trade lanes and conflict-prone regions, addressing potential business disruptions.
Note: This report uses initial U.S. Customs and Border Protection (CBP) data and is subject to revision by CBP. Revised data can be viewed in Descartes Datamyne.