
Early trade data from Descartes Datamyne suggests that at least some Middle Eastern exports are still reaching global markets despite the Hormuz shutown, via the Panama Canal, the Red Sea, and overland routes. Could these workarounds evolve into permanent, competitive alternatives (even after the Strait re-opens)?
Key Takeaways
- U.S. waterborne imports from Gulf States were down 32% in the first five months of 2026 compared with the same period in 2025, highlighting the significant trade impact of the Strait of Hormuz shutdown.
- Fertilizers appear more vulnerable than crude oil, with imports of nitrogen-based and potassium fertilizers from Gulf suppliers declining sharply.
- Gulf exporters are increasingly using alternative routes through the Red Sea, Gulf of Oman, Mediterranean ports, and overland rail, truck, and pipeline networks.
- Trade diverted from Hormuz is creating new pressure on other global chokepoints, including the Panama Canal, Bab el-Mandeb Strait, and major Indian ports.
- Early bill-of-lading data reveals emerging shifts in sourcing, routing, carrier activity, and port utilization.
- The growth of alternative logistics corridors suggests that some temporary workarounds could become lasting components of global supply chains if geopolitical risks persist.
Beginning with Iran’s February 28 shutdown and compounded by the U.S. blockade imposed on April 13, trade through the Strait of Hormuz has been brought to a near standstill. By May 17, the Financial Times reported that only a handful of ships were able to transit the waterway each day, down sharply from roughly 135 daily crossings before the conflict.
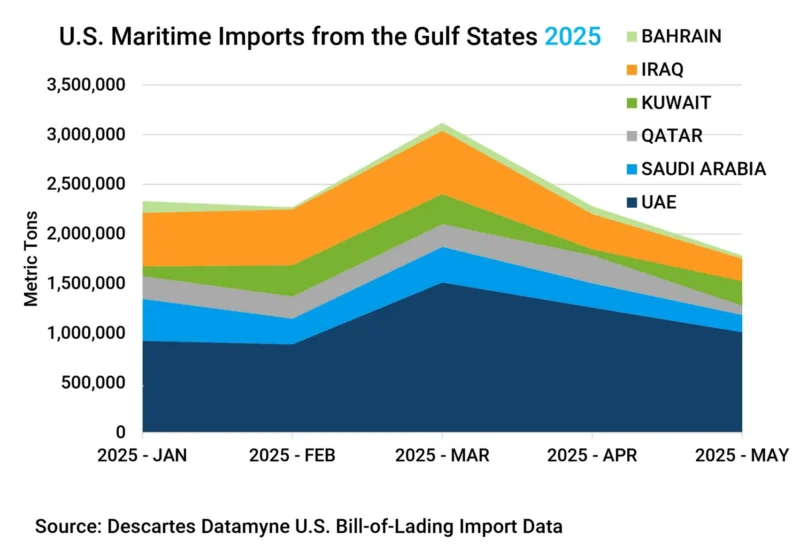
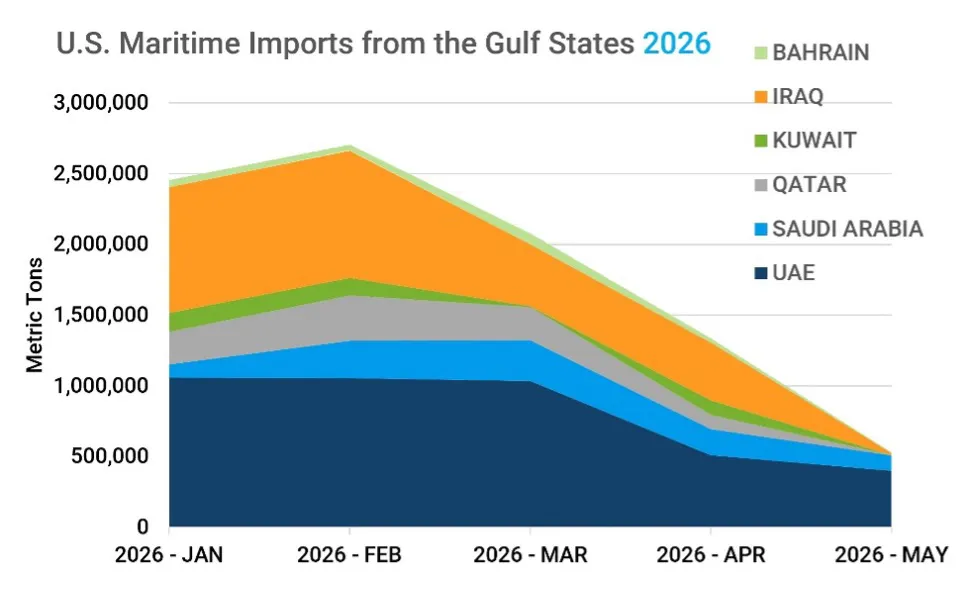
Descartes Datamyne maritime data, drawn from bills of lading, indicates that the volume of cargo from the Gulf States (excluding Iran) arriving at U.S. ports fell 32% in the first five months of 2026 compared with the same period in 2025 (see Figures 1 and 2). In May alone, imports from those sources were down 67% year over year.
Figure 1 U.S. Waterborne Imports from the Gulf States Affected by the Hormuz Shutdown (2025)
Source: Descartes Datamyne U.S. bill-of-lading import data.
Figure 2 U.S. Waterborne Imports from the Gulf States from Jan 2026 – May 2026
Source: Descartes Datamyne U.S. bill-of-lading import data.
Trade was measured in metric tons to better capture the petroleum-based commodities and fuel shipments that move by tanker and account for a leading share of the Middle East’s trade with the world.
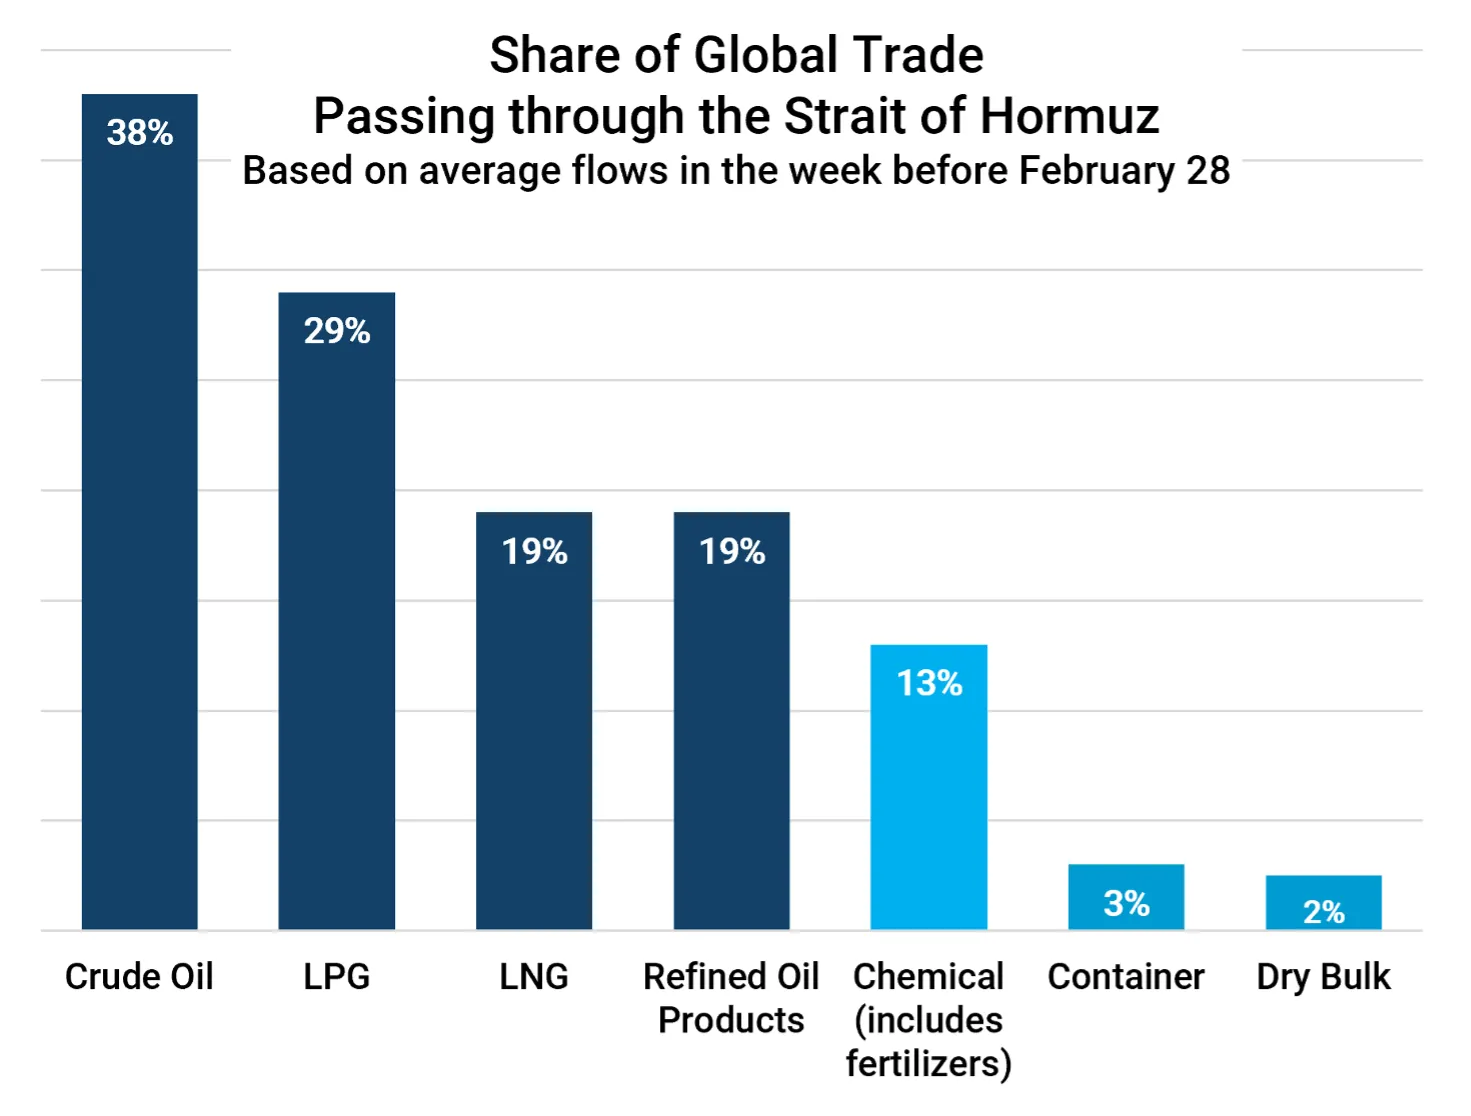
The Strait of Hormuz is the conduit for more than a third of the world’s seaborne oil shipments, a share that reached 38% in the run-up to the shutdown, according to an analysis by the UN Trade and Development (UNCTAD) (see Figure 3).
Figure 3 Share of Global Trade Passing Through Strait of Hormuz Ahead of Shutdown
Source: UN Trade and Development (UNCTAD) based on data provided by Clarksons Research.
The UNCTAD data underscores the critical importance of the Strait of Hormuz to global energy supplies. According to the U.S. Energy Information Administration (EIA), crude oil and petroleum liquids were transported through Hormuz at the rate of 20.9 million barrels a day (Mb/d) in 2025. Only the Strait of Malacca, the conduit for 23.2 Mb/d from the Indian Ocean to the Pacific, ranks higher among the world’s most consequential chokepoints.
Assessing the Impact on U.S. Imports
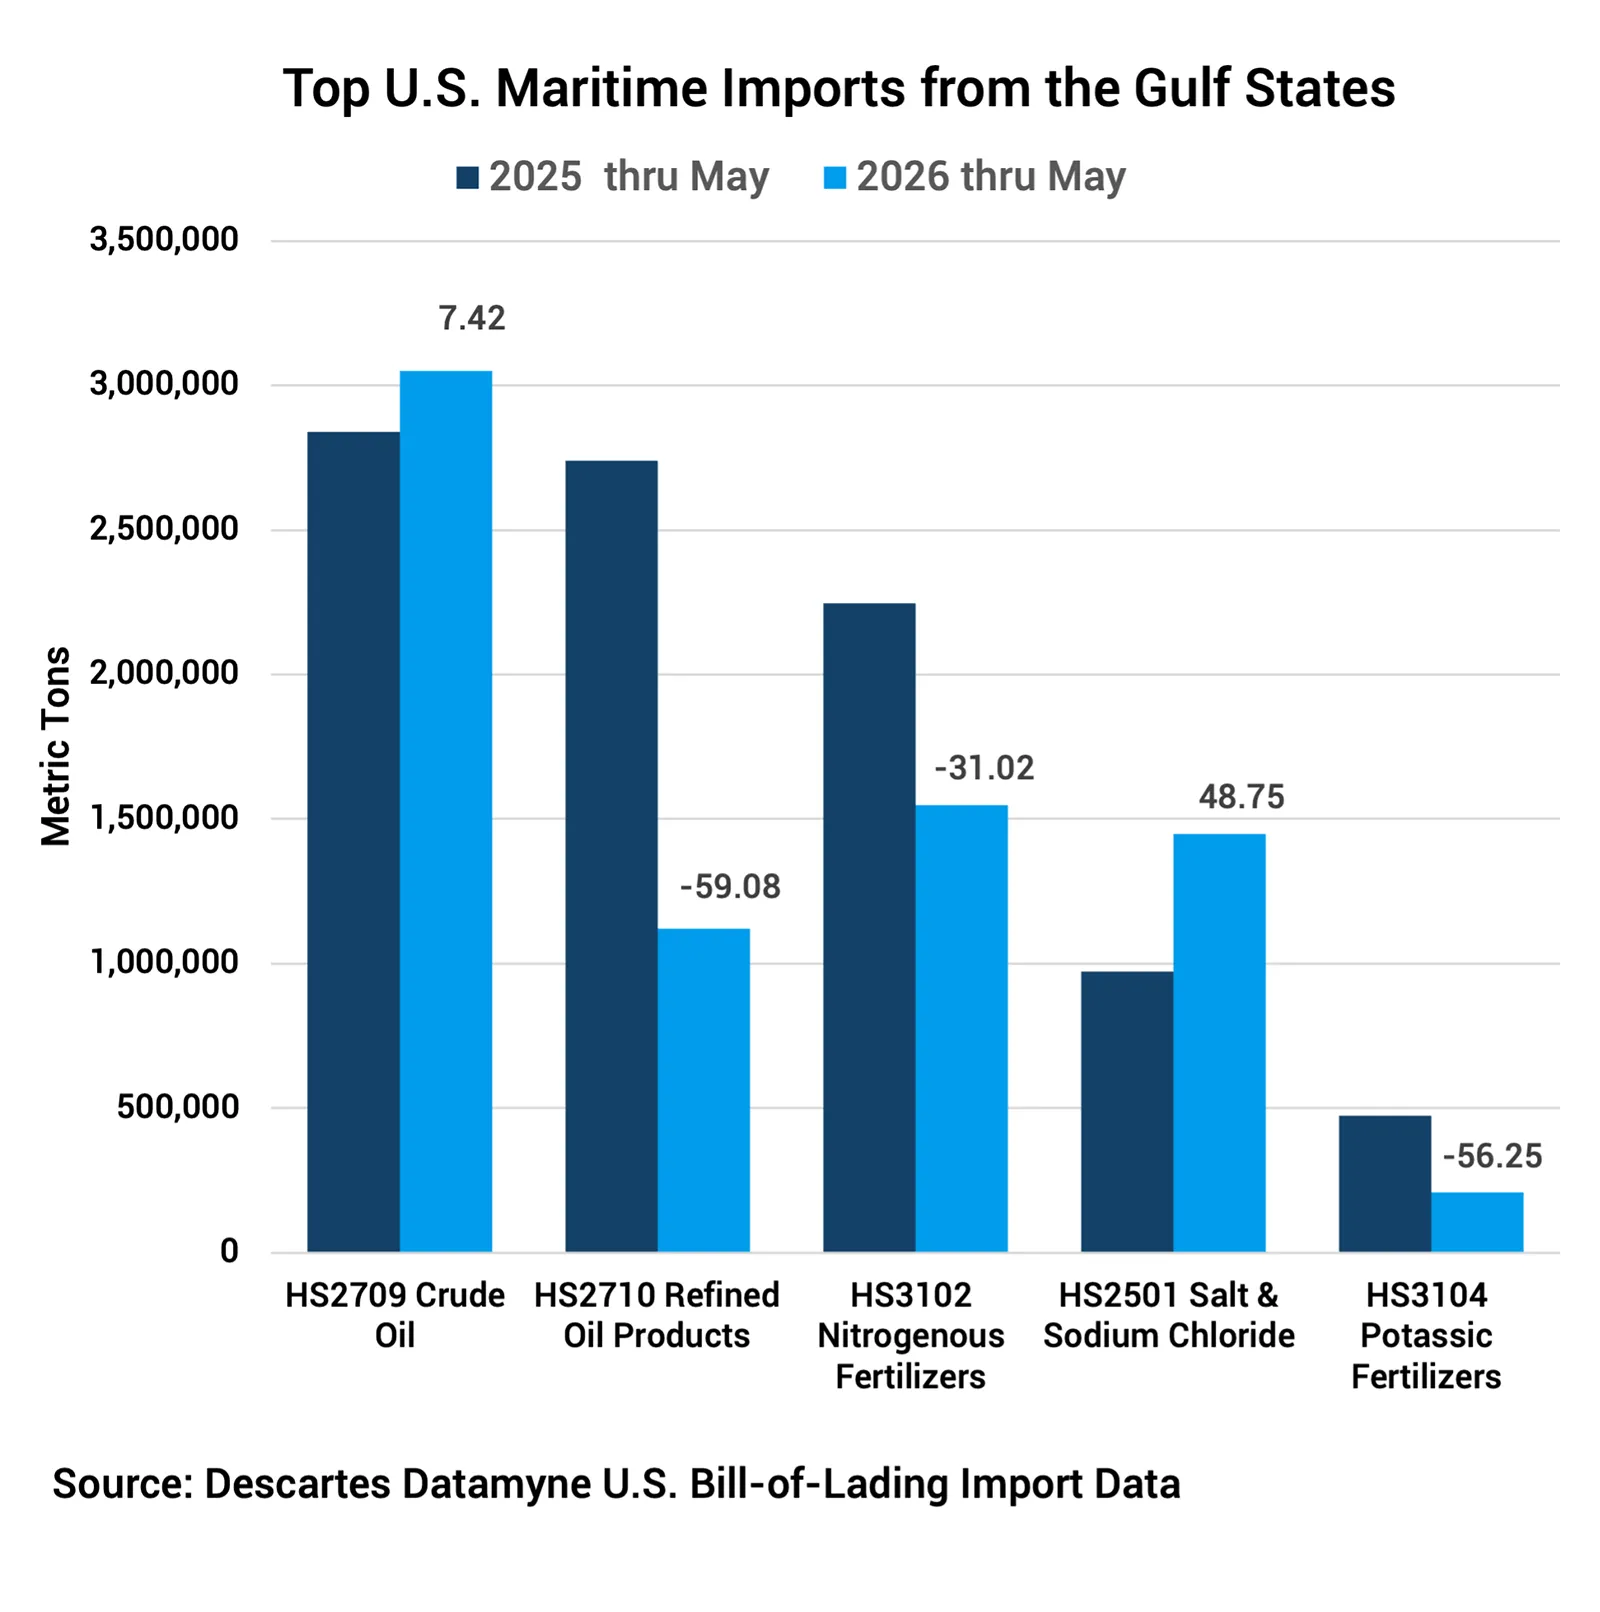
Descartes Datamyne maritime data also offers a way to gauge U.S. vulnerability to a disruption in trade through the Strait of Hormuz (see Figure 4).
Figure 4 Top 5 (by Volume) U.S. Waterborne Imports from Gulf States from Jan – May (2025 & 2026)
Source: Descartes Datamyne U.S. bill-of-lading import data.
From January through May 2026, U.S. imports of crude oil [HS2709]—the top import from the Gulf States by weight—rose 7% year to date. The increase was driven by a 45% year-over-year surge in Iraqi crude in February, just ahead of the Hormuz shutdown. By contrast, refined oil products [HS2710] from the Gulf States were down 59% from the same period in 2025.
But Gulf crude accounts for just 7% of the top five (by volume) U.S. waterborne imports. According to an analysis from the Federal Reserve of St. Louis, as the U.S. economy has become less dependent on external oil, the ratio of oil imports to GDP has declined. At the same time, the rise of the shale oil industry has increased the contribution petroleum exports make to U.S. GDP.
The U.S. appears more exposed to disruptions in fertilizer supply. In 2025, the Gulf States provided 48% of U.S. waterborne imports of nitrogen-based fertilizers [HS3102] and 60% of potassium fertilizers [HS3104]. In the first five months of 2026, shipments of these commodities were down 31% and 56%, respectively. Census data, however, shows that the U.S. remains largely dependent on Canada for potassium—better known as potash—covered by HS3104.
The Gulf States, led by Qatar, were also the source of about 14% of all U.S. imports of nitrogen fertilizers [HS3102] and 30% of urea [HS310210], a key fertilizer input. Census data shows Qatar accounted for 12% of nitrogen fertilizer imports and 22% of urea imports in 2025. The Fertilizer Institute estimates that the U.S. relies on imports for about 36% of its urea consumption, down from 58% in 2014.
Among the top maritime imports from the Gulf, salt and sodium chloride [HS2501] posted the largest increase, rising 49% year over year. The gain appears to reflect U.S. efforts to replenish stocks depleted by the unusually long, cold winter. The sole Gulf source of these shipments, the UAE was able to meet the demand thanks to its access to Egypt’s Mediterranean ports, according to Descartes Datamyne bill-of-lading data. It’s an early return on the UAE’s investment in Egyptian port development, part of the Emirati strategy to diversify trade routes and increase bilateral commerce.
Looking for a Way Around the Strait of Hormuz
As traffic through the Strait of Hormuz slowed to a halt, carriers scrambled to reroute cargo overland to open ports. The Financial Times reports that major shipping lines have opened truck routes linking ports on the Red Sea and Gulf of Oman—including Yanbu and King Abdullah in Saudi Arabia and Fujairah in the UAE—to ports such as Dammam in Saudi Arabia, Basra in Iraq, and Jebel Ali in the UAE.
Oil is also moving through pipelines. Saudi Arabia’s East-West pipeline connects eastern oil fields to Yanbu on the Red Sea. The UAE’s Abu Dhabi Crude Oil Pipeline links Habshan to Fujairah on the Gulf of Oman. Descartes Datamyne maritime data shows 120,943 tons departing Fujairah for the U.S. through May this year, up from none in 2025.
On April 1, Saudi Arabia Railways launched a new freight corridor connecting Persian Gulf ports to Jordan’s Port of Aqaba on the Red Sea. According to Railway Pro, the service could cut transit times in half compared with trucking. Like the UAE’s investment in Egyptian ports, the project fits into a broader Saudi strategy to diversify trade routes and reduce reliance on maritime chokepoints.
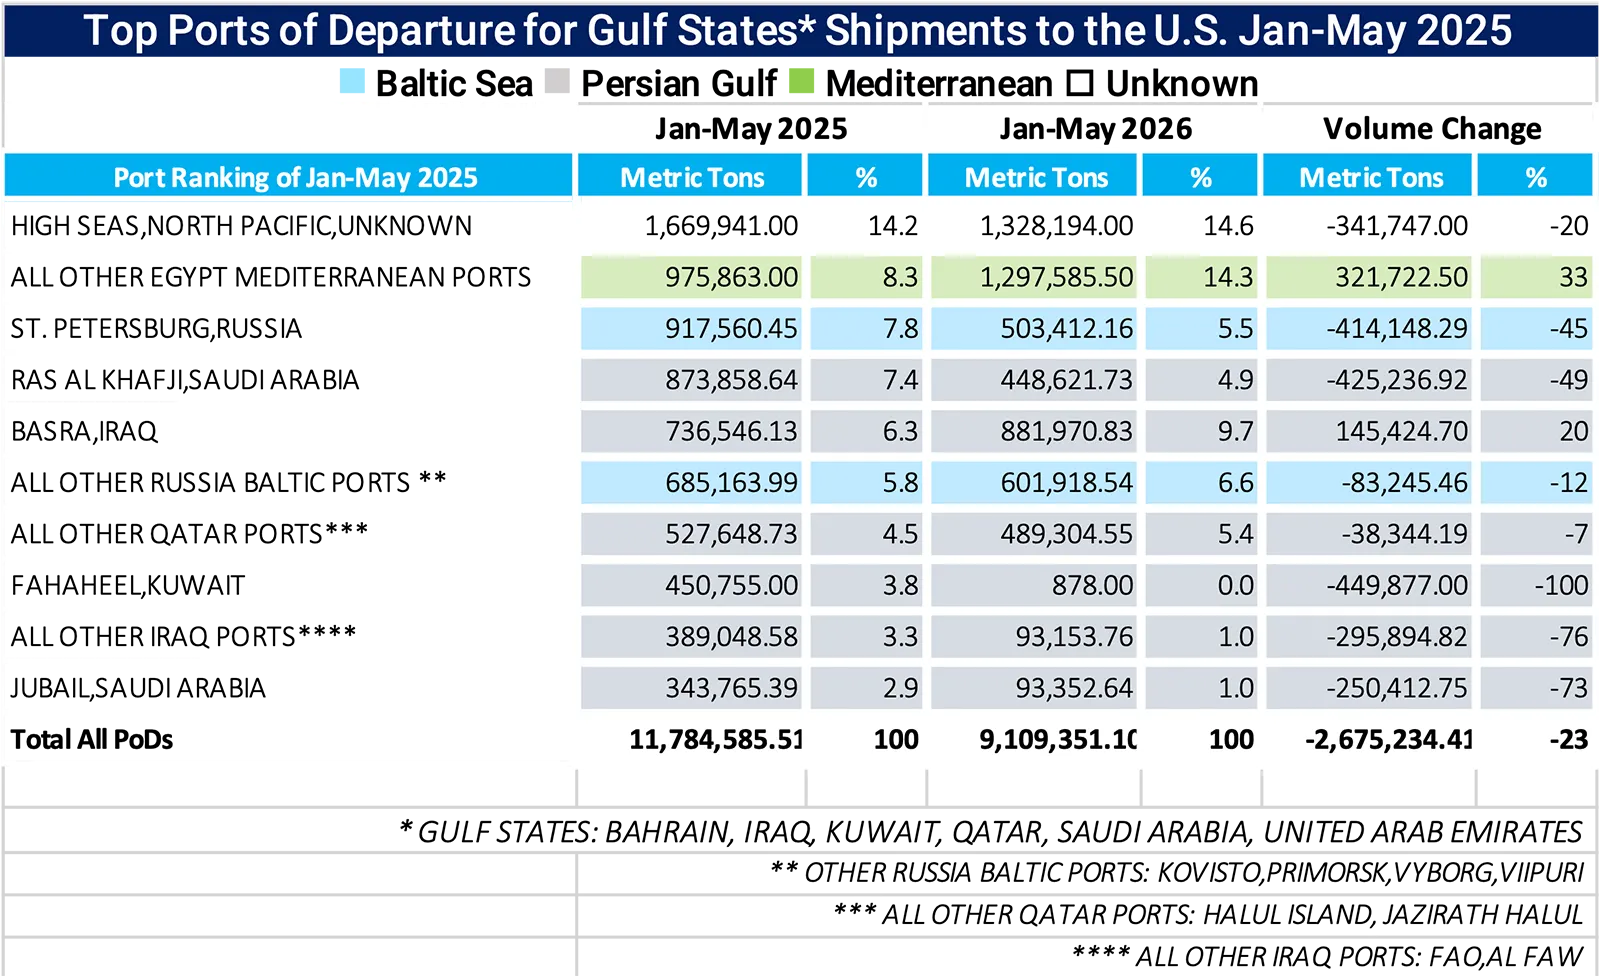
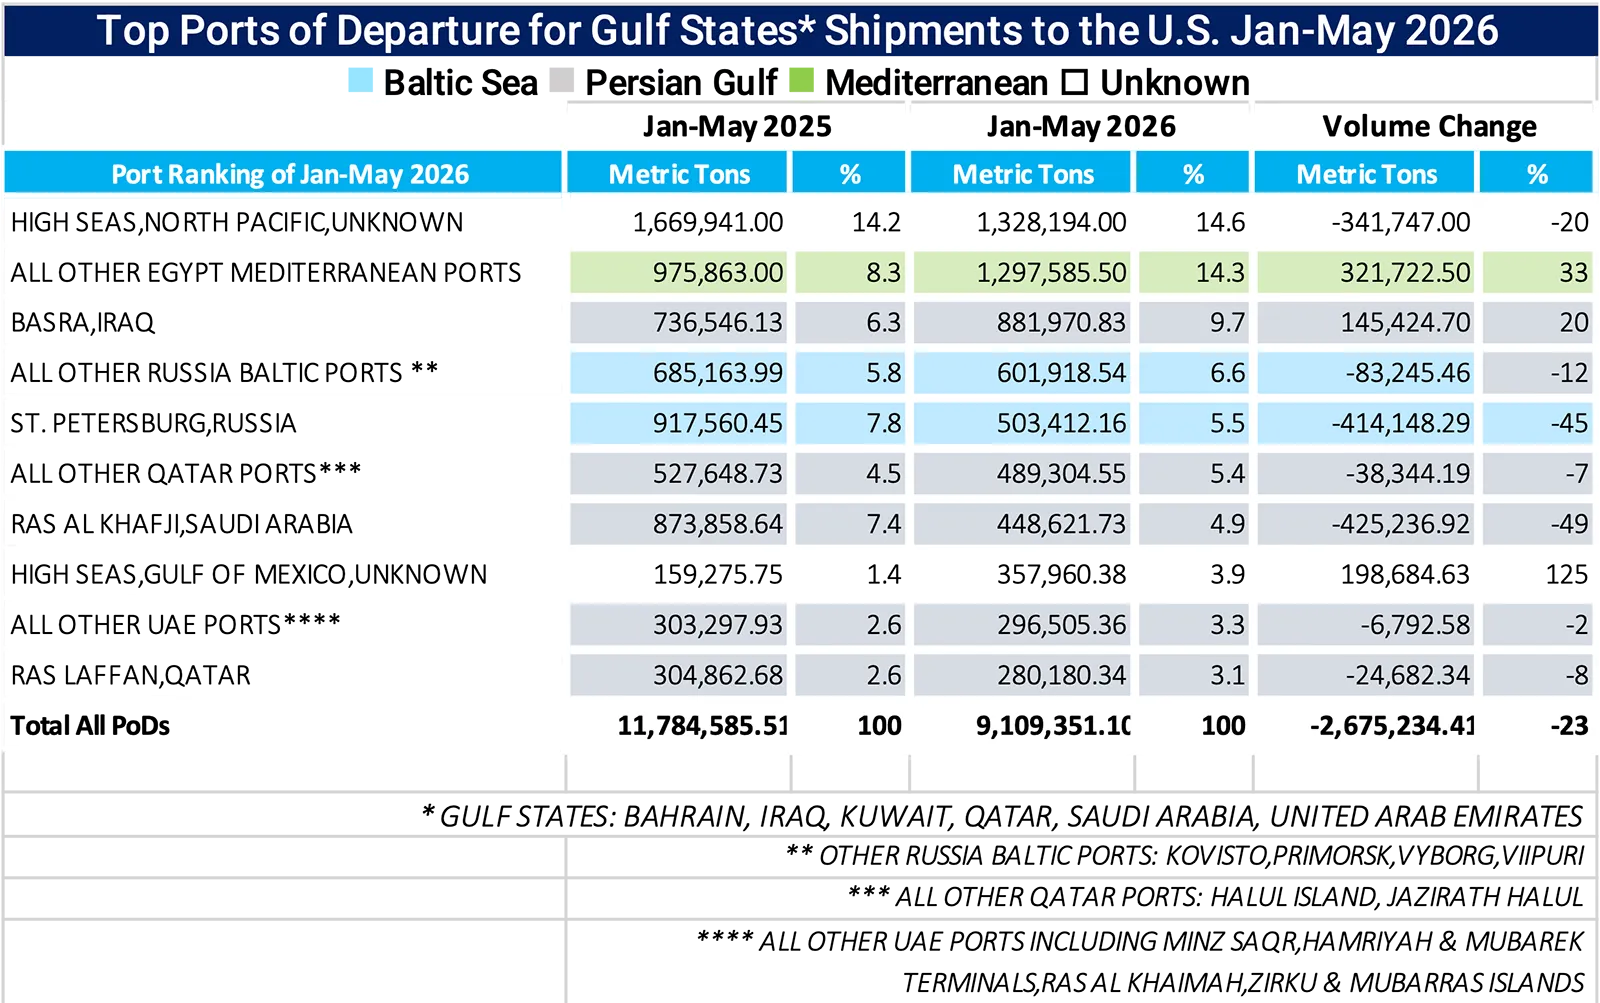
For now, overland transport can handle only a fraction of the waterborne volumes that normally pass through the Strait of Hormuz. As the maritime data shows, closing the strait that links the Persian Gulf to the world’s oceans has taken a heavy toll on outbound shipping from Gulf ports. But the early data also shows the region’s exports finding outlets on the Red Sea, the Gulf of Oman, and the Mediterranean (see Figures 5 and 6).
Figure 5 2025 (Jan – May) Top-Volume Ports of Departure for U.S. Imports from Gulf States
Source: Descartes Datamyne U.S. bill-of-lading import data.
Figure 6 2026 (Jan – May) Top-Volume Ports of Departure for U.S. Imports from Gulf States
Source: Descartes Datamyne U.S. bill-of-lading import data.
The increase in UAE salt exports helped drive a 33% rise in shipping volume from Egyptian ports. Most of 2025’s other leading ports, however, posted declines. The pre-shutdown surge in oil lifted Basra to a 20% year-over-year increase. The largest gain, though, was recorded under the catch-all category “High Seas, Gulf of Mexico, [Otherwise] Unknown [Port].”
From One Chokepoint to the Next
The biggest beneficiary of the Hormuz shutdown and the resulting increase in Gulf-bound traffic appears to be the Panama Canal. As the Financial Times reported in May, daily transits have risen by as much as 20% since February, while revenue is up 15%. The traffic is moving in both directions as Asian traders secure oil and dry-bulk commodities from the U.S.
The Panama Canal, of course, is itself a chokepoint, with its own vulnerability to closure. Severe drought in 2023 lowered water levels and slowed traffic. With an El Niño event threatening this year, canal authorities say that unusually heavy dry-season rains, conservation measures, and close monitoring should prevent a repeat. While acknowledging that disruption-driven surges eventually fade, Panama Canal CFO Victor Vial told the Financial Times that he expects some of the added traffic to remain as shippers hedge against continued instability in the Middle East.
Also in 2023: Houthi militants in Yemen started attacking commercial ships in the Red Sea. Traffic through Bab el-Mandeb plummeted 70%.
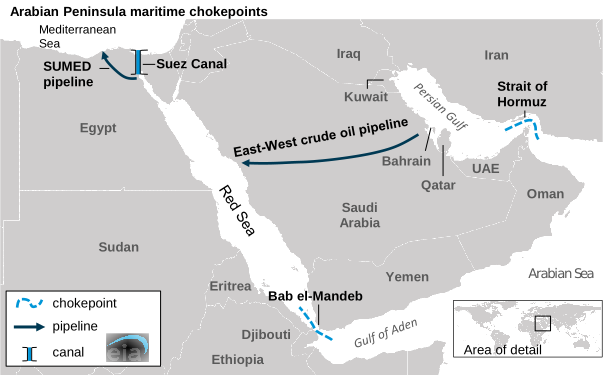
On the map, the Red Sea west of the Arabian Peninsula looks like the natural alternative to the Strait of Hormuz to the east. At its northern end are two man-made links to the Mediterranean: the Suez Canal and the Arab Petroleum Pipelines Company (SUMED) pipeline. At its southern end, the Bab el-Mandeb Strait opens into the Gulf of Aden and beyond (see Figure 7).
Figure 7 Map: Chokepoints between Arabian Peninsula and Ocean Trade Lanes
Source: U.S. Energy Information Agency.
Carriers may well approach the re-opening of the Strait of Hormuz with the same wariness: At this writing (June 17), Hormuz is set to re-open June 19, following an agreement reached by the U.S. and Iran to end the conflict and begin negotiating a nuclear deal. But a return to full operation will not happen with the stroke of a pen. De-mining, evacuating trapped tankers, and restarting production will take some time.
As noted, truck, rail, and pipeline links across the Arabian Peninsula are being used to reroute cargo away from the Strait of Hormuz and toward the Red Sea. Descartes Datamyne maritime data shows an upswing in shipments bound for the U.S. from Saudi Arabia’s port of Jeddah, with containerized cargo rising 71%—measured in twenty-foot equivalent units (TEUs)—and tonnage up 50% year to date in 2026.
But commercial traffic faces risks at Red Sea chokepoints as well. The Suez Canal and the Panama Canal both share the risk of lower water levels caused by drought. Security concerns in the Red Sea also persist, and shipping is returning only gradually. At the end of March, Maritime News reported that just 30 to 35 vessels a day were transiting the Bab el-Mandeb Strait, well below the more typical 70. Many carriers continue to route ships around Africa’s Cape of Good Hope—a safer but longer and costlier voyage.
Blocked chokepoints create more chokepoints as alternative trade lanes and ports of call become congested by diverted shipments. Shipments rerouted to bypass Hormuz are crowding Indian trade lanes, reports Indian Transport & Logistics News, lengthening delays to 49 days at Mundra, one of India’s largest ports.
Early Bill-of-Lading Data Points to Shifting Logistics
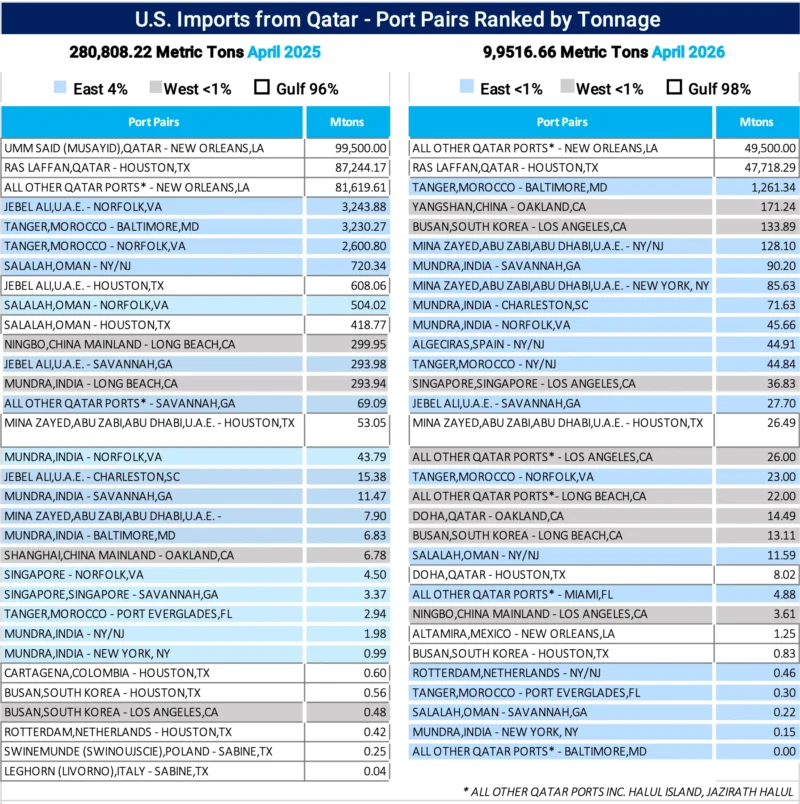
Descartes Datamyne U.S. import data, drawn from bills of lading and released two days after shipment arrival, provides early indicators of shifting logistics. To illustrate shifts, before-and-after maritime import data from Qatar was examined by comparing year-over-year changes in April shipments. By May, inbound cargo had dwindled to 1,813 metric tons, 40% consisting of empty containers for compressed or liquefied gas. The volume of this trade fell 65% from April 2025 to April 2026, dropping from 280,808 to 99,517 metric tons (see Figure 8).
Figure 8 Ports of Departure and Arrival for U.S. Imports from Qatar Ranked by Volume (April 2025 vs. April 2026
Source: Descartes Datamyne U.S. bill-of-lading import data.
Much of the loss is accounted for by the absence of the Port of Umm Said, the point of departure for 99,500 metric tons of urea [HS310210] to New Orleans in 2025, from the line-up. The adjacent industrial city of Mesaieed is host to QatarEnergy’s fertilizer complex, a strategic development intended to position Qatar as the world’s largest urea exporter, post-2030, according to Sahmik market analysts.
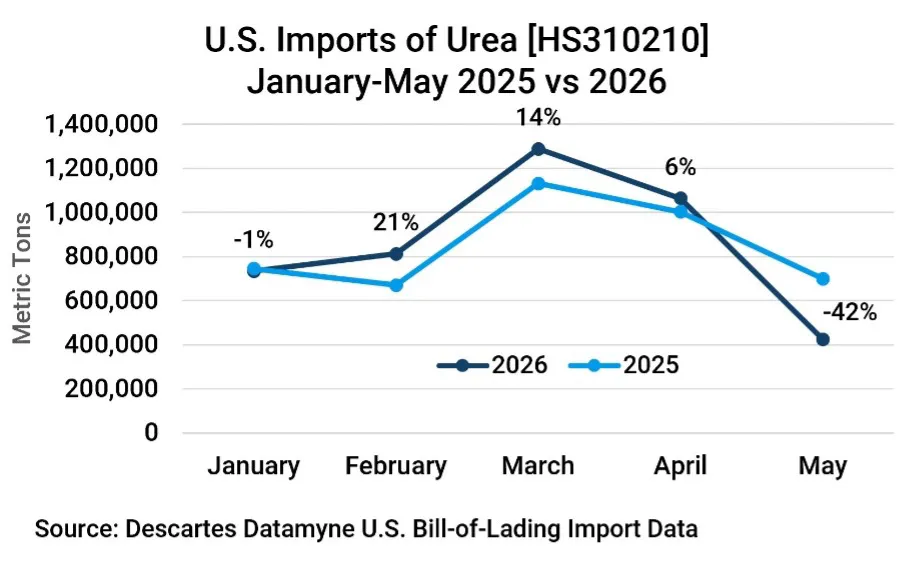
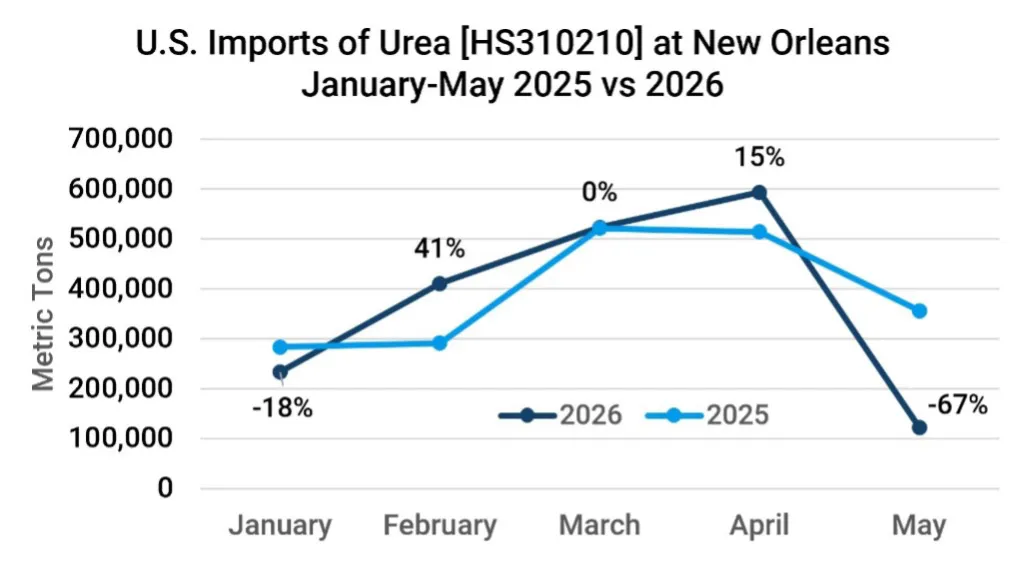
Bill-of-lading data shows that U.S. imports of urea fell 42% in the first five months of 2026 compared with the same period in 2025 (see Figure 9). At New Orleans, the top port of arrival, shipments plunged 67%.
Figure 9 U.S. Maritime Imports of Urea (Jan – May 2025 & 2026)
Source: Descartes Datamyne U.S. bill-of-lading import data.
Figure 10 U.S. Imports of Urea Arriving at New Orleans (Jan – May 2025 & 2026)
Source: Descartes Datamyne U.S. bill-of-lading import data.
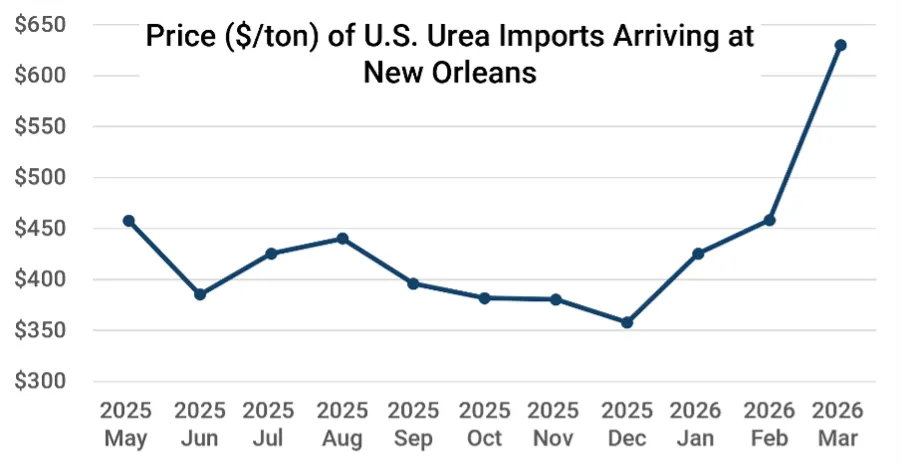
Scarcer supply tends to push prices higher and the price of urea has skyrocketed, underscoring how quickly disruptions in Gulf trade can ripple through global markets. (In April, Reuters reported that traders were buying imports on barges on the Mississippi to be diverted to export markets where they could command a higher price.)
Figure 11 Price Rise in Urea Imports Arriving at New Orleans May 2025 through March 2026
Source: U.S. Department of Agriculture.
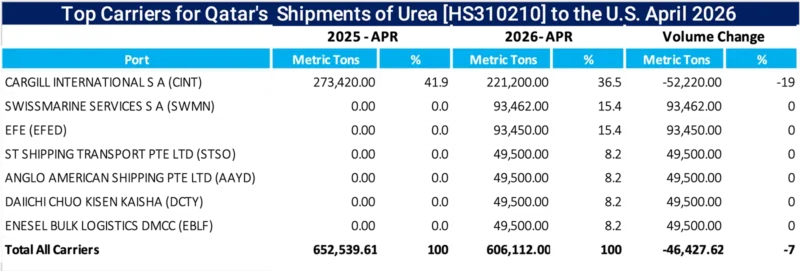
Port data suggests that Qatar’s U.S.-bound shipments in April were concentrated in Gulf of Mexico ports to the detriment of East Coast arrivals (see Figure 12). At the same time, alternative transshipment hubs Busan in South Korea and Mundra in India moved up in the rankings, albeit on much smaller trade volumes. Jebel Ali, a major origin point for shipments to Norfolk, was also forced to suspend operations temporarily in March.
Figure 12 Top-Volume Carriers of U.S. Imports of Urea from Qatar in April 2026
Source: Descartes Datamyne U.S. bill-of-lading import data.
What’s particularly striking about these findings is that, with the exception of Cargill, none of these carriers were engaged in this trade in April 2025. As the current conflict continues, or geopolitics jeopardizes other chokepoints, investment in diversifying trade lanes is likely to build.
How Descartes Datamyne Can Help
Geopolitical disruptions, trade lane congestion, and shifting sourcing strategies are reshaping global supply chains faster than many organizations can react. As the Strait of Hormuz shutdown demonstrates, logistics networks can change dramatically in relatively short period of time, creating new risks, and new opportunities, for importers, exporters, carriers, and supply chain professionals.
Descartes Datamyne provides timely access to U.S. import and export bill-of-lading data, enabling businesses to identify emerging trade patterns as they develop. With shipment-level visibility into products, suppliers, buyers, carriers, ports, and trade lanes, organizations can monitor disruptions, assess supply chain exposure, and uncover alternative sourcing and transportation options.
Because Descartes Datamyne maritime data is available just days after cargo arrival, companies can track market changes earlier than traditional government trade statistics. Users can analyze shifts in port activity, identify new routing strategies, monitor competitor supply chains, and measure the impact of geopolitical events on specific commodities, industries, and trading partners.
Whether evaluating supplier diversification opportunities, tracking changes in global logistics networks, or assessing exposure to critical trade chokepoints, Descartes Datamyne delivers the actionable trade intelligence needed to make informed supply chain decisions in an increasingly volatile global environment.