The Latin American economy’s recession could deepen if China’s economy slows much more, says the International Monetary Fund in a new report that marks down already gloomy forecasts for the region.
Brazil, Latin America’s biggest economy, is a drag on the entire region. Already in the depths of its worst recession in over a century, Brazil is forecast to contract 3.8% in 2016. Argentina, Chile and Venezuela also face contractions this year. In contrast, the outlook for Mexico, LatAm’s No. 2 economy, and Central America is relatively robust.
What sets the faltering economies apart from the more robust? Trade partnerships.
As an analysis from OECD explains, trade between LatAm and China has been a boon to the region, increasing 22-fold since 2000. But the LatAm-China relationship has mostly been about China’s consumption of the region’s commodities … and that relationship is showing its limitations now.
In contrast, “Manufacturing exporters, such as Mexico and Central America, integrated into value chains in the United States, are outperforming net commodity exporters in South America.”
Our trade data is a good measure of the Latin American economy’s exposure to the down-side risks of relying on China as a customer.
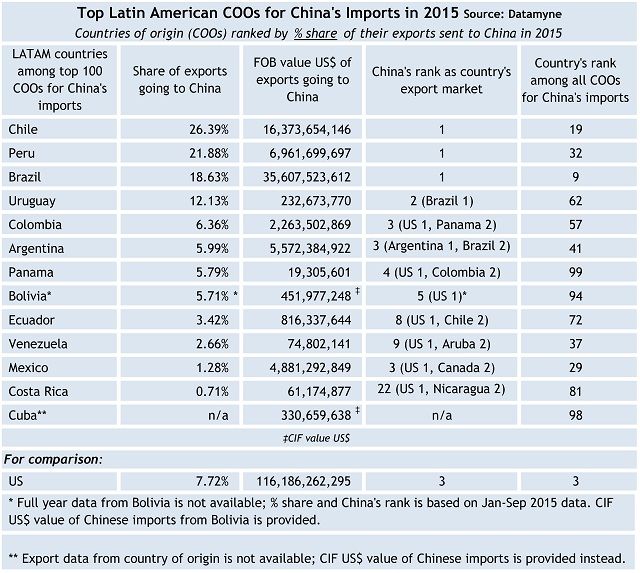
We looked at the data on all the CELAC [Community of Latin American and Caribbean States] countries that made it into the ranks of China’s top 100 countries of origin for imports in 2015. China is the No. 1 market for, in order of trade value, Brazil, Chile and Peru. In order of dependence, Chile ranks first with China accounting for more than a quarter of its exports, followed by Peru (22%) and Brazil (19%).
Here are the full results for 2015 (you can compare these tables with the 2014 editions here):
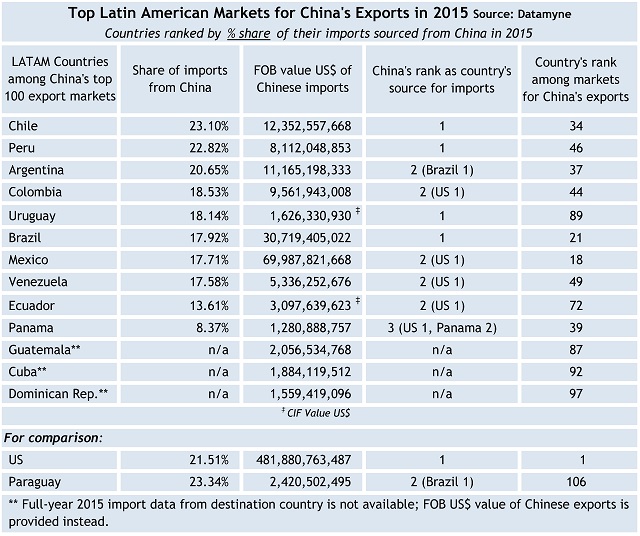
We found that the same countries are also reliant on China for inbound trade. China is the No. 1 country of origin for imports by Brazil, Chile, Peru and Uruguay. Note, however, that Mexico is far and away the top Latin American importer of Chinese trade goods by value.
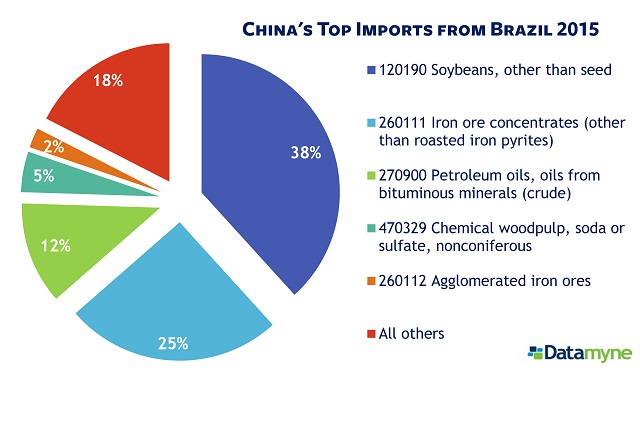
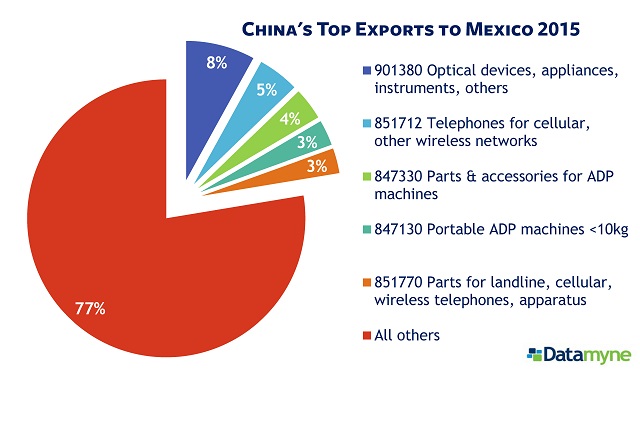
The data on China’s top exports from Brazil and Mexico’s top imports from China points to another difference in the ties that bind the trading partners. Brazil’s shipments to China are concentrated on a few commodities (nearly 40% soybeans, 27% for two forms of iron ore).
Shipments arriving in Mexico from China represent a more diverse mix of goods. The top five Harmonized System (HS) tariff codes account for 23% of total exports, and cover not only consumer electronics, but also parts for making finished products on Mexican assembly lines. Top HS 901380 covers flat panel displays used to make flat screen TVs and monitors (a top Mexican export).
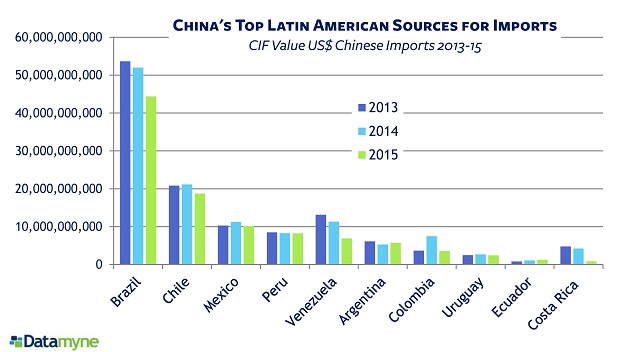
The trend data below shows that China has been buying less from its top LatAm sources. Imports from Brazil fell -17% between 2013 and 2015. The -83% drop in imports from Costa Rica during the same period is a result of Intel’s having closed its manufacturing operations there in 2014. Imports from Argentina edged up from 2014 to 2015, but have not returned to 2013’s level. Only Ecuadoran imports bucked the trend with an increase of 60%.
Looking at China’s outbound trade, Mexico has overtaken Brazil as the top Latin American destination for exports.

The OECD warns that China is shifting to a “second-phase” development agenda that will curb its appetite for commodity exports, with consequences for a Latin American economy still dependent on this trade. For example, by 2030, metal and ores exports could decline from 16% in the previous decade to 3%.
The OECD does see new opportunities for LatAm tourism and services in China’s “recomposition of consumption.” But the real opportunities for economic growth are in greater participation in global value chains.
To get in on that action, Latin America will need to invest and innovate its way to a much more diversified trade basket. As the OECD points out, China has developed comparative advantages in 60 industries. Only Colombia and Costa Rica match the Chinese increase.
We’ll continue to watch the data on the Latin American economy – Datamyne has data sourced directly from 17 LatAm countries – for signs of diversification. If you would like to see the data on LatAm trade baskets and markets, just ask us.
Related:
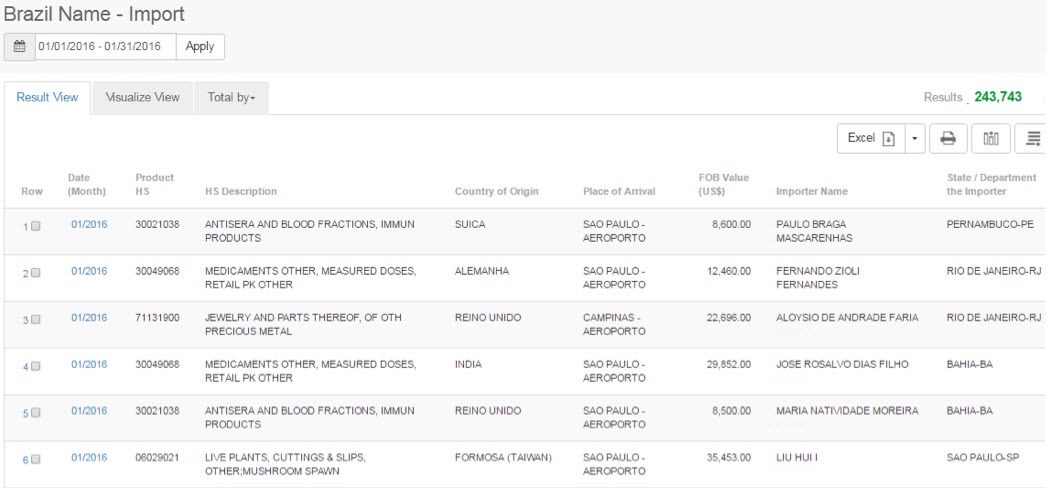
NEW DATA ASSETS: We now offer detailed Brazilian trade data covering shipments via truck, rail, air, and ocean, and including:
- Names of companies importing into and exporting from Brazil
- Product HS descriptions
- Quantity, unit type and FOB Value ($US)
- Countries of origin and destination
- Modes of transport
Data is available beginning with January 2015 and is updated each month with trade records from one month prior. Here’s a sample (to see more, just ask us):