Government policies shape biofuels markets
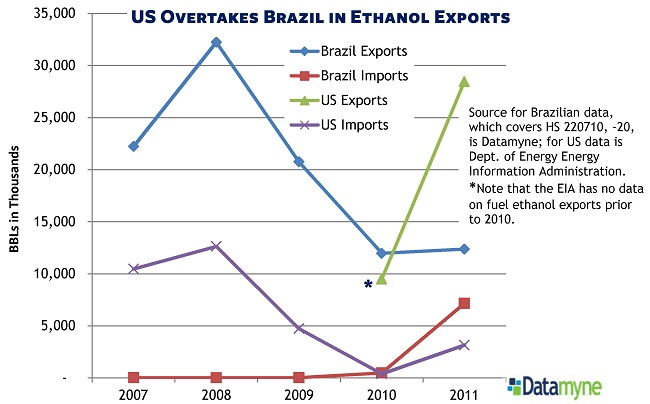
Sometime around the middle of last year, the US surged ahead of Brazil to become the world’s highest-volume exporter of ethanol.
According to the Department of Energy’s Energy Information Administration (EIA), the US boosted its exports of ethanol to an average of nearly 78,000 barrels per day during 2011, up 200% from 2010.
Mother Nature had something to do with this abrupt reordering of the ethanol market: A poor crop of sugarcane created shortages in, and drove up the cost of sugar-fed Brazilian ethanol relative to US ethanol made from corn.
But so, too, did government policy: The price of the US product in Brazil was reduced still further by that country’s elimination of a 20% duty on ethanol imports. The EU also lowered tariffs on ethanol-gasoline blends.
And, of course, government policies – in the form of biofuel usage mandates – support market demand for ethanol. Over 50 countries have mandates, according to this report from Federación Nacional de Biocombustibles de Colombia. Brazil currently mandates that ethanol represent a minimum 18-20% (E18 to E20) of transport fuel blends – this was eased from E25 during last year’s shortages. The US Environmental Protection Agency sets yearly targets, based on the EIA’s gasoline and diesel projections, to achieve a Renewable Fuel Standard (RFS). The goal is 36 billion gallons of renewables in the mix of transportation fuels sold by 2022. (The 2012 RFS is here.)
Most of last year’s US ethanol exports went to fill in Brazil’s domestic production shortfall.
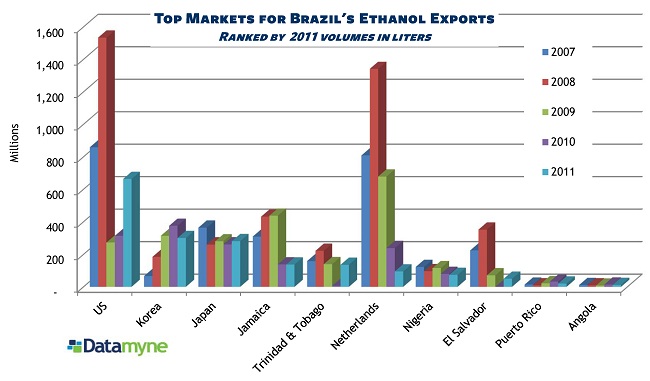
Curiously (at least to us), Brazil continued to export ethanol – and, as the graph below shows, Brazil’s biggest customer was the US. In fact, the US probably took in more of the Brazilian product as shipments to the Caribbean are generally taking advantage of the island nations’ no-tariff status and are ultimately bound for the States.
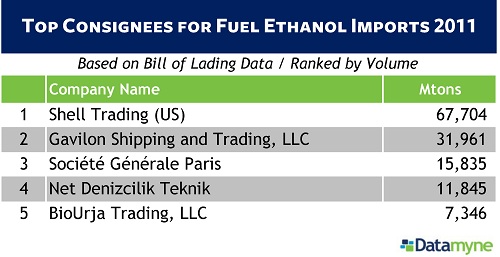
So, even as US ethanol exports shot up, imports were also on an upward trajectory (see the line chart below). Now, the US is still a net exporter of ethanol. And, as a quick look at the top consignees of fuel ethanol (also below) confirms, much of last year’s US-inbound flow would seem to be part of global agricultural commodities trading.
But government policy again has a thumb on the scale. This time it’s the California Air Resources Board’s Low Carbon Fuel Standard which is intended to reduce greenhouse gas emissions generated by California transport by 16 million metric tons by 2020. Under this scheme, various fuels are assigned a “carbon intensity” value based on a life-cycle analysis that covers the carbon-based energy it takes to produce, deliver, store and use the fuel. Based on its production pathway calculations, California gave Brazilian sugarcane ethanol a lower CI than US corn-fed ethanol, and a big boost in demand.
The result last year was what critics call the “Ethanol Shuffle”: ships carrying ethanol from the US Midwest bound for Brazil passing ships delivering Brazilian ethanol to the US.
The California standard was suspended by a California district judge in December 2011 and, pending the outcome of court proceedings, may be modified. But the legal issue concerns interstate commerce, not the production pathway methodology that US industry groups criticize. Other states are considering similar CI rating schemes. The federal 2012 RFS also gives the edge to the Brazilian fuel. For now, at least, the policy-driven trade pattern looks likely to shuffle on.


