


Latin America’s economy is moving at two speeds, according to BBVA, with the Pacific Alliance gaining ground as Mercosur, the Common Market of the South, slips into reverse in 2015 and on into 2016.
In its first-quarter 2016 outlook, the Spanish bank lowers its forecast for global GDP growth in 2016 to 3.2% – kicking a more robust recovery to year-end and 2017. Following on the depressed global outlook, BBVA’s 2016 growth projections for all LatAm countries except Peru (where the impact of El Niño is less than anticipated) get downward revisions.
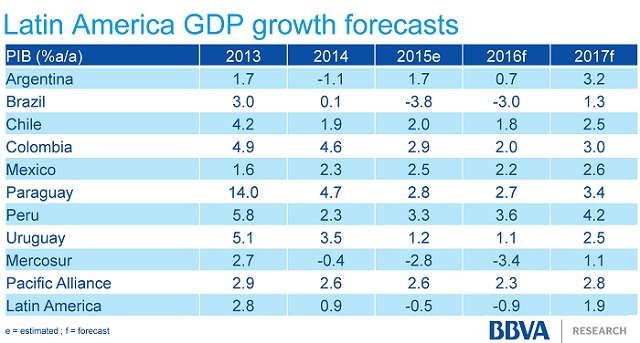
BBVA projects the Pacific Alliance (members Chile, Colombia, Mexico and Peru) will achieve somewhere between 2% and 2.5% growth in 2016. This is less than in 2015, and still below the trade bloc’s potential, which the bank puts at 3.8%. But the growth rate should improve as this year ends and the next begins.
Indeed, BBVA sees the Pacific Alliance, currently the 6th biggest economy in the world, rising to 5th in terms of contribution to global growth in the next 10 years.
Meanwhile, Mercosur (Argentina, Brazil, Paraguay, Uruguay and Venezuela) is forecast to contract by around -3.4%, with recession in Brazil providing most of the drag.
Here are BBVA’s projections on the economic growth of the blocs’ member nations as well as the Pacific Alliance and Mercosur, and Latin America overall:
Market pressures on countries that are relatively dependent on external financing and commodity exporters – and, especially, commodity exports to China – have ratcheted up in recent months, says BBVA.
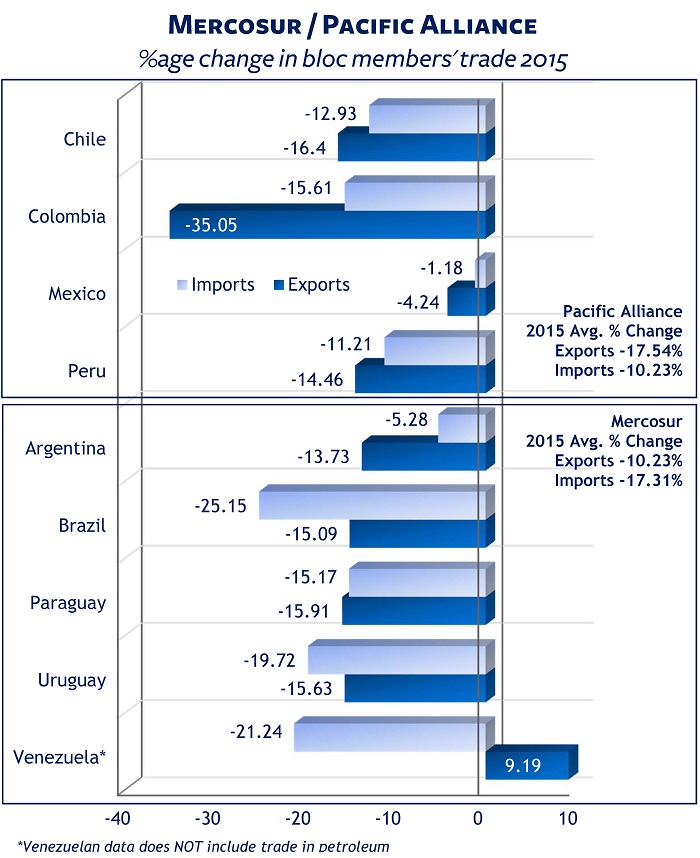
These pressures have resulted in sharp losses in export and import values for Latin America’s top trading nations in 2015, as our trade data indicates. By this measure at least, both the Pacific Alliance and Mercosur look to have traveled in the same direction at comparable speeds. Here’s a summary of the data:
You can see more data on the trade of the countries of the Pacific Alliance and Mercosur – including top imports, exports, trading partners and trends – in our free reports, which you can download by clicking on the titles here:
Digging deeper
Venezuela appears to be an outlier in the chart above, clocking a 9% increase in exports. But maybe not …
As footnoted, the Venezuelan data does not cover the country’s oil exports. But the data does cover its petroleum-based exports. Petrochemicals, which rank as Venezuela’s most valuable (documented) exports, sustained losses in 2015, starting with methanol (which dropped in value -42%), napthalene (-11%), ethylene glycol (-18%), and propylene (-65%).
So what accounts for the surge in Venezuelan exports? According to the trade data, tankers for the transport of goods (HS 890120). The value of these empty tankers surged 3,339% to $300 million in 2015, and accounted for 11% of Venezuelan exports. Most were destined for Aruba in the Netherlands Antilles. Venezuela’s state-run oil company, PDVSA, has storage and blending facilities on the neighboring Antilles islands, Bonaire and Curaçao. The underlying records label these shipments as “reexpedicion prov. de admision” – essentially, returns to the point of origin.
Rather than a clear gain for Venezuelan exports, these shipments may have more to do with the global traffic snarl of tankers – laden and unladen – as over-supplies and plummeting prices distort oil market flows. Just last November, Reuters reported that inbound oil tankers waiting at Venezuelan ports to be paid before discharging were keeping empty vessels from loading product for export.
If you would like to dig deeper into the trade data for individual LatAm countries or products, down to the underlying records, just ask us.
Related: