


As one of the top stories of 2021, every day there are multiple stories about global importing and the current shipping crisis speculating when it might end. While there are many reasons it exists, sorting through the noise to find the answer is not an easy task. There is one place, however, where we examine global trade data trends and further understand what may be on the horizon – ocean import volumes.
When will the supply chain capacity crunch end?
The question facing shippers, carriers, and market observers as we enter peak season 2021 is this: when will the global shipping crisis end? In the three charts below of container shipment volume (twenty-foot equivalent unit or TEU), we see how demand for imports are significantly higher compared to the pre-pandemic period.
Ultimately what this means is: if there is no break in the import volumes by the 2021 holiday period and into early 2022, it is unlikely that there will be any relief next year.
To get a better sense of where we are today, we will begin with “normal” times – the four years preceding the COVID-19 pandemic.
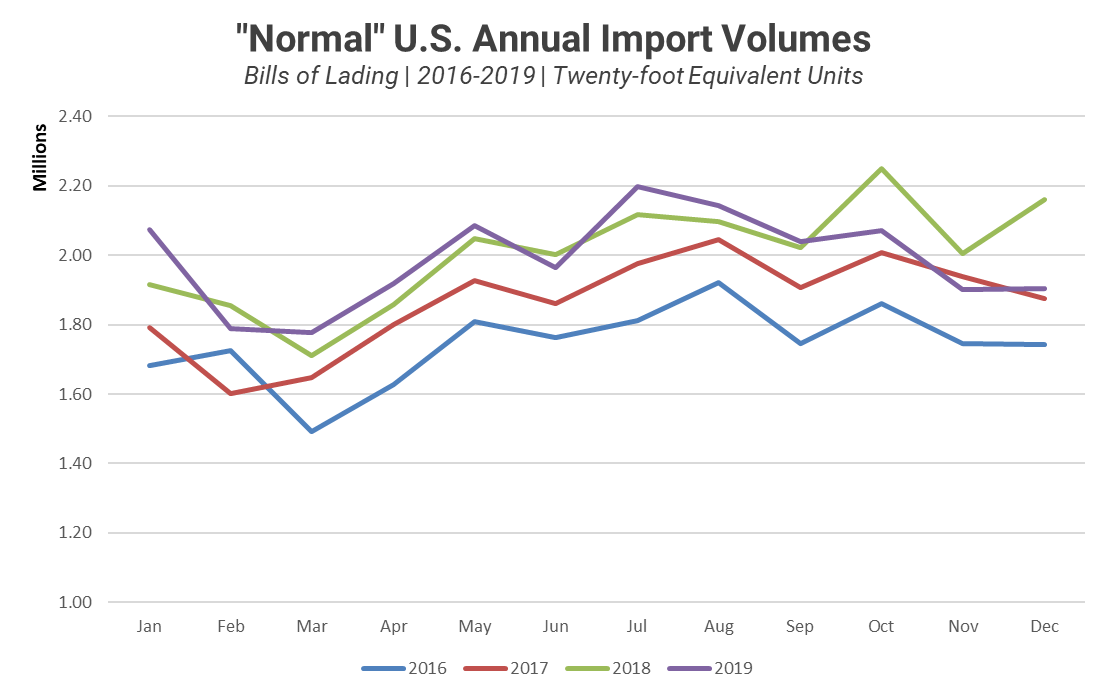
Figure 1: 2016-2019 Shipping Volumes Source: Descartes Datamyne
Pre-pandemic shipping displays a pretty consistent pattern – a slow start to the year and increasing shipment volume as the peak season approaches and then a slight wind down in November and December. The decline at the end of the year and beginning of the next one is key to determining that ocean-based logistics capacity supply and demand are back in balance. The only exception to this pattern was the end of 2018 and beginning of 2019 when there was forward buying in advance of tariffs going into effect in 2019.
Get the Essential Guide to Supply Chain Resiliency
As carriers and ports work through the global shipping crisis and the subsequent backlog, now is the time for you to invest in your supply chain resiliency.
Our essential guide has been developed to help you mitigate risks and protect your business from costly disruptions.
The pandemic years shipping volumes look completely different.
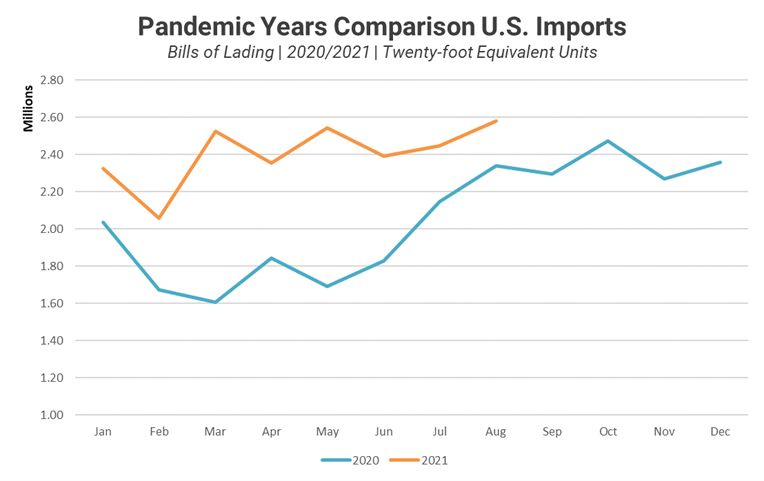
Figure 2: Pandemic Years Comparison U.S. Import (TEUs) Source: Descartes Datamyne
The start to 2020 was similar to previous years in that it declined but was lower in the first half of the year as China and other Asian countries shut down to slow the spread of COVID-19 and then the United States entered its own quarantine period. However, in the second half of 2020, imports surged – fully recovering and showing no signs of slowing as the end of the year approached. The volumes in 2021 remained throughout January and, with a slight dip in February (that was still significantly higher than the same time in 2020) has continued to be quite strong though August.
How do the pandemic years compare with “normal” years?
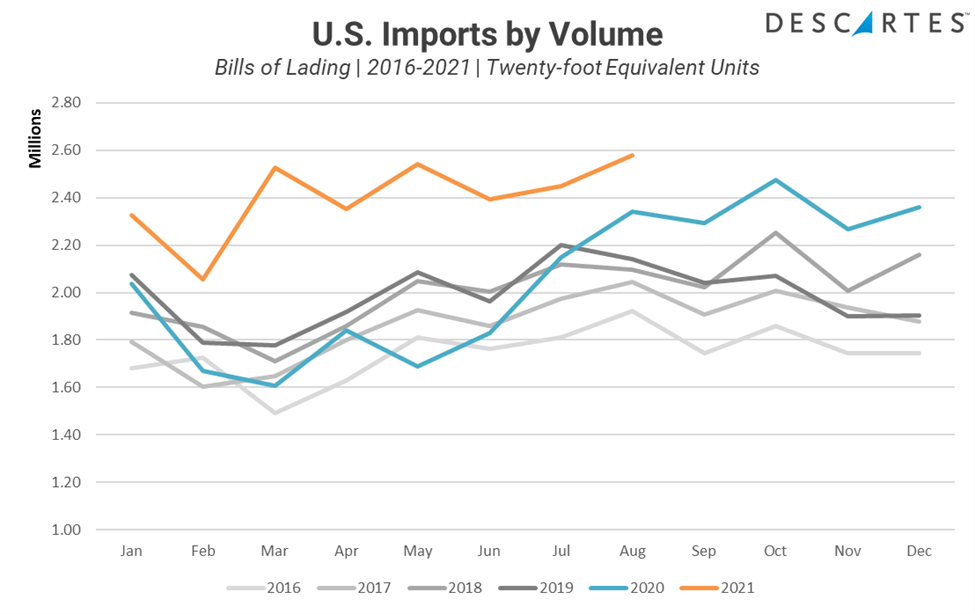
Figure 3: Last 6 Years Comparison U.S. Import (TEUs) Source: Descartes Datamyne
When comparing the pre-pandemic and pandemic periods, it’s clear that once the economy stabilized in mid-2020, the second half of 2020 eclipsed the pre-pandemic period and has continued surging throughout 2021. Much of this increase in demand can be ascribed to consumers buying durable goods such as furniture, exercise equipment, electronics as well as the backlog of goods in Asia that began earlier in the pandemic.
What does the future bring for global shipping?
Conversations with industry experts and carriers has confirmed that their businesses were operating at full capacity and that there should be no expectations for a decline in shipping demand from their customers through the rest of 2021 and well into 2022. The current feeling is that capacity is not able to meet demand, resulting in containers stacked in Asia and increased container “rolling” rates. In addition, U.S. West Coast ports continue to experience congestion with many ships waiting for a berth.
Understanding these points, 2021 TEU volume throughout the rest of the year should hover between 2.4M and 2.6M TEUs monthly and will likely continue through 2022. Assuming there is no softness, the peak season in the second half of 2022 will drown out any decline we might see until November and December of 2022.
Ultimately, Importers should view the situation as more than a short-term problem. Importers should:
- Plan to shift their movement of goods to less congested lanes
- Evaluate product mix to only focus on their high velocity SKUs for the limited transportation capacity available
- Determine the viability of potentially late shipments for short peak seasons, like Halloween, where missing by as much as a month could result in goods that will miss their sell season
How Descartes Datamyne Can Help
Descartes Datamyne delivers business intelligence with comprehensive, accurate, up-to-date, import and export information.
Our multinational trade data assets can be used to trace global supply chains and our bills-of-lading trade data – with cross-references to company profiles and customs information – can help businesses identify and qualify new sources. Ask us for a free, no obligation demonstration of our data on a product or trade commodity of your choosing – and keep the custom research we create with our compliments.