


Top importing and exporting countries in the semiconductor supply chain network are rolling out incentives to make more chips at home, while tightening controls on sharing chip technologies abroad. Descartes Datamyne trade data helps clarify what’s at stake and who stands to win or lose as a new global market dynamic takes shape.
Alarmed by pandemic-era shortages of integrated circuits, the U.S. is pursuing an industrial policy, that includes the CHIPS and Science Act, aimed at reshoring semiconductor manufacturing. The U.S. is also curbing offshore Integrated Circuit (IC) tech transfers with strict export controls on chips and chip-making machines and constraints on investments in semiconductors, microelectronics, quantum information, and artificial intelligence sectors abroad. These restrictions are primarily directed at China, whose own industrial policies are aimed at achieving global leadership in semiconductor design and production by 2030.
Key Takeaways
- There is a global push towards reshoring semiconductor supply chains.
- The effort is spurred by severe pandemic-era semiconductor supply disruptions and national security interests.
- America’s share of global semiconductor manufacturing capacity declined from 56% in 2013 to 43% in 2021.
- The semiconductor industry is truly global with no one country dominating.
- Descartes Datamyne’s trade data can peer into global semiconductor supply chains to unlock trends, and identify suppliers, end users and intermediaries.
The U.S. and China are not alone in implementing government policies to nurture homegrown “ecosystems” for developing, making, and reliably supplying semiconductors. The EU launched its first initiative to grow its share of global chip manufacturing in 2013. On July 25 of this year, the Council of the EU approved Chips Act, Europe’s version of the U.S. CHIPS and Science Act. As the U.S. Semiconductor Industry Association (SIA) points out, all the countries gaining a share of global chip manufacturing capacity in recent years have been helped along by their governments’ incentives.
The SIA data would seem to indicate that America’s leadership position in semiconductors has been eroded – and, to the extent that we’re talking about fabricating chips, that may be true. (See Figure 1) The U.S. CHIPS act is meant to reverse this trend.
Figure 1: Share of Global Semiconductor Manufacturing Capacity
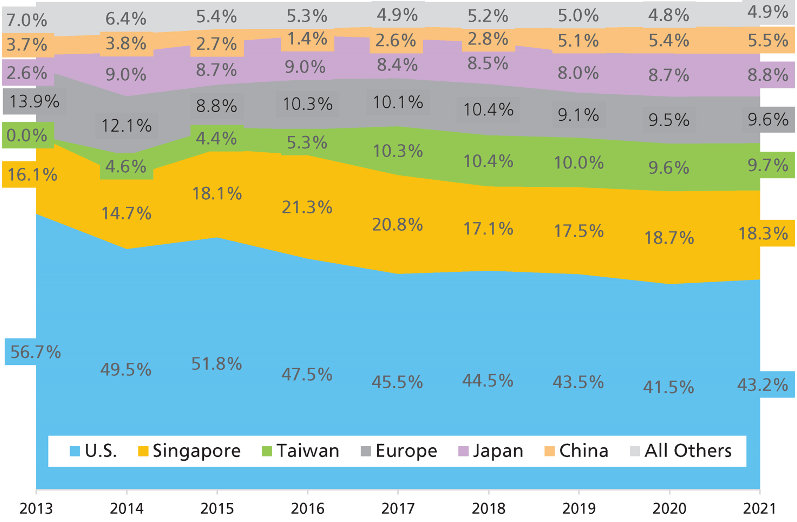
Source: Semiconductor Industry Association (SIA) 2022 Factbook
But, as the Wall Street Journal reports, the U.S. dominates some of the most critical parts of the supply chain starting with R&D: U.S. chip design software makers command 74%, and U.S. logic chip designers 67% of the global market. Looking to a future of quantum computing and artificial intelligence, the U.S. sees maintaining this advantage – and foiling attempts to use its chip technologies for military purposes – as critical to its national security.
What trade data reveals about the U.S. semiconductor supply chain and industry
Descartes Datamyne import-export trade data confirms U.S. leadership in innovating chip technologies. (See Figure 2). Of course, this data captures transactions in merchandise, not intellectual property. But data on the products bought and sold at each stage of the chips value chain yields are indicators of the country’s reliance on imports for raw materials and input components, and its defining role in advancing (and exporting) semiconductor technologies.
Figure 2: Semiconductor-related Merchandise Trade
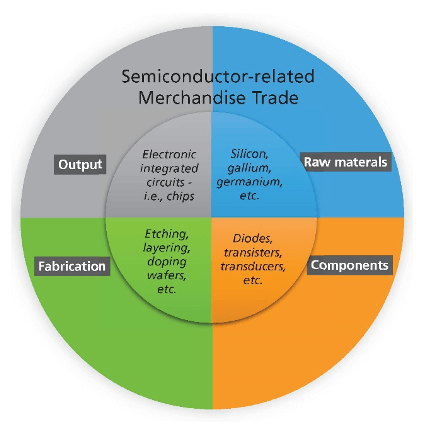
Source: Descartes Datamyne
Starting at the raw materials stage, for example, Descartes Datamyne U.S. Census data shows the U.S. is a net importer of gallium [HS 8112.92.10], the second most often-used raw material for making semiconductor wafers. (See Figure 3).
Figure 3: U.S. Trade in Gallium in 2022 (HS 8112.92.10)
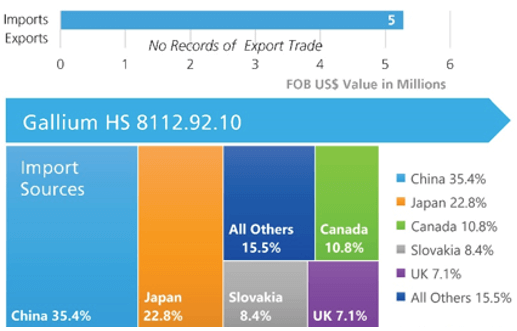
Source: Descartes Datamyne
(Note: Silicon is the most widely used, and germanium is a promising alternative to these semiconductive metals for applications other than solar cells.)
The U.S. Geological Survey reports that China – the source for over a third of U.S. imports of gallium in 2022 and confirmed by Descartes Datamyne global trade data – accounted for 98% of worldwide primary low-purity gallium production last year. In the face of China’s dominance, some producers, including South Korea and Germany, have ceased production – though Germany has announced it will restart.
In response to the U.S. export controls imposed last October, China announced its own restrictions on exports of gallium and germanium to the U.S. and Europe this July.
It’s too soon to gauge the impact of China’s latest move on related trade in gallium arsenide wafers [HS 3818.00.0010]. As the next chart indicates (see Figure 4), the U.S. relies on Taiwan for slightly more than half of the substrates upon which ICs are built. Taiwan, home to the world’s largest contract chipmaker, is reported (by Reuters) to be confident that its supplies of gallium – sourced primarily from Germany and Japan – will not be affected by China’s export restrictions. They may, however, be pricier as the global market anticipates shortages in the metal.
Figure 4: U.S. Trade in Gallium Arsenide Wafers in 2022 (HS 3818.00.00.10)
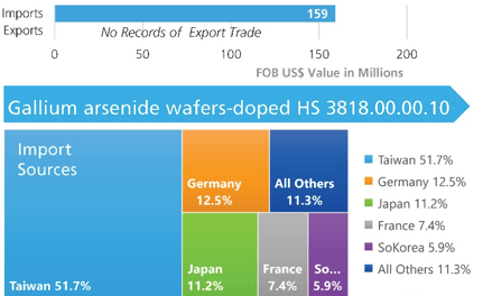
Source: Descartes Datamyne
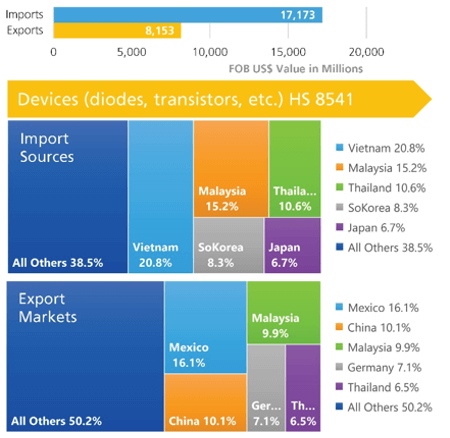
The U.S. is a net importer of the devices that go into making ICs, such as diodes, transistors, and transducers, [HS 8541]. Sources for these components, mainly in Asia, are more diversified. (See Figure 5).
At 20.8%, Vietnam was the top source of devices used in U.S. semiconductor production in 2022. As recently as 2014, however, our global trade data reveals, Vietnam’s share of this trade was a fraction of a percentage point, while China accounted for 31.3%. By last year, China’s share had dwindled to 5.8%.
Figure 5: U.S. Trade in Component Devices Used in Semiconductors in 2022 (HS 8541)
Source: Descartes Datamyne
Semiconductors and machines for making them: proxies for IP trade
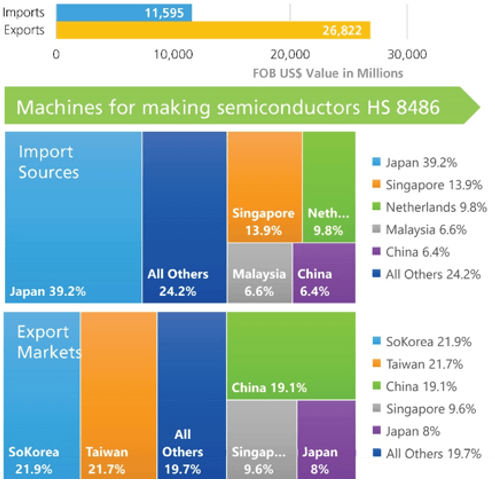
Next up the value chain are the machines for making semiconductors [HS 8486]. These products are the medium for transferring the design and processing technologies that come out of R&D to the fabricators and foundries that produce and assemble the chips. The U.S. is a net exporter of these machines, with a bit more than 60% destined for the top three markets: South Korea, Taiwan, and China. (See Figure 6).
Figure 6: U.S. Trade in Machines for Making Semiconductors in 2022 (HS 8486)
Source: Descartes Datamyne
Given the new restrictions on U.S. exports of these products to China, as well as the curbs on U.S. companies investing in Chinese facilities, we might expect that country’s prominence among U.S. equipment markets to fade in the near future. One of the top sources for U.S. machine imports, the Netherlands has also imposed restrictions on its most advanced microchip technology exports. Japan has announced plans to ban exports of chips for military applications.
Global trade data ranks the U.S. second by value of trade, just behind Japan, and ahead of the Netherlands, among global suppliers of chipmaking equipment. China is far and away the top import market. (See Figure 7).
Figure 7: Global Trade in Machines for Making Semiconductors in 2022 (HS 8486)
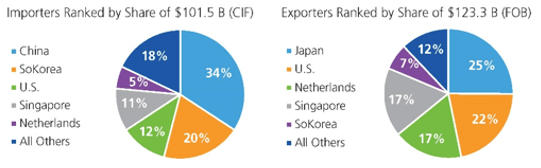
Source: UN Comtrade Database
Descartes Datamyne Census trade data can also provide a break-out of U.S. chips equipment exports at the 6-digit HS code level. (See Figure 8).
Figure 8: U.S. Exports of Machines for Manufacturing Semiconductors in 2022
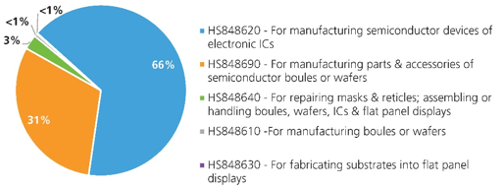
Source: Descartes Datamyne
The U.S. is also a net exporter of the finished products – the semiconductors or ICs [HS 8542]. The trade imbalance is not so pronounced as it is for the equipment to make chips. (See Figure 9).
Figure 9: U.S. Trade in Semiconductors & Integrated Circuits in 2022 (HS 8542)
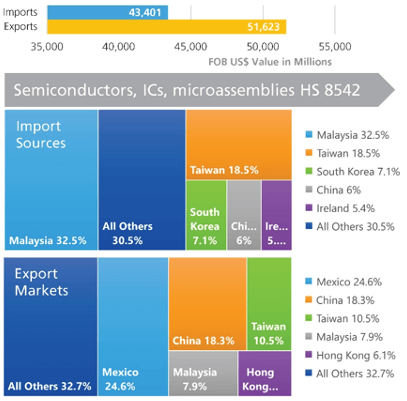
Source: Descartes Datamyne
Malaysia has been the top source for U.S. chips imports since 2013 and was the country of origin for just over 46% of U.S. chips imports in pandemic years 2020-21. Note that China and Hong Kong together accounted for 24.4% of U.S. chips exports in 2022, 27% in 2020-21. (The Special Administrative Regions of Hong Kong and Macau are listed by the U.S. as “countries of concern” regarding the new restrictions as well as China).
Semiconductor supply chain reshoring easier said than done
As the Descartes Datamyne global trade data makes clear, the semiconductor industry is truly global; no one country does it all. Tracing the semiconductor supply chain – perhaps more appropriately called a supply network – involves tracking commodities, inputs, and products as the shuttle back and forth around the world.
The supply chain disruptions of 2020 that triggered a new era of government industrial policy – especially, but not only in the U.S. – prompted Harvard Business School researchers to attempt mapping semiconductor supply chains. They worked with data from five chipmakers and seven automakers, covering the years from 2003 through 2017. They found an average of 90.5 intermediary firms between source and end-user in each year. These were not the same intermediaries (only 14 intermediary firms were active in every one of the years), nor were they linked in the same in the same sequences (there were on average 7.9 “shortest paths” to choose from each year). Large numbers of links shut down and new links opened every year. All told, the researchers tallied 416 intermediaries, 11,533 links, and 3,589 source-destination links within the network over the study period.
Competing national industrial policies and trade tensions aside, the sheer complexity and deep-rootedness of existing global interdependencies make any move to reshore semiconductor supply chains easier said than done.
How Descartes Datamyne can help
Descartes Datamyne data can help shed light on the global semiconductor-related supply chain by putting names to those linkages when they cross borders. We can mine the information in the transaction records in our international databases to identify the company sources, end-users and intermediaries on the buy- and sell-side of trade in products at each stage of the value chain. (see also Supply Chain Relationship Tracing).
For example, using our Global Trade Data we were able to find 71,034 buyers and 114,118 sellers in the HS codes covered in the data charts above. (See Figure 10 for the tally by HS code).
Figure 10: Number of Companies Identified in Semiconductor-Related Trade in 2022
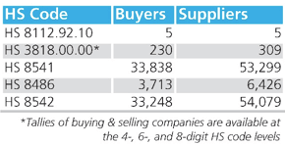
Source: Descartes Datamyne
Depending on the underlying data source, additional information is available on each company – including the specifics of individual transaction records, such as the company’s trading partners; the weight, quantity, and value of shipments (useful for calculating per unit prices); and logistical details. For example, data sourced from India export declarations covers 32 fields of information.
Census data for the first half of 2023 is already capturing big shifts in the global semiconductor market – U.S. exports of chipmaking equipment have declined 24% in value overall compared with the same period a year ago. Interestingly, while U.S. exports to Asia have ebbed, exports to European trading partners have increased.
In 2020, the SIA published a paper on how WTO trade rules helped open access to global markets and so spurred semiconductor growth and innovation. In December 2022, China filed a WTO dispute complaint regarding the U.S. and its semiconductor export controls, but this will take years to resolve. For now, it seems certain that a new and different era in global semiconductor trade has begun. Keep tracking global trade data to see what happens next.
Global trade data for building supply chain resilience
Descartes Datamyne delivers global trade data and intelligence with comprehensive, accurate, up-to-date, import and export information that helps companies save significant time in spotting supply and demand shifts, optimizing trade lanes, expanding into new markets and identifying new buyers and suppliers.
Datamyne features the world’s largest searchable trade database covering 230 markets across five continents. Gathered directly from official filings with customs agencies and trade ministries, including bills of lading, our data is detailed (down to company names and contact details), timely and authoritative.
Descartes software solutions include a landed cost tool to calculate the economic viability of importing from a range of markets. Our applications can also screen against multiple denied parties lists simultaneously to help ensure organizations are not doing business with entities named on official government watch lists.
Also check out how to Build Supply Chain Resilience.