


A surge in transpacific imports of articles of plastics lifted inbound volumes at U.S. ports in 2025, Descartes Datamyne™ trade data shows. The weight of U.S. tariffs on trade forced realignment of supply chains for things made of plastic, plastic materials, and plastic-making machines and molds.
Key Takeaways
- Plastics became the top U.S. import category in 2025, overtaking furniture
- Tariffs disrupted traditional trade patterns, triggering front-loading, sharp mid-year declines, and uneven recovery across product categories.
- Supply chains realigned away from China, with countries like Vietnam and Mexico gaining share
- Tariff impacts varied widely by product, with plastics facing moderate duties compared to heavily targeted goods like upholstered furniture.
- Overall plastics trade weakened in 2025, with declines in imports of plastic goods, resins, and materials, alongside reduced export performance.
- PET tariffs highlighted policy volatility, causing sudden trade disruptions and exposing uncertainty around future enforcement and legal challenges.
- Investment in plastics manufacturing continued, as imports of machinery and molds grew modestly despite tariff pressures.
- Tariff complexity is increasing business risk, making tools like Tariff Insights essential for managing costs, sourcing decisions, and supply chain strategy.
In 2025, articles of plastic [HS392690] were the top U.S. waterborne import by volume in twenty-foot equivalent units (TEUs), eclipsing wood frame, upholstered seats [HS940161], the previous leader. Plastic articles were among the top five imports at each of the 10 busiest ports and accounted for the leading share of inbound TEUs at Los Angeles, Long Beach, and Houston.
Over the last decade, wooden furniture of one sort or another has accounted for the biggest share of U.S. container shipments (if not seats, then wooden furniture, others – HS940360 – a category covering bentwood furniture, play yards for children and dining tables). The last time inbound shipments of plastic articles topped furniture was in 2023, when the U.S. imposed Section 232 tariffs on wood furniture to protect domestic industry and lessen reliance on imports. Last year’s tariff increases had a more pronounced effect on the flow of imports.
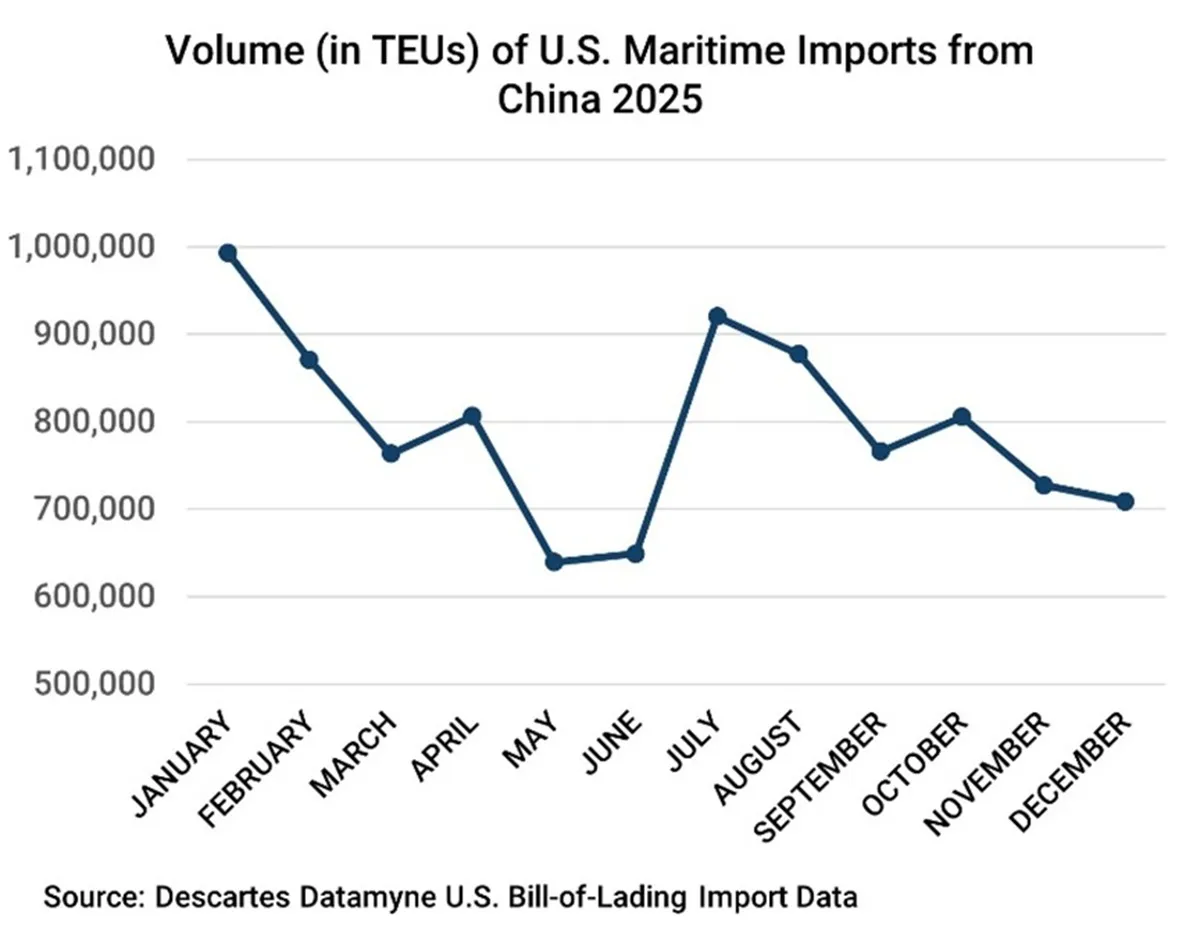
Front-loading shipments ahead of impending U.S. tariffs lifted TEUs from China to an early peak (compared with previous years’ shipping summits) in January (see Figure 1). Successive tariff hikes culminating in an effective rate of 145% in May throttled shipments in May and June. Imports surged in July as the U.S. and China called a truce on certain tariffs. As backed-up orders cleared, volumes tailed off in the second half. Compare this trend line to the rise and fall of wood frame, upholstered seats in the next chart:
Figure 1 U.S. Waterborne Imports from China Month by Month in 2025
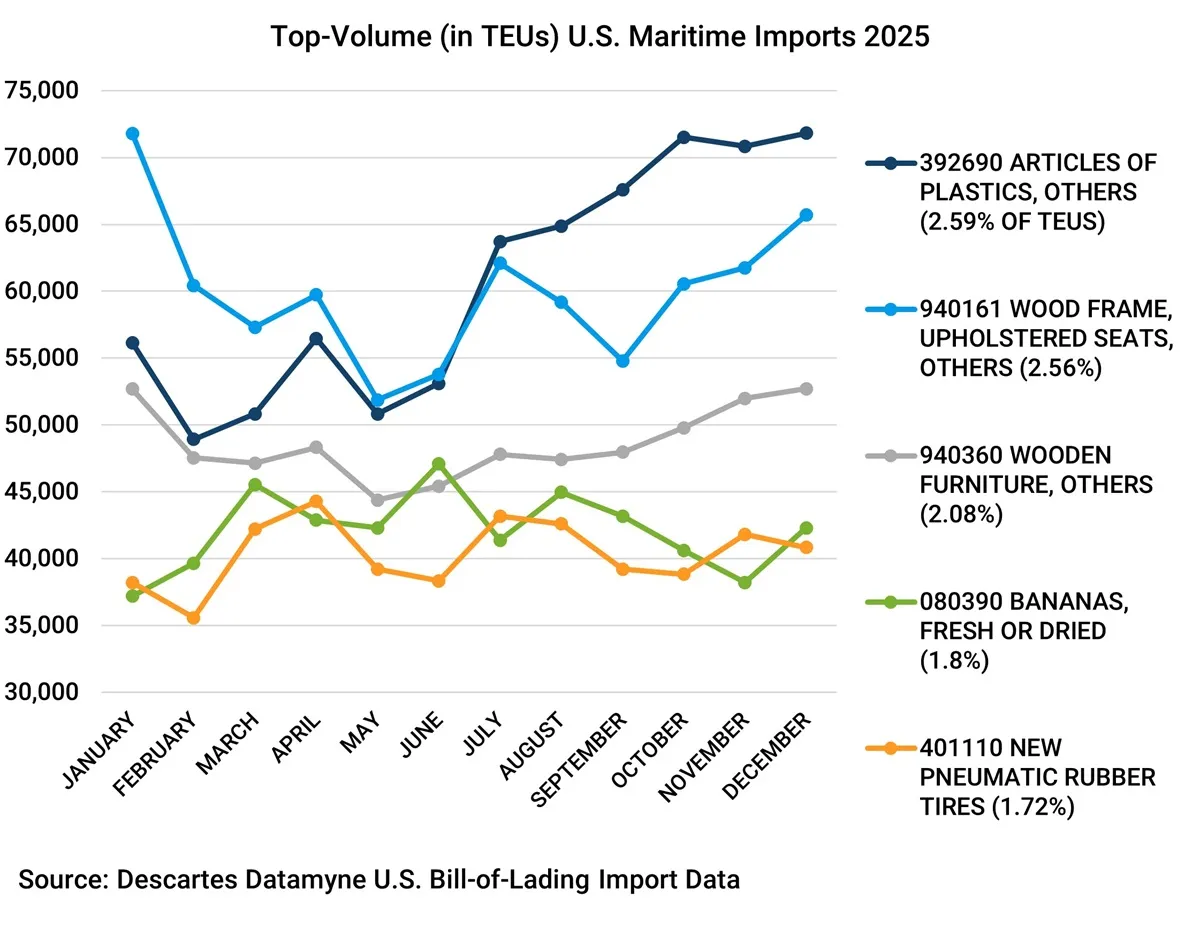
Upholstered seats hit peak volume (71,803 TEUs) in January 2025 (see Figure 2). Both plastic articles and upholstered seats took the same dive in May and bounced back in July. They parted company in August, with plastics continuing upward and seats headed down. Plastic articles peaked at 71,816 TEUs in December. Seats bumped up again in October with another round of front-loading ahead of new tariff hikes on October 14 and January 1, 2026. [Note that the January 1 increases have been postponed to January 1, 2027, while negotiations with trade partners continue.]
Figure 2 Top 5 U.S. Maritime Imports by Volume in 2025
U.S. Trade Partners Realign
Not only have U.S. tariffs changed the pace of trade, but they have realigned supply chain partners. Using Tariff Insights from Descartes Datamyne, we compared tariffs for high-volume imports upholstered seats and plastic articles (see Figure 3).
Figure 3 Tariff Insights Duty Comparison for Wood Frame, Upholstered Seats [HS940161]
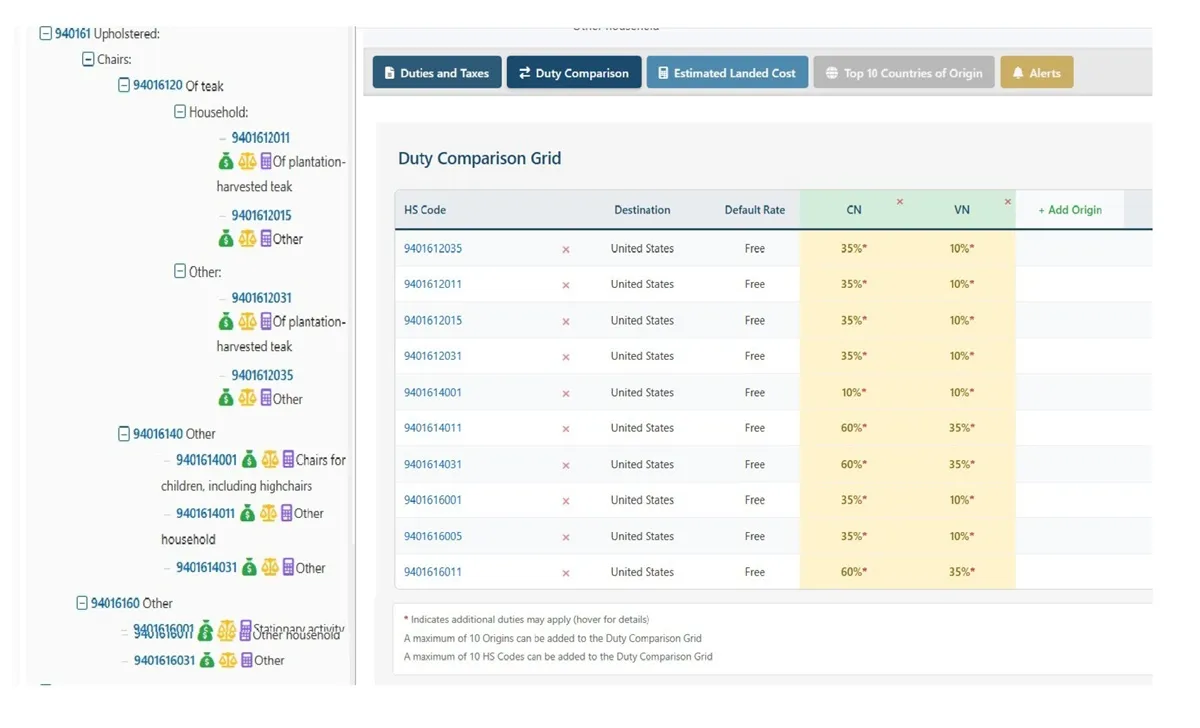
Source: Tariff Insights from Descartes Datamyne.
Duties are applied at the 10-digit level of the U.S. tariff code; the seven codes listed here together account for 99.5% of the value of these imports from all sources, according to Descartes Datamyne U.S. Census data. In addition to comparing duties on imports from as many as 10 countries at a time, Trade Insights in Descartes Datamyne can list all duties and taxes applicable to a code. There is also a landed cost estimator that enables users to factor in the shipping details (tariffs and duties, cost of goods, insurance, freight) and calculate the total cost of a shipment. *Note that the asterisks indicate duties applied to the product specific rates: for China, the add-on is 25%; for other trading partners, factor in a reciprocal tariff of 10%.
There have been U.S. tariffs on wood furniture from China since 2018; however, there had been exemptions for some upholstered seats. The carve-outs ended with the tariff increases of 2025. Meanwhile, Vietnamese furniture enjoyed the duty-free default rate until the imposition of Section 232 tariffs in October 2025. Vietnam’s price advantage has worked over the years to shift the center of this trade. In 2020, China was the source for more than half (52%) of these imports, while Vietnam accounted for 36%. In 2025, China’s share had declined to 33%, while Vietnam claimed 54%.
Imports of Things Made from Plastics in Flux
Compare these rates with the Tariff Insights Duty Comparison Grid for HS39269099, the 8-digit code accounting for 78% of these imports by value in 2025 (see Figure 4).
Figure 4 Trade Insights Duty Comparison for Articles of Plastic, Others [HS39269099]
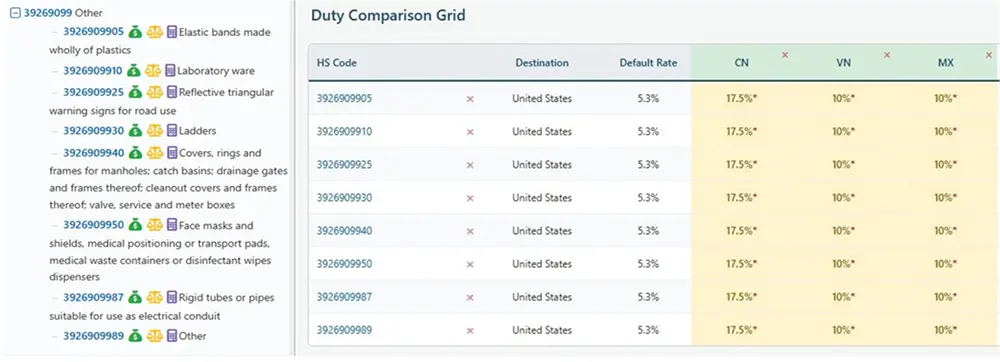
Source: Tariff Insights from Descartes Datamyne.
In comparison to wood seats, U.S. tariff rates on plastic articles have been moderate. There have been and continue to be carve-outs for some products. While Vietnam enjoys a rate advantage over China, it has not been as large as with upholstered seats. Chinese goods were subject to a 17.5% tariff base rate in 2025, while every other potential source’s starting rate was set at 10%. Yet Chinese plastic goods continued to dominate the ocean-going trade. Bill-of-lading data indicates China’s share of maritime trade edged up from 62% of total TEUs in 2020 to 63% in 2025, while Vietnam share increased from 3% to 5%.
U.S. Census data indicates that the tariffs took their toll on the value of China’s exports—with China ceding share to the U.S.’s North American trading partners. (This overland trade is not captured by maritime bill-of-lading data.) Census data shows China’s share of these U.S. imports overall falling 10.66% from 2020 to 2025, with the biggest gainer being Mexico, increasing 78.44%.
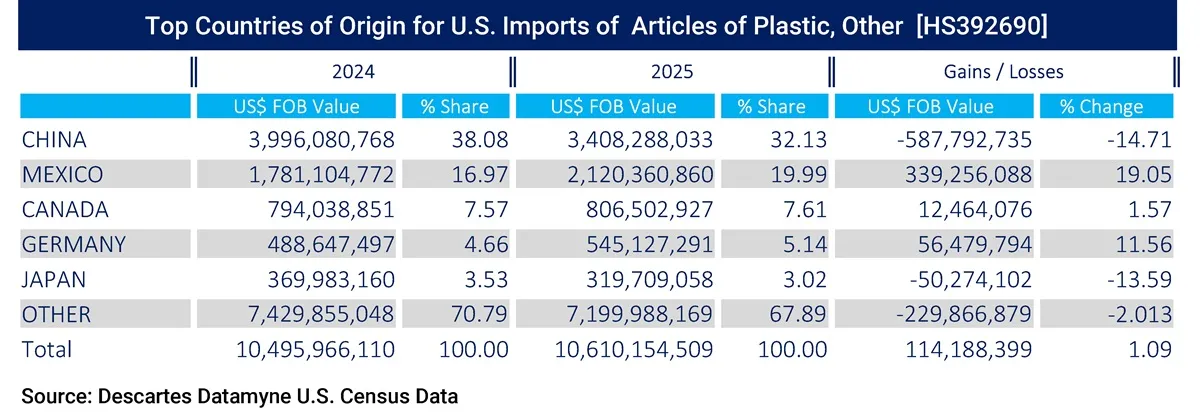
U.S. Census data also shows that trade in plastic articles posted year-over-year growth of 2.97% in the first half of 2025. Industry watchers saw early import gains as an indication of the plastic industry’s resilience. The trend reversed in the second half of 2025, with imports declining 0.97% compared with 2024’s modest growth of 1.09% for the year (see Figure 5).
Figure 5 Top 5 Countries of Origin for Articles of Plastic, Other [HS392690]
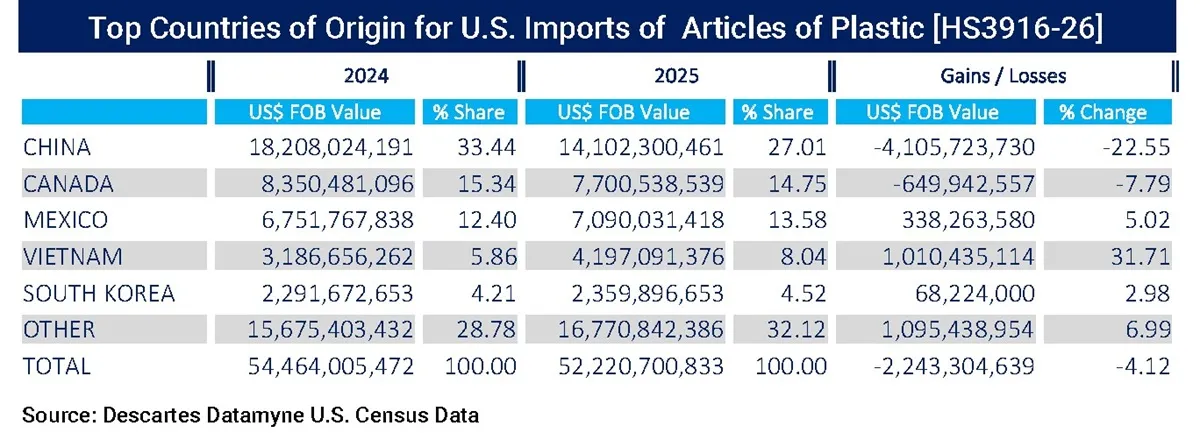
Articles of plastic, others [HS392690] accounted for 15% of all imports in the general class of all things made of plastics [denoted by codes HS3916 through HS3926]. The Descartes Datamyne Census data on this class of goods indicates a year-long decline in imports that started slowly with a y-o-y 1.04% decline in 1H25 and gained momentum in the second half with a drop of 7.11%. A sizable advance of 31.71% in imports from Vietnam was not enough to counter the 22.55% fall-off in Chinese imports, and these imports closed the year 4.12% behind 2024 (see Figure 6).
Figure 6 Top 5 Countries of Origin for Articles of Plastic [HS3916 through HS3926]
Ripple Effects on Plastics Materials Imports and Exports
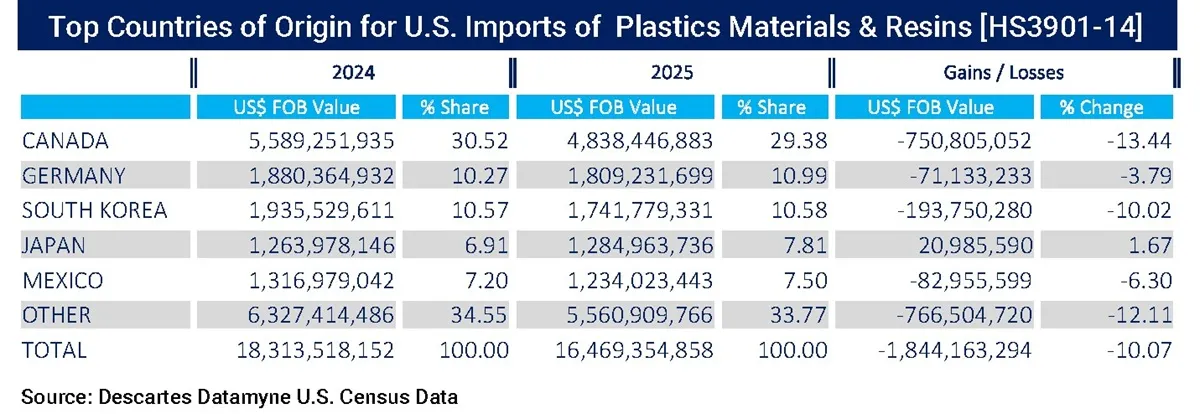
Another critical category of the industry’s trade, the resins and materials used to make plastics [HS3901 through HS3914], also saw a decline in imports in 2025, down 10.07% y-o-y (see Figure 7), with a decrease in shipments from four out of five of the top sources.
Figure 7 Top 5 Countries of Origin for Imports of Plastics Materials & Resins [HS3901 through HS3914]
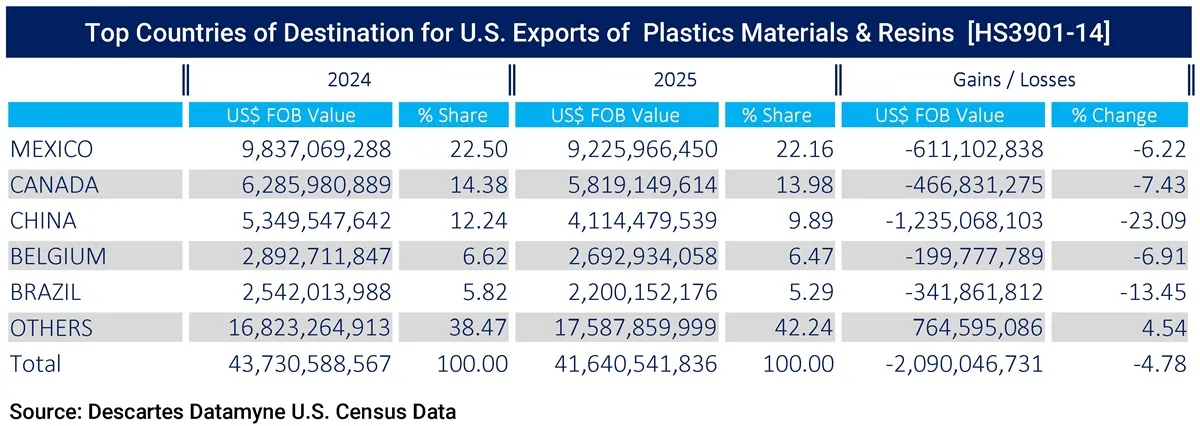
While the U.S. is a net importer of articles of plastic, machines for working plastics and plastics injection and compression molds, it is a net exporter of the materials and resins from which plastics are made, thanks in large part to the shale revolution. As Census data shows, outbound trade in these commodities faltered in 2025 (see Figure 8).
Figure 8 Top 5 Country Markets for Exports of Plastics Materials and Resins [HS3901 through HS3914]
U.S. tariffs and trade partners’ counter tariffs have depressed trade in both directions, to be sure. But over-capacity and the price-slashing glut of some plastics is also roiling global markets.
Case in Point: U.S. Tariffs on PET
A good example of how a tangle of government policies can impact trade is polyethylene terephthalate (PET) used in making plastic bottles, food containers and textile fibers, as well as for industrial applications. It comes in a virgin and recycled (rPET) version, although the tariff codes do not distinguish between virgin PET and rPET. HS390761 denotes PET with a viscosity of at least 78 milliliters per gram; HS390769 covers PET with less than 78 ml/g.
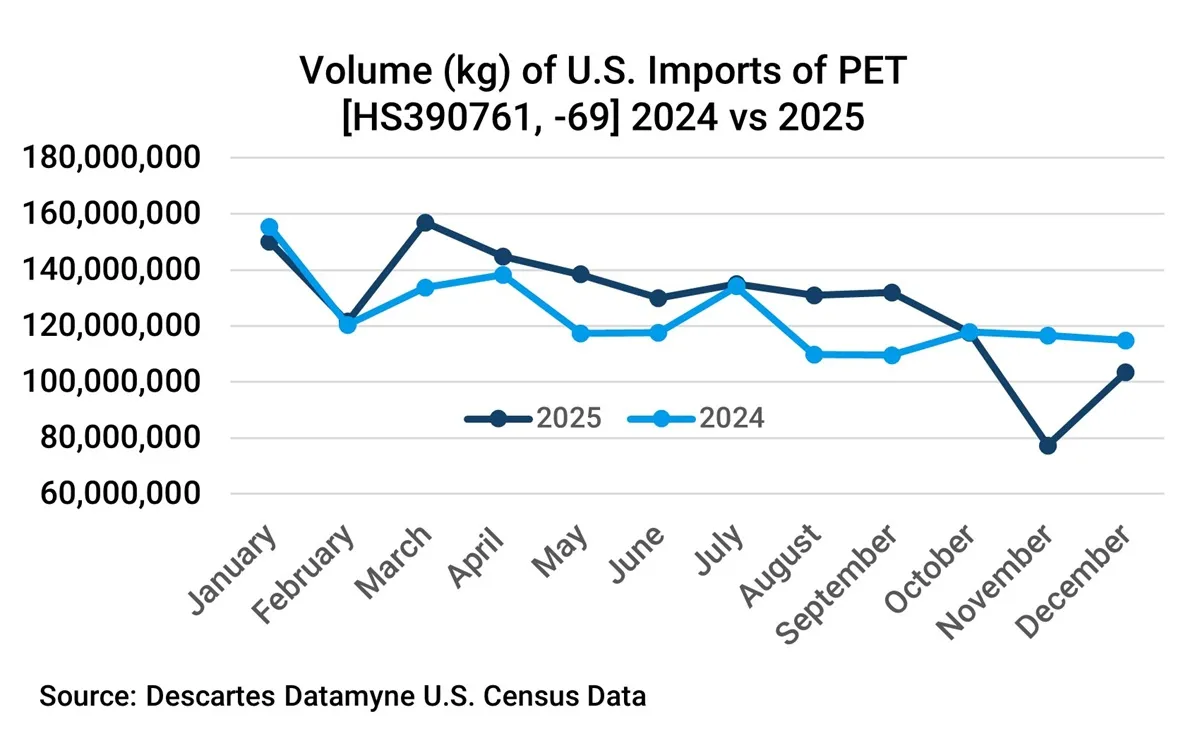
In the interest of sustainability, many governments, including in North America and in the EU, have mandated varying levels of recycled content in plastic products, ensuring demand. For more than a decade, the dumping of low-cost PET has challenged domestic producers’ ability to meet that demand. In recent years, virgin PET has been cheaper than rPET, undercutting the output of U.S. recycling operations in the market and the postponing the day when recycling efforts are self-sustaining. Trade data shows PET import volumes in 2025 running at or above 2024 levels until October (see Figure 9).
Figure 9 Volume of U.S. Imports of Polyethylene Terephthalate (PET) 2024 vs. 2025
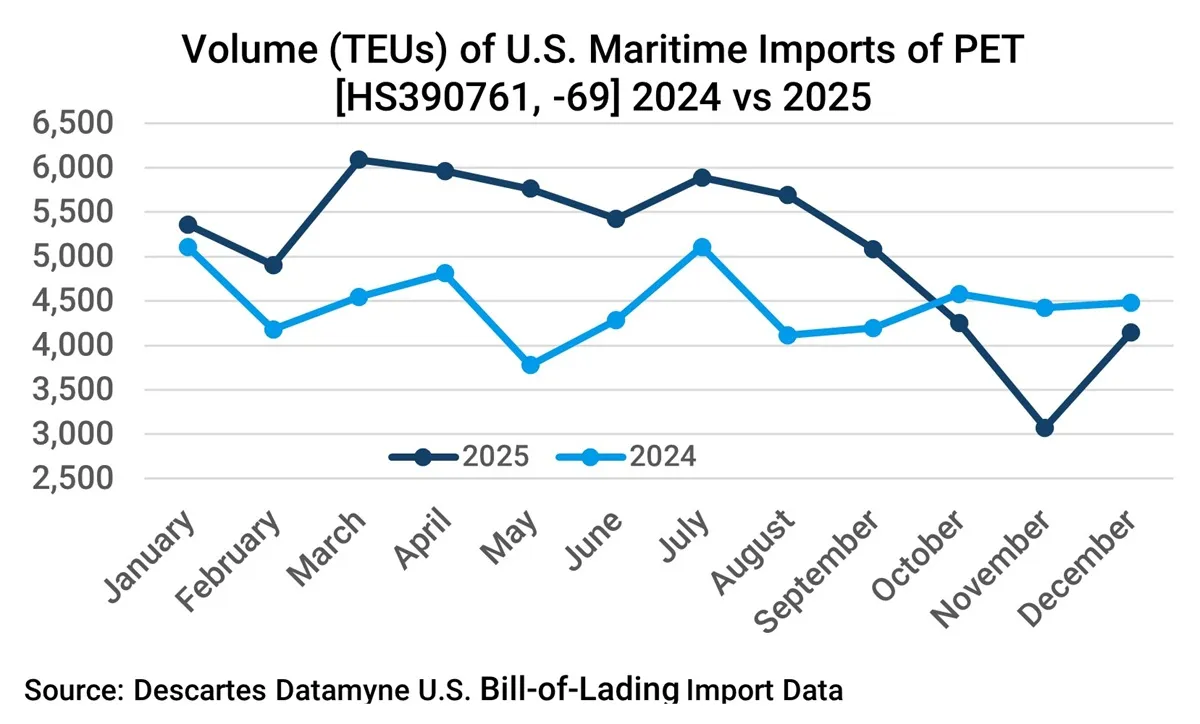
Census data and the bill-of-lading data capture different views of PET import data. USMCA (United States-Mexico-Canada Agreement) partners Canada and Mexico together are the source for just under a quarter of U.S. PET import volumes, most of it shipped overland. The bill-of-lading data gives a better picture of imports originating outside North America (see Figure 10): 65% of this trade came from East, Southeast or South Asia in 2025.
Figure 10 Volume of U.S. Maritime Imports of Polyethylene Terephthalate (PET) 2024 vs. 2025
The Census data on the US$ value of imports shows 2025 shipments lagging behind 2024 (see Figure 11). But, as the volume data makes clear, this is a function of lower prices not lower shipments.
Figure 11 Value of U.S. Imports of Polyethylene Terephthalate (PET) 2024 vs. 2025
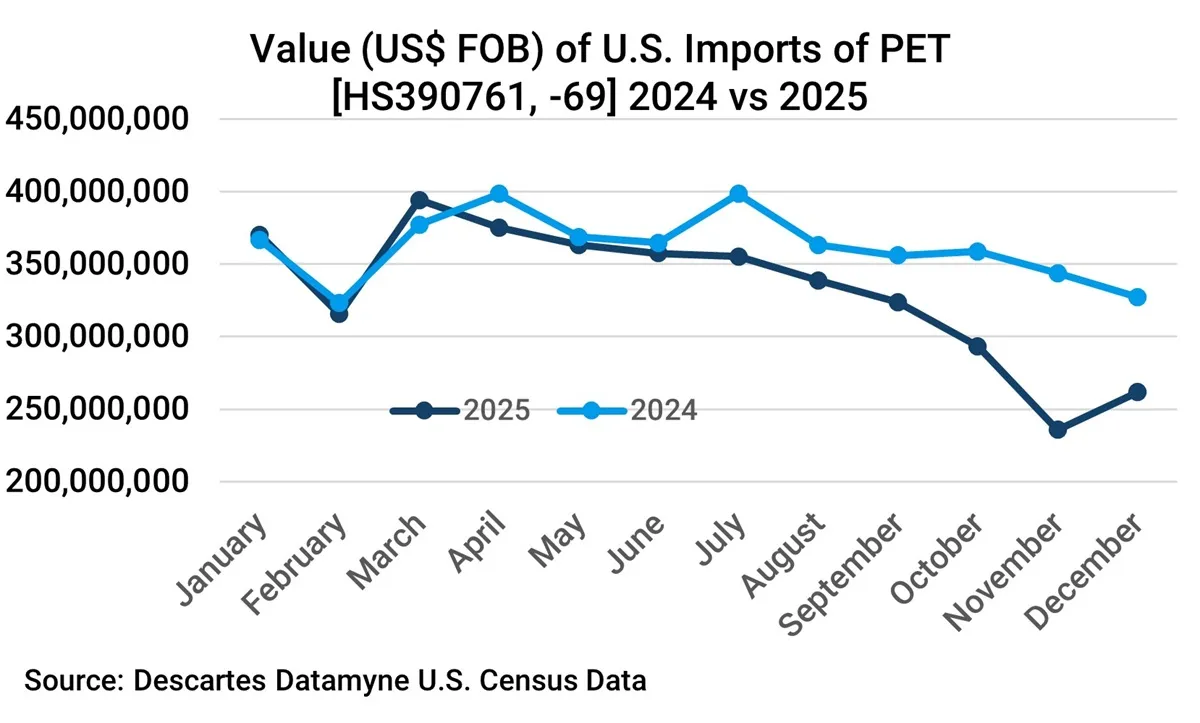
The abrupt drop in the third quarter is a direct result of new tariffs on PET, announced September 5 and effective three days later. PET imports had been on the list of products exempt from reciprocal tariffs. The volume trendlines in the data charts may look like the now-familiar pattern of front-loading shipments ahead of impending tariffs but, by all accounts, countries, including Thailand, Indonesia and India, that had been shipping PET to the U.S. duty free were taken by surprise.
The new tariffs were intended to raise the price of PET imports, leveling the playing field for domestic supplies. Whether these reciprocal tariffs reshape this market as intended remains to be seen. Confounding any strategizing by business decision-makers is whether these tariffs, declared unconstitutional by the Supreme Court in the new year, will be dropped or superseded by tariffs under different executive authority or trade agreements.
Tariffs’ Uneven Application Produces Mixed Results
Surveying the Census data available as of last August (recall that Census trade data releases were delayed during a government shut-down), Perc Pineda, PhD, chief economist at the Plastics Industry Association, found the tariff impacts on plastics “uneven, highly product-specific, and deeply influenced by evolving bilateral negotiations.”
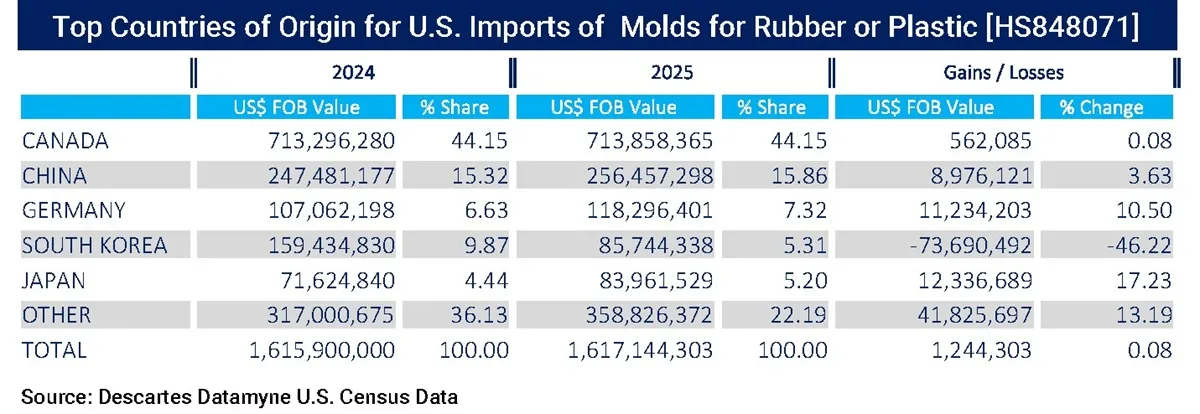
Pineda offered a positive view on the data for imports of machinery for working plastics [HS8477] (see Figure 12) machinery and injection and compress molds for plastic products [HS848071] (see Figure 13), which had increased by 5.3% and 7.1%, respectively. The demand for machinery and molds suggested, he said, that U.S. manufacturers were investing in production capabilities.
In addition to reciprocal U.S. tariffs, plastics machinery imports were subject to new Section 301 tariffs in 2025. Imports of molds were hit with increases in Section 232 tariffs on steel and aluminum derivative products. Under the weight of tariffs, these imports slowed after the first half. Nonetheless, imports of both product categories ended the year with positive, albeit modest y-o-y growth.
Figure 12 Top Countries of Origin for Machinery for Working Plastic [HS8477]
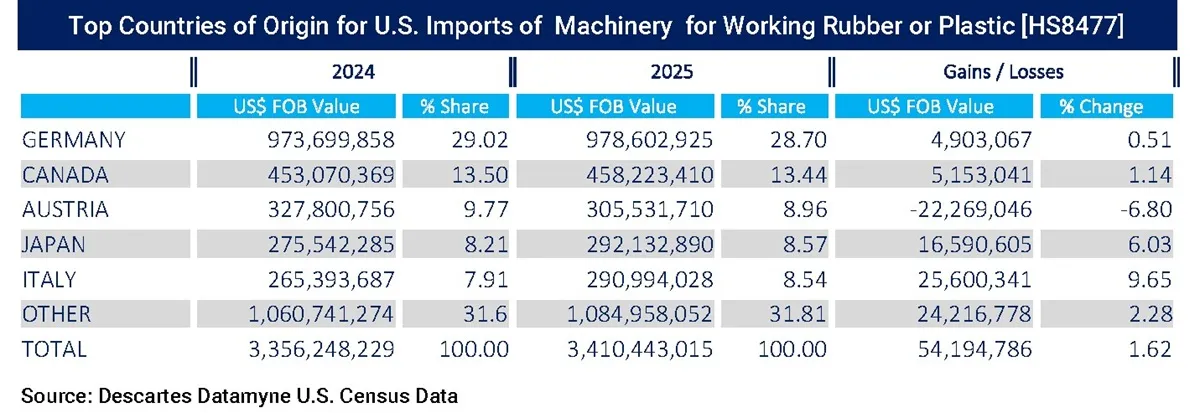
Figure 13 Top 5 Countries of Origin for Molds for Plastic [HS848071]
Pineda’s conclusion is compelling: “For an industry that relies on globally integrated supply chains, understanding where tariff pressures are binding remains essential. As negotiations continue and policies evolve, firms will continue to be challenged to maintain competitiveness in an uncertain global trade environment.”
How Tariff Insights from Descartes Datamyne Can Help
In a trade environment defined by rapid policy shifts, uneven tariff application, and evolving supply chains, having clear, actionable intelligence is a competitive necessity. Tariff Insights from Descartes Datamyne empowers businesses to move beyond reactive decision-making by providing precise visibility into duties, taxes, and total landed costs across sourcing options.
With Tariff Insights, supply chain, procurement, and trade compliance teams can compare tariff exposure across countries, identify cost-saving sourcing alternatives, and anticipate the impact of policy changes before they disrupt operations. By combining detailed tariff data with bill-of-lading and Census trade intelligence, organizations gain a comprehensive view of both the regulatory landscape and actual trade flows.
Whether evaluating supplier shifts, planning inventory strategies around tariff changes, or modeling landed costs under different scenarios, Tariff Insights helps businesses reduce risk, protect margins, and uncover new opportunities in a volatile global market. In an era where tariffs can quickly reshape entire industries, as seen across plastics, furniture, and raw materials, those equipped with the right insights are well positioned to adapt and lead.