


Pharmaceutical imports and imports of chemicals under Section VI of the Harmonized Tariff Schedule (HTS) are likely to be one of the sectors most notably impacted by the coronavirus pandemic over the next several years. The commonly held belief is that Covid-19 has highlighted vulnerabilities in the U.S. medical supply chain.
Among these vulnerabilities is a perceived dependence on foreign-based pharmaceutical supply manufacturers and, specifically, an over-reliance on China for these goods. Below, we utilize trade data from Descartes Datamyne to determine the accuracy of this conclusion as well as highlight other major sourcing shifts and suppliers in the Pharmaceuticals industries.
U.S. Chemical & Pharmaceutical Imports – By Volume
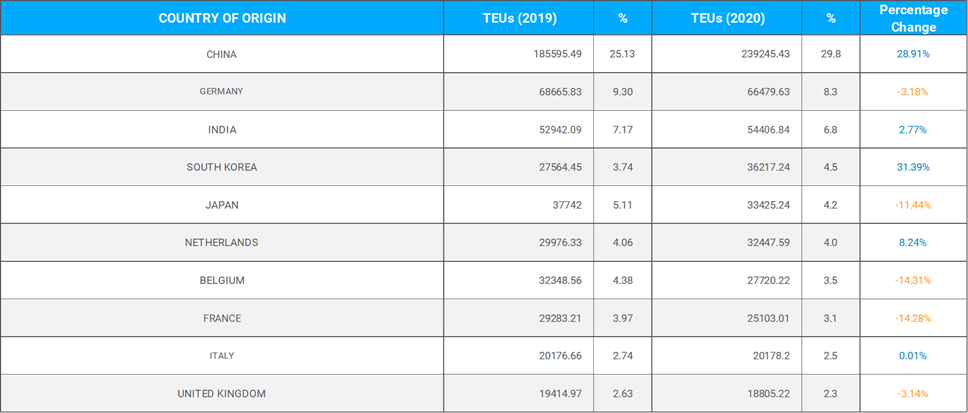
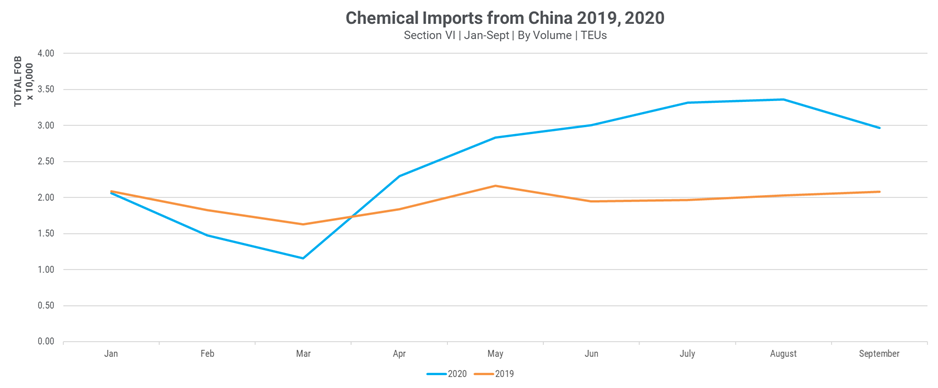
So far in 2020, China has increased its share of the U.S. market for the volume of Section VI imports to 29.8 percent, growing 28.9 percent in total volume to nearly 240,000 total Twenty-foot Equivalent Units (TEUs). China is considered a top supplier in the global active pharmaceutical ingredients (API) industry (which produces ingredients used in the manufacturing of drugs), so this increase is not unexpected.
According to this recent data, 72% of the API manufacturers supplying the US market are located overseas and 13% of those manufacturers operate in China.
The US market is not alone. Many countries, including Japan, France and Germany also depend heavily on imported chemicals pharmaceuticals. instance, nearly half of Japan’s APIs come from China and South Korea. As the pandemic continues to disrupt global supply chains, these countries may begin to struggle to produce basic medicines and rely further on international suppliers.

U.S. Chemical & Pharmaceutical Imports – By Value
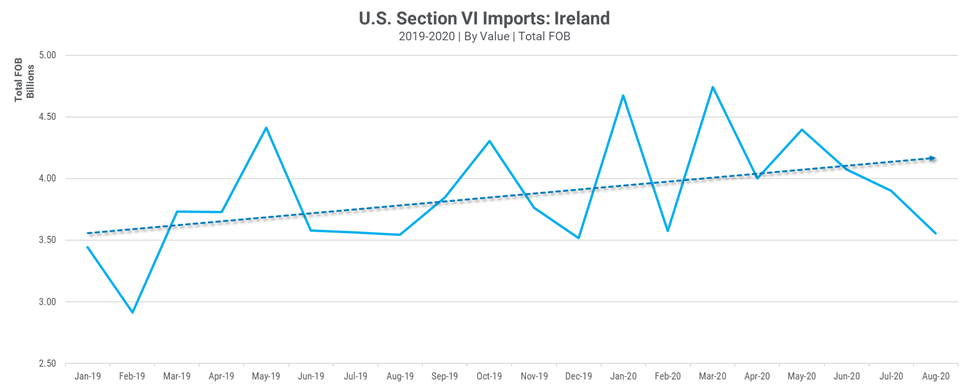
While China does top the list of chemical and pharmaceutical suppliers by volume, imports from Ireland represent the highest valued imports under Section VI. Driven primarily by the imports of medicaments, vaccines, and sera under HS 3002 and 3004.
To date, Ireland has seen an increase in the value of medicaments exported (classified under HS 3004) to the U.S. by 15.7 percent. The value of these imports nearly double that of second-ranked Germany to a total Freight-on-Board (FOB) value of $29.4 billion USD – tripling China’s $9.5 billion.
Emerging Chemical and Pharmaceutical Suppliers
Among top U.S. suppliers of chemicals by volume, there are several showing significant year-over-year growth. South Korea has jumped from the eighth-ranked country of origin to number four based on a 31.4 percent increase in volume so far in 2020.
Similarly, Hong Kong has increased 29.3 percent compared to 2019 and moved from fourteenth ranked supplier to eleventh. As the chart below demonstrates, both increases in year-over-year volume for these two countries began prior to the outbreak of COVID-19. These sourcing shifts, then, are likely the result of the trade policy disputes between the United States and China over the past several years.

Despite ongoing investments into their chemicals and pharmaceuticals industries, India has not shown a significant year-over-year growth in either the total volume of exports to the Unites States or in the value of those exports. So far, India has exported 2.8 percent more TEUs to the U.S. compared to the same period in 2019 and a 1.6 percent increase in value. Admittedly, any increase in year-over-year exports during the coronavirus pandemic is significant.
Ultimately, the United States is one of the major export destinations for pharmaceutical manufacturers in India, accounting for roughly 33% of the country’s section VI exports. Overall in In 2019-20, exports to the US recorded a 16 percent growth to $6.7 billion. Indian pharmaceuticals account for almost 30% of the market for generic drugs in the US.
U.S. Aiming Reduce Reliance on Foreign-Sourced Pharmaceuticals
Recently, the US Commerce Department and State Department is looking for ways to push companies to move both sourcing and manufacturing out of China. Tax incentives and potential re-shoring subsidies are among measures being considered to prompt these shifts.
In May, the administration announced a multi-million dollar contract with a Virginia-based pharmaceutical manufacturer Phlow Corporation. This contract, as well the incentives mentioned above, specifically outline the administration’s desire to increase U.S.-produced APIs. However, many U.S. drugmakers have expressed concerns over increased production costs.
Keeping Track of Trends in U.S. Imports
Prior to COVID-19, it was already a challenge for business leaders to keep pace with shifts in import trends. From duty and tariff changes, to economic fluctuations, changes in demand, and more, the volume and value of commodities can shift and impact a business’s bottom line. In addition, over the last few decades, globalization has prompted businesses to be more connected, meaning global imports and exports flow more quickly and any changes can have a far-reaching impact.
Today, as industries begin to recover from the pandemic, it is critical that they stay informed. This is where accurate, current, and fully reviewed global trade data comes in.
How Descartes Can Help
Descartes Datamyne delivers business intelligence with comprehensive, accurate, up-to-date, import and export information.
Our multinational trade data assets can be used to trace global supply chains and our bill-of-lading trade data – with cross-references to company profiles and customs information – can help businesses identify and qualify new sources. Ask us for a free, no obligation demonstration of our data on a product or trade commodity of your choosing – and keep the custom research we create with our compliments.
If you would like to view more insights into the chemical industry or other U.S. import trends, Descartes Datamyne has produced the U.S. Commodities “Big Book”.
Designed as a reference on U.S. import trade trends for port authorities, carriers, logistics providers, importers and shippers, this report analyzes the top U.S. imports by value during the months of Jan-July 2020 and measures those commodities against the same period in 2019. Examining trends across every section of the Harmonized Tariff Schedule, the report provides a gauge on the full impact of coronavirus on U.S. imports.
The report covers the key points that business leaders should know across a broad range of industries.