


U.S. tariffs on imports from China consigned the traditional peak shipping season to the ghosts of Christmases past this year.
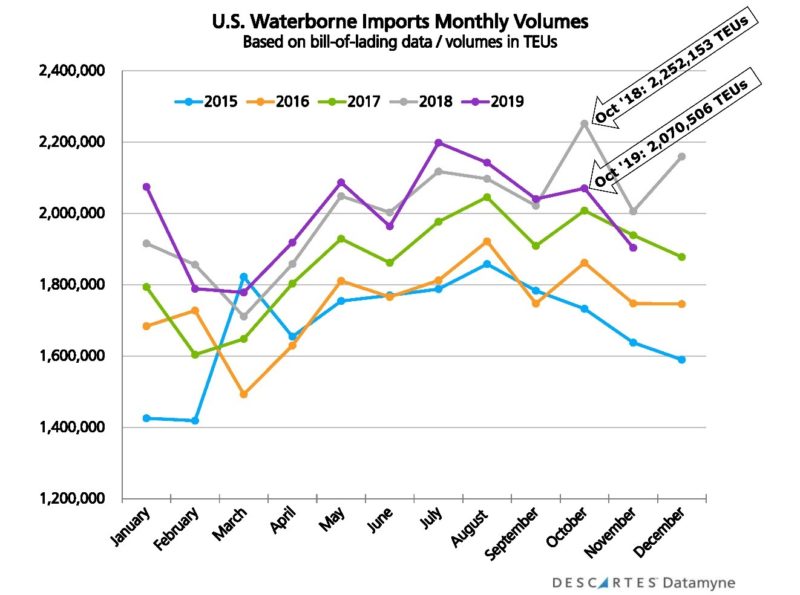
The U.S.-China trade war pushed the U.S. import shipping volume trend line for 2019 to an early peak in July before driving TEUs [20-foot equivalent units] on a downward path through most of the rest of year, as charted by Descartes Datamyne bill-of-lading waterborne trade data. This October’s bump-up of 1.5% from the previous month was well off last October’s month-over-month surge of 11.4%. Compared with October 2018, the volume of maritime imports contracted 8.1% in October 2019.
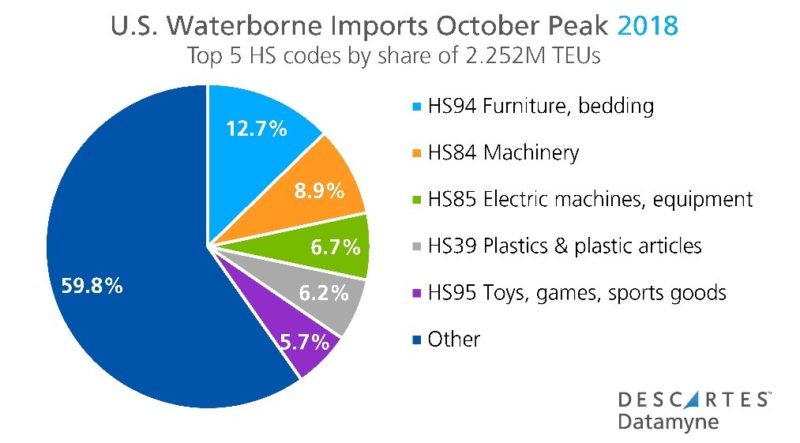
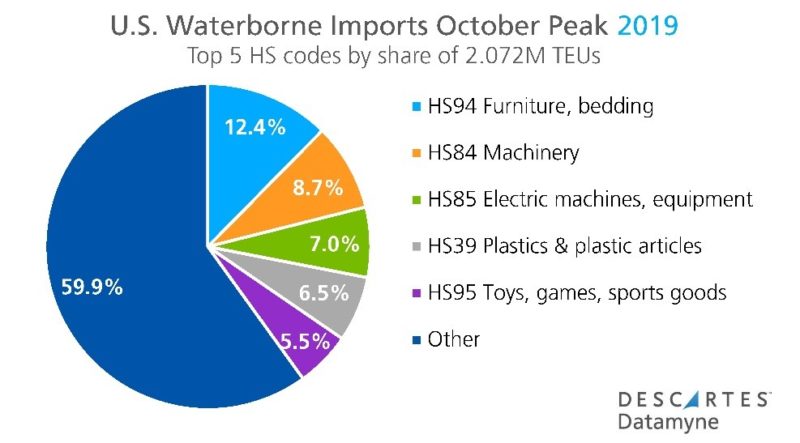
With Chinese products denoted by thousands of Harmonized System (HS) codes subject to U.S. punitive duties, the mix of trade goods has changed little from year to year, as the charts breaking out the top 5 product categories in October 2018 and October 2019 illustrate:
However, the timing of the tariffs, first threatened in March 2018, imposed in successive waves beginning in August of last year, with more pending in December of this year, has shifted trading patterns.
Note that the latest round of U.S. tariffs, which would have extended duties to virtually all imports from China had they taken effect as scheduled December 15, are suspended as of December 13.
Here is what the data reveals about inbound shipping volumes in the top five product categories over the past year:
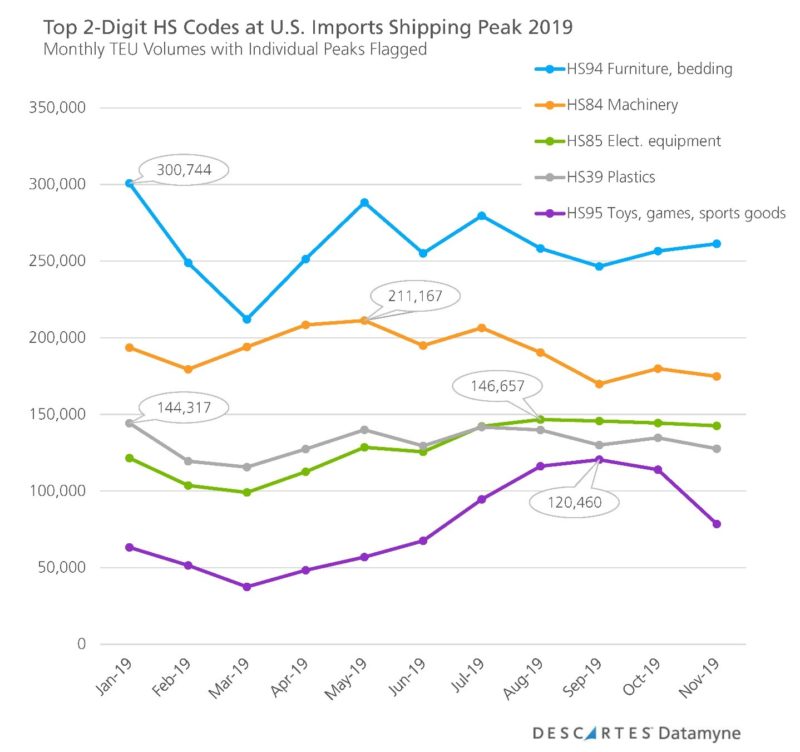
Compare these peaks and valleys with the volume trend lines of 2018: Furniture (HS94), which hit its peak in December last year, remained on a roll, hitting its high-point for 2019 in January. Similarly, plastics (HS39) import volumes hit their top levels for 2018 in December and for 2019 in January. Machinery (HS84) peaked in May in both years but neared the May peak in December 2018. This year, only furniture appears to be rallying as 2019 draws to a close.
Only electric equipment (HS85), which includes consumer electronics, and toys and sporting goods (HS95) are following a traditional pattern of peaking in the August through October run-up to the holidays when retailers stock up for their peak selling season.
U.S. Import Peak Shipping: More Unpacking
It may be that the retail apocalypse is partially to blame for deflating the traditional import peak season. As recently as 2017, apparel (HS61) ranked among the season’s top imports. That mainstay of retail merchandise has since been replaced by plastics.
One of our favorite features of the Descartes Datamyne U.S. maritime import online data product is that it enables users to total bill-of-lading records by 2-, 4- or 6-digit HS codes, making it quick and easy to unpack what’s inside the containers.
Here are the volume-share breakouts at the 6-digit level for each of peak October’s top 5 product categories:
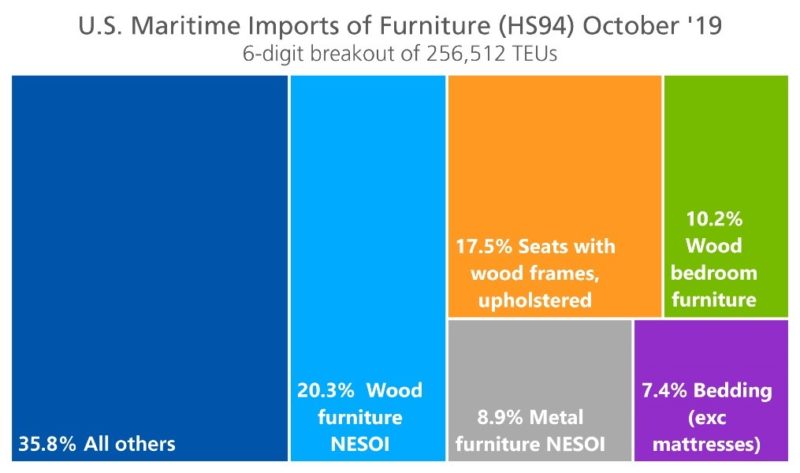
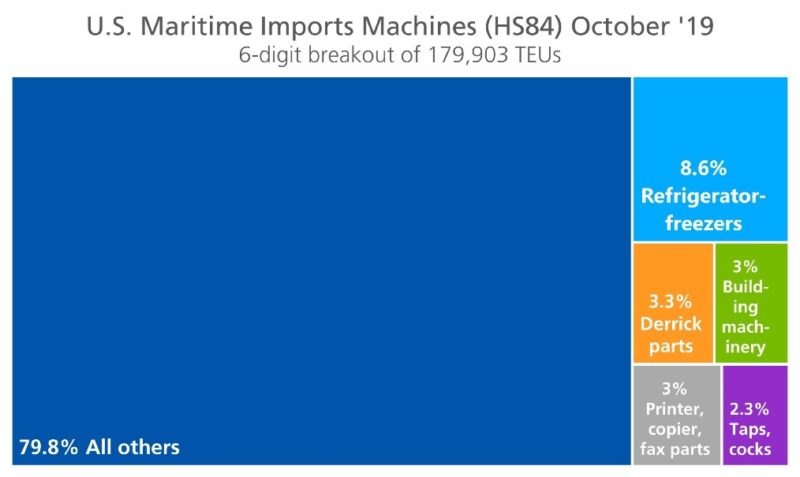
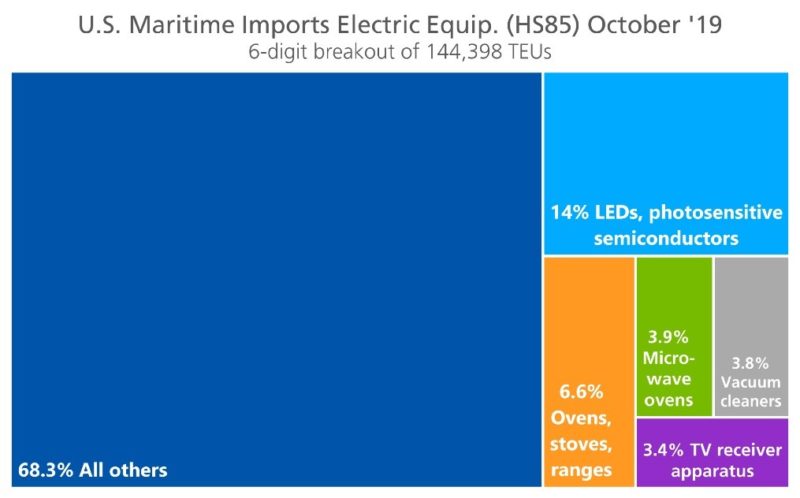
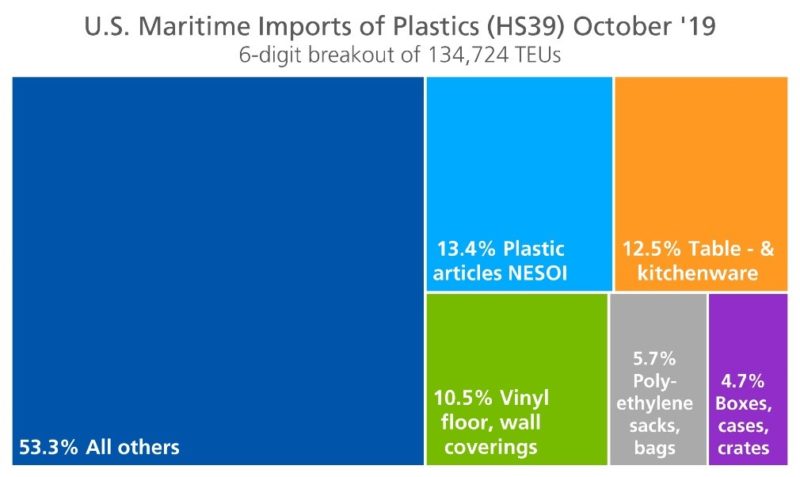
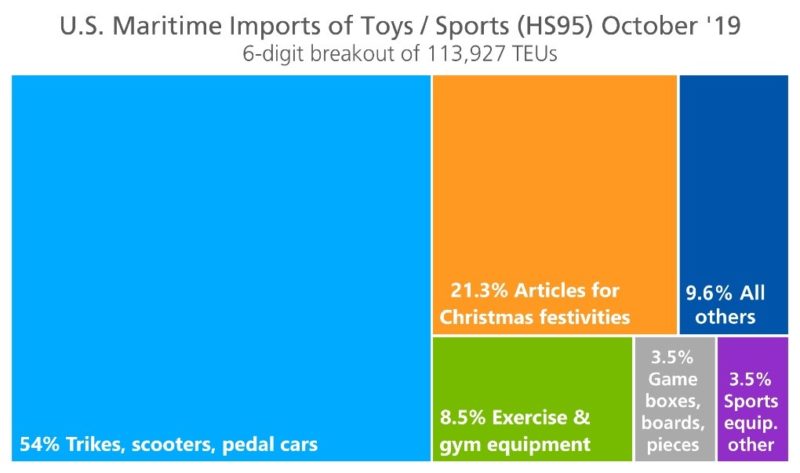
Clearly, durable goods commanded more container space than consumer goods.
For instance, in the product category of electric equipment (HS85), photosensitive devices including, most notably, light-emitting diodes, or LEDs, (HS854140), accounted for 14% of October’s inbound shipments by volume. And while the appliances that rank second, third and fourth in this category might be much appreciated (who wouldn’t want a new vacuum cleaner under the tree?), they surely aren’t typical holiday gifts (are they?).
Toys and sporting goods (HS95) seem more in the holiday spirit, with 21% of container volume packed with articles for Christmas festivities, including ornaments, artificial trees and nativity scenes (HS950510).
For more insights, our bill-of-lading data also makes it easy to total bills by importing or exporting companies, as well as drilling down to commodity descriptions and logistics details of individual shipments.
U.S. Import Peak Shipping: China Trade
Whether durable goods, consumer products or holiday decorations, the peak season’s top products have one thing in common: China is far and away the leading single source for these U.S. imports.
In October, China was the country of origin for 50.2% of U.S. furniture imports by TEU volume, 40.8% of machinery imports, 50.5% of imports categorized as electric equipment, 45.6% of plastics, and a whopping 81.9% toys and sports equipment.
The shifting pattern of monthly U.S. waterborne import volumes over the last three years is directly linked to the U.S. trade with China, as the data summarized in this chart makes plain:

The year-end surge of imports in 2018 is here shown to be driven by unusually high volumes from China. The flattened peak season of 2019 is the result of declines in Chinese imports, too steep (a 20.2% drop in October alone) to be offset by increases in shipments from elsewhere in Asia.
As noted above, the U.S. has suspended the tariffs that were set for December 15. There had been hopes that a surge in shipping ahead of the mid-December deadline would lift the traditional peak season’s volumes, as the pending imposition of tariffs on New Year’s Day 2019 drove up TEUs through year-end 2018. Alas, this is another historical pattern that shows no signs of repeating itself in the near future, as our latest available bill-of-lading data indicates.
Related:
Blogs:
- Trade War Reshapes U.S. Import 2018 Peak Shipping
- Twin Peaks: Imports Pass 2M TEUs Twice during 2017 Peak Shipping Season
Solutions and Resources:
- Tracking the rapid-fire exchange of tariffs in the ongoing U.S.-China trade dispute can be daunting for companies that do business across borders. Descartes CustomsInfoTM Manager offers a practical solution with end-to-end enterprise software for up-to-date tariff classifications. Learn more >>
- Take a closer look at the effects of the China-U.S. trade war and strategies to diversify supply chains to moderate risks and boost resilience in our White Paper: Targeting New Opportunities Amid Shifting Trade Policy the Sourcing and Diversification. Download the white paper >>