


Descartes Datamyne trade data indicates the current U.S. tariff regime has reshaped trade flows. But shifting implementation dates, fluctuating rates, and exemptions for select trade goods have muted impact on trade. Case in point: Automobile & light truck imports
Key Takeaways
- Tariff uncertainty led many industries to front-load imports.
- Most import value spikes were driven by price increases, not volume.
- Auto and light truck imports fell year over year despite a March bump.
- Bill of Lading (BOL) data shows an early surge in vehicle shipments ahead of tariff changes.
- United States–Mexico–Canada Agreement (USMCA) partners dominate U.S. auto imports but show different export timing.
- Overall tariff effects remain muted due to exemptions and supply-chain shifts.
The Trump Administration’s announcements of broad new import levies created an unprecedent level of uncertainty around U.S. tariff policies in general, and trade policy in particular – as reported in Economic Policy Uncertainty (EPU) indices from the Federal Reserve Bank of St. Louis (see Figure 1).
Figure 1.1 FRED’s Soaring Trade Uncertainty Index

Figure 1.2 FRED’s Soaring Trade Uncertainty Index

Sources: Scott R. Baker, Nick Bloom, Steven J. Davis via FRED – Federal Reserve Bank of St. Louis
Confronted with this uncertainty, many companies decided it would be prudent to stockpile ahead of expected price increases. Imports climbed to an unusual March peak, as U.S. Census import data through July shows (see Figure 2).
Figure 2 Monthly Value of U.S. Imports Peaks in March
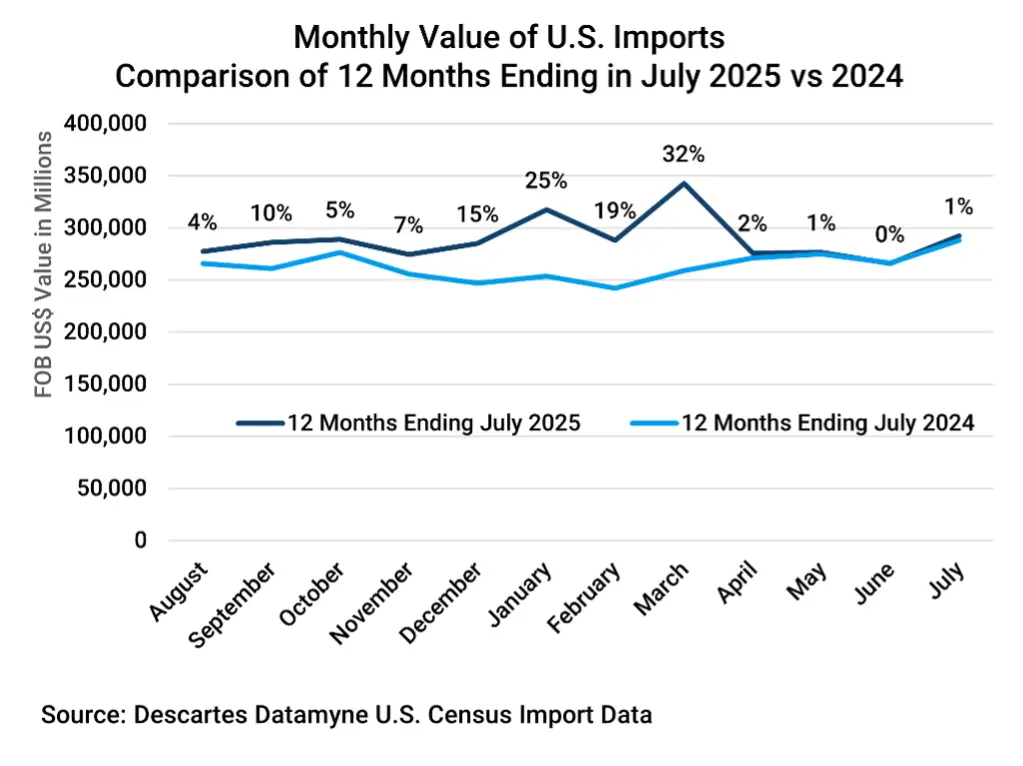
In its October World Economic Outlook, the International Monetary Fund (IMF) credited this front-loading of trade and investment with the apparent (and somewhat surprising) resilience of the global economy. Subsequent announcements of lowered U.S. tariffs from their April highs prompted the IMF to raise its growth outlook from 2.8% to 3.0%.
Using North American Industry Classification System (NAICS) Trade Data to Gauge Tariff Impacts on Industries
U.S. Census trade data offers a measure of front-loading’s impact on the top importing industrial sectors, as denoted by NAICS code:
Figure 3 U.S. Industries as Denoted by NAICS Ranked by Value of Imports
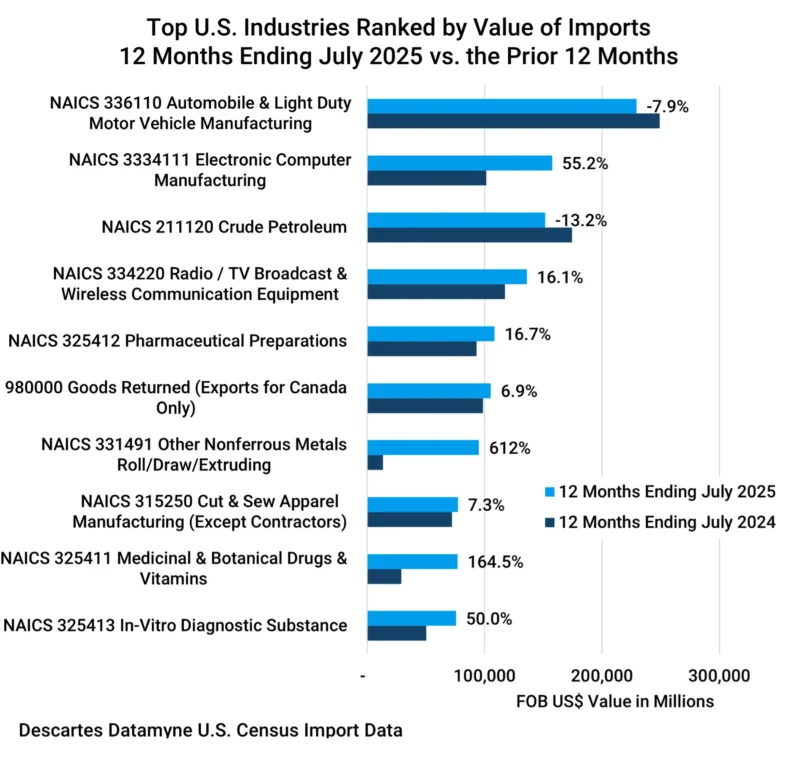
About the outliers in the above chart:
The stunning 612% growth in imports for Other Nonferrous Metals [NAICS 331491] is an indirect outcome of the U.S. tariff regime. A review of the tariff code data (6-digit HS code) on this sector’s imports reveals price rather than volume driving the gain.
Given this year’s economic anxiety, a rush to gold and silver (among this industry’s nonferrous metals) and an accompanying surge in prices were to be expected. This NAICS classification also covers critical minerals such as tungsten, which reportedly doubled in price in some markets [See Tungsten Emerges as a Key Battleground in Global Critical Mineral Trade.]
The -13.2% year-over-year decline in the value of trade for petroleum [NAICS 211120] is largely due to the -14.4% decline in the price of crude in the 12 months ending July 2025 compared with the same period a year earlier. [See, e.g.: ycharts.com.]
A closer look at NAICS codes leading the y-o-y percentage gains in the 12 months ending July reveals price boosts rather than volume growth at work (see Figure 4).
Figure 4 U.S. Industries with the Largest Year-over-Year Growth in Imports
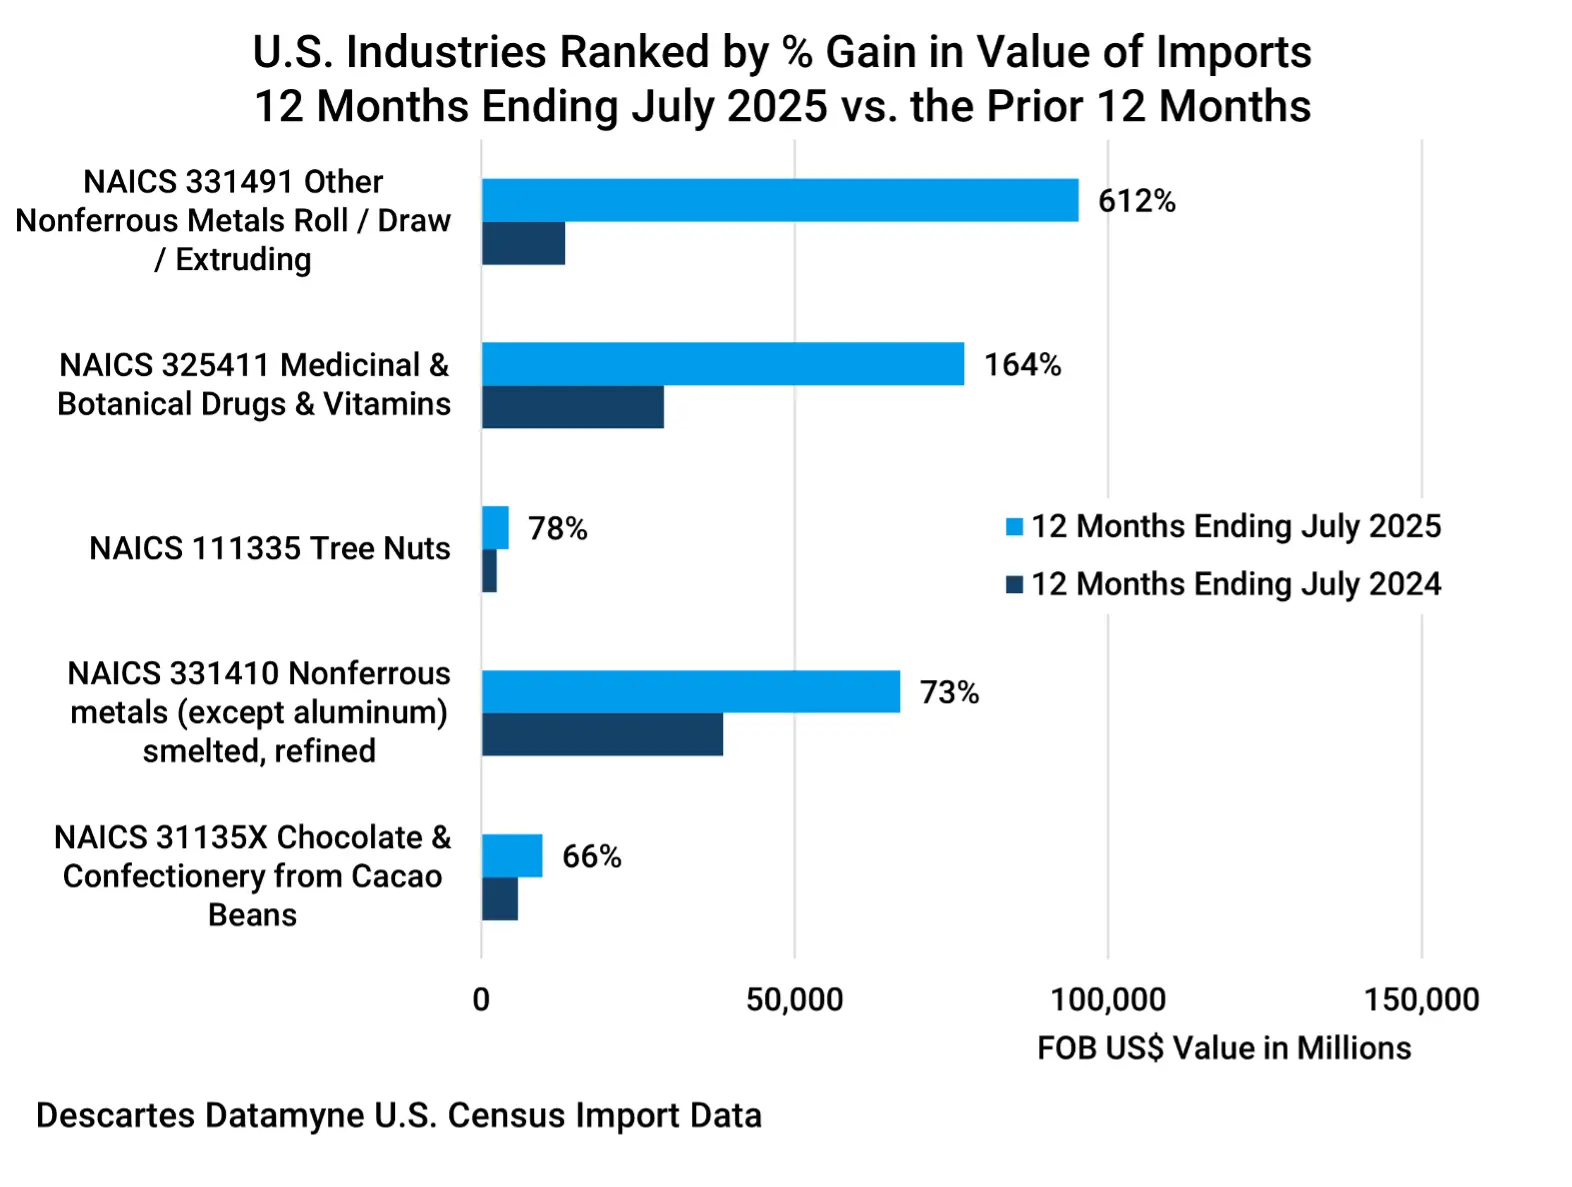
Gold and silver price surges also contributed to the 73% increase for smelted or refined nonferrous metals [NAICS 331410]. The soaring cost of cacao beans lifted imports of tree nuts [NAICS 111335] and cacao-based chocolate & confectionery [NAICS 31135X].
The medicinal & botanical drugs & vitamins sector [NAICS 325411] is the exception here. A big jump in per unit costs for polypeptides [HS293719], which accounted for 71.6% of the value of this trade, were offset by price cuts for other products. The sector’s 164% increase in import value was accompanied by an 188.7% increase in volume that looks very much like front-loading.
Using Multiple Data Resources to Gauge U.S. Tariff Impacts on Auto & Light Truck Imports
In contrast, the leading importer, the automobile & light truck sector [NAICs 336110], saw the value of imports decline almost -8%, accompanied by a -5.4% drop in volume, during the run-up period. For the top import in this sector, cars with internal combustion engines (ICE) and a cylinder capacity between 1500cc and 3000cc [HS870323], unit price decreased -5.2%, quantity shipped fell -9.2%, and the overall value declined -14%.
The top 5 vehicles at the 6-digit HS code level accounted for 92% of U.S. imports of passenger cars and light trucks over the 12 months ending in July 2025. In Figure 5, Descartes Datamyne U.S. Census data tracks the rise and fall of trade value month-by-month.
Figure 5 Monthly Value of U.S. Imports of Top 5 Automobile & Light Truck Products 2025
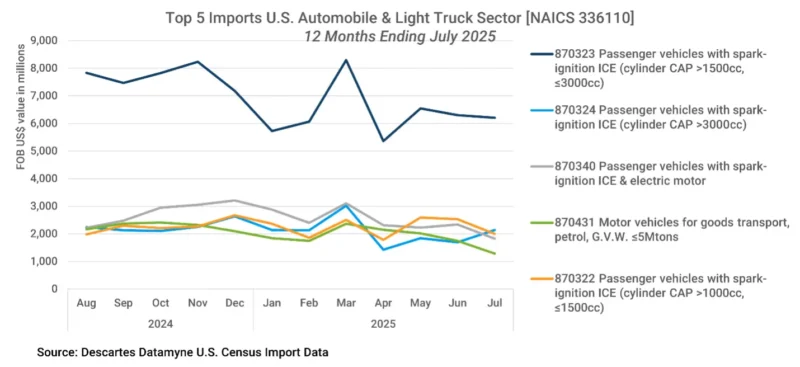
There is a clear bump-up in imports in March 2025 that suggests front-loading. But the value of this trade in the 12 months ending in 2025 fell below the previous year’s performance (see Figure 6).
Figure 6 Monthly Value of U.S. Imports of Top 5 Automobile & Light Truck Products 2024
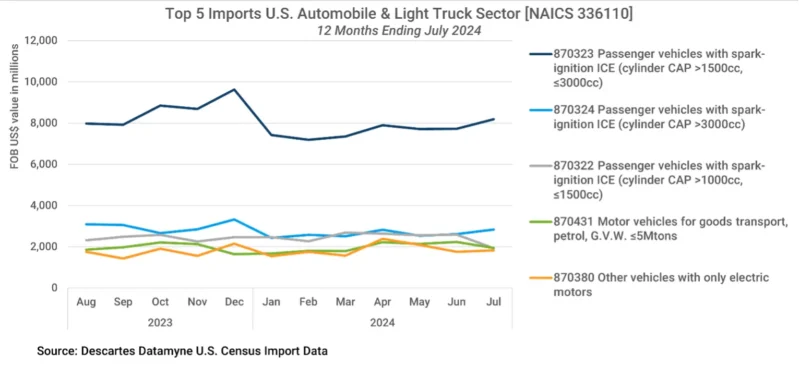
Note that all-electric vehicles ranked fifth by value in 2024, slipped to sixth place in 2025.
For evidence of front-loading in this sector, we turn to Descartes Datamyne bill-of-lading import data, which has the added value of being released two days after cargoes reach ports. While the July Census trade data is the latest available at this writing due to the government shutdown, the BOL data yields a view of vehicle trade through the end of October (see Figure 7).
Figure 7 Monthly Volume of Maritime Imports of Top Auto & Light Truck Product 2024 vs 2025
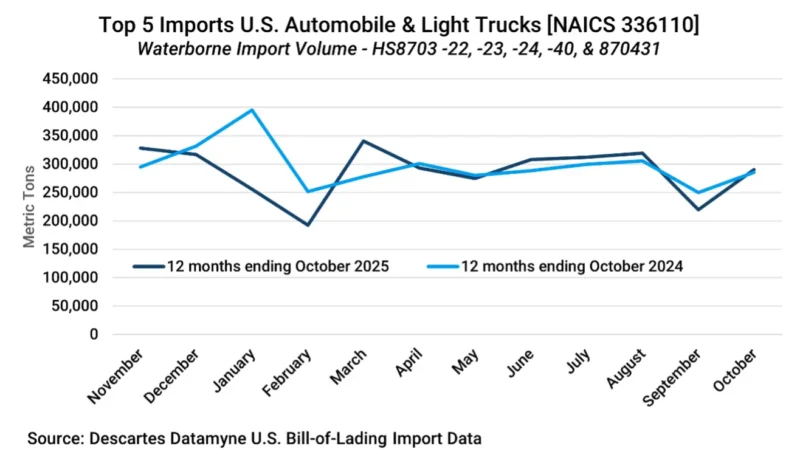
The BOL data traces a March peak that might indicate front-loading of automobiles and trucks ahead of the promised hike in customs duties. Note that the measure in this data set is metric tons, instead of the more typical TEUs used to measure containerized maritime imports. Weight is the more accurate measure for cars and trucks that generally ship via vehicle vessels designed to handle roll on/roll off (RoRo) cargoes. It is possible to drill down in the BOL data to identify consignees and shippers, logistics details, and the number of units (vehicles) shipped.
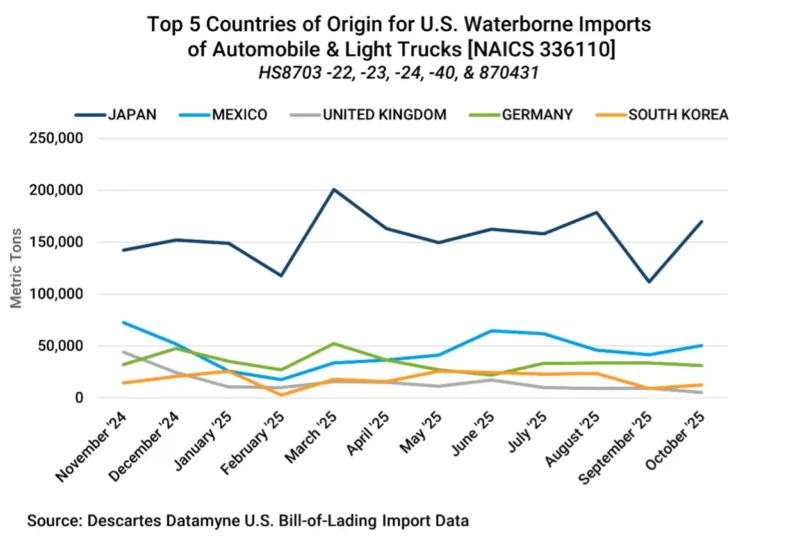
The maritime trade data provides further insight into the sources for March’s peak shipments (see Figure 8). Overseas partners account for the surge in waterborne shipments: principally Japan, followed by Germany, and South Korea (exports from second-ranked country of origin Mexico peaked in June).
Figure 8 Monthly Volume of Waterborne Imports of Autos & Light Trucks by Top Countries of Origin
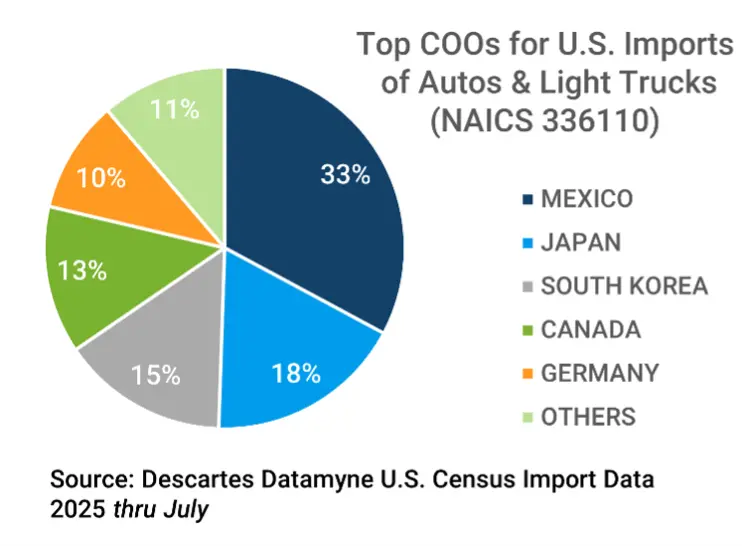
The maritime trade data captures an important facet, but not the entirety, of U.S. trade in cars and light trucks. Keep in mind that the BOL data covers waterborne cargoes, which generally account for approximately 40% by value (75% by tonnage) of U.S. foreign trade. But U.S. foreign trade in cars and light trucks has become a continental affair, with the country’s North American partners Canada and Mexico together accounting for 46% by value of imports of these vehicles this year (see Figure 9).
Figure 9 Top Countries of Origin for U.S. Imports of Automobiles & Light Trucks
Using International Database to Capture a Complete View of U.S. Auto Imports
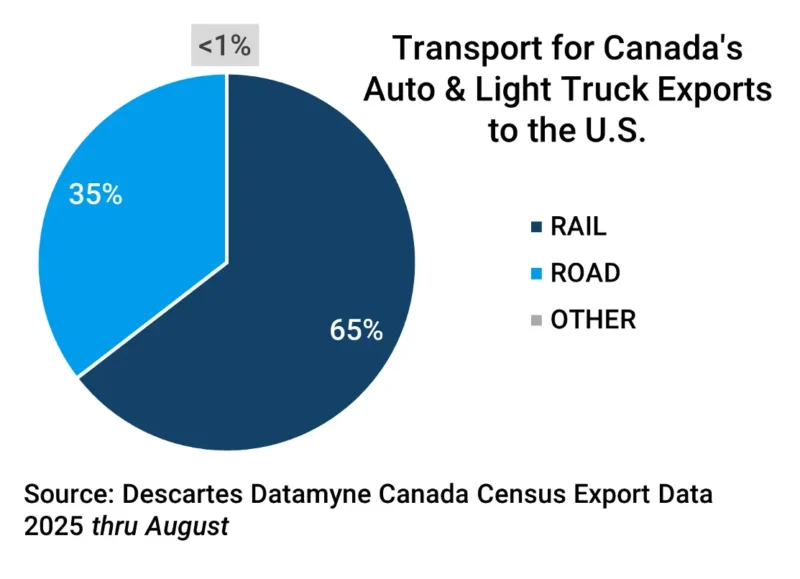
Most cars and light trucks from its USMCA trade partners are shipped to the U.S. overland, as Mexican and Canadian trade data from Descartes Datamyne indicates:
Figure 10 Modes of Transport for Mexico’s Exports of Autos & Light Trucks to the U.S.
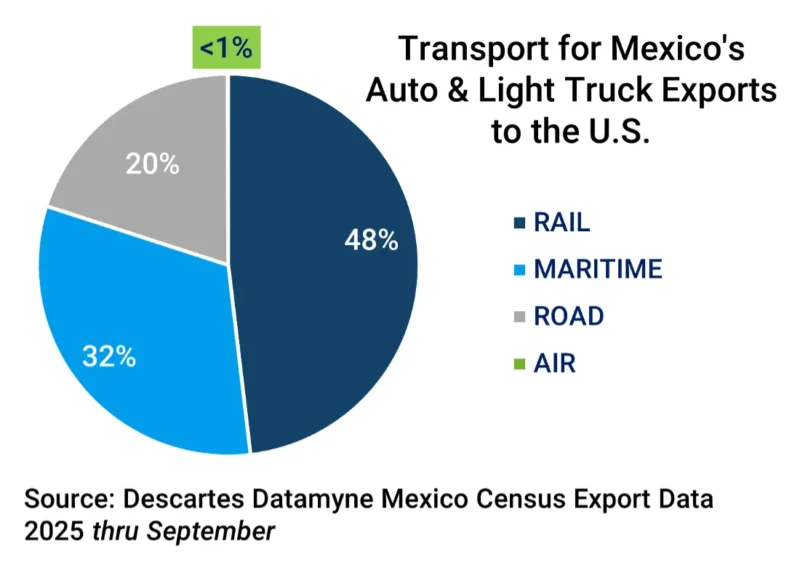
Figure 11 Modes of Transport for Canada’s Exports of Autos & Light Trucks to the U.S.
Descartes Datamyne international databases provide an additional perspective on trade. Here is the month-by-month tally of Mexico’s exports of cars and light trucks to its top markets this year through September, followed by Canadian export data through August:
Figure 12 Monthly Value of Mexico’s Exports of Autos & Light Trucks to Top Markets
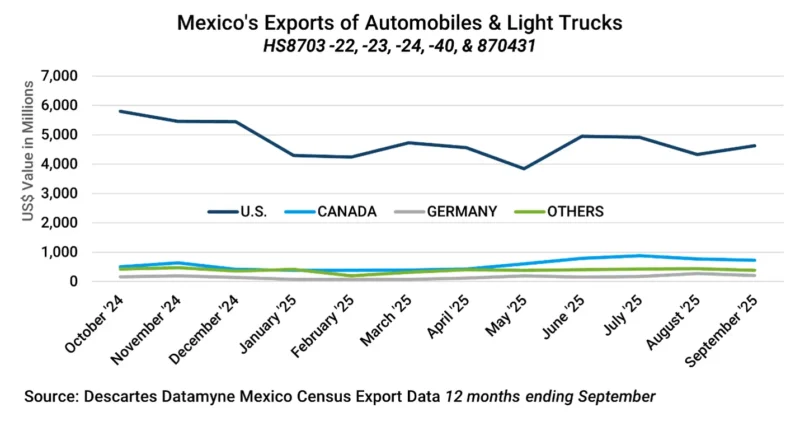
Figure 13 Monthly Value of Canada’s Exports of Autos & Light Trucks to Top Markets
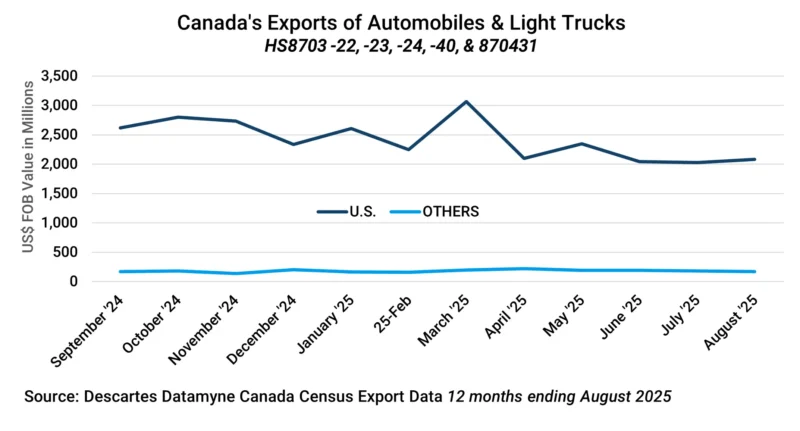
The data makes clear how mutually dependent the USMCA partners are in this trade. The U.S. is the top destination for cars and light trucks from both Canada and Mexico, accounting for 82% of Mexican and 93% of Canadian exports. But the rise and fall of exports from each over the 12 months is strikingly different. The Canadian data indicates exports peaking in March, while the March rise in Mexican exports is shallower, and the 2025 peak isn’t reached until June-July. What accounts for the difference?
Generally, USMCA-compliant goods are exempt from U.S. tariffs. There was some initial uncertainty around the earlier February 1 announcement of 25% tariffs on Canadian and Mexican imports because there was no specific mention of USMCA exemptions.
In any event, the tariffs were postponed to March 4. The next day, President Trump ordered a one-month delay of auto tariffs at the request of U.S. carmakers, who are heavily invested in cross-border assembly lines. On March 6, U.S. tariffs on USCMA-compliant goods were formally paused. There followed a string of orders, detailing procedures for identifying U.S. content of autos and auto parts for purposes of USCMA duty treatment, outlining measures to prevent “stacking” tariffs (this tariff relief was extended from two to five years last month), and resetting the tariff policy on automobiles and parts, generally lowering rates depending on U.S. content.
All these policies apply to both of these U.S. trade partners. Where they’ve parted company has been in their respective responses to the Trump administration’s tariffs: Canada took a retaliatory position, Mexico sought reconciliation. In consequence, as recounted by the Financial Times, the 25% tariff on non-USMCA goods from Mexico has been suspended pending negotiations on a better deal, while the U.S. tariff applied to Canada was increased to 35% effective August 1 and, more recently, an additional 10% threatened (over an Ontario TV commercial critical of tariffs).
Takeaway: Variable U.S. Tariff Rates Yield Muted, Mixed Results
The IMF Outlook sees front-loading unwinding, and the pass-through of U.S. tariffs to consumer prices, previously muted, looking increasingly likely.
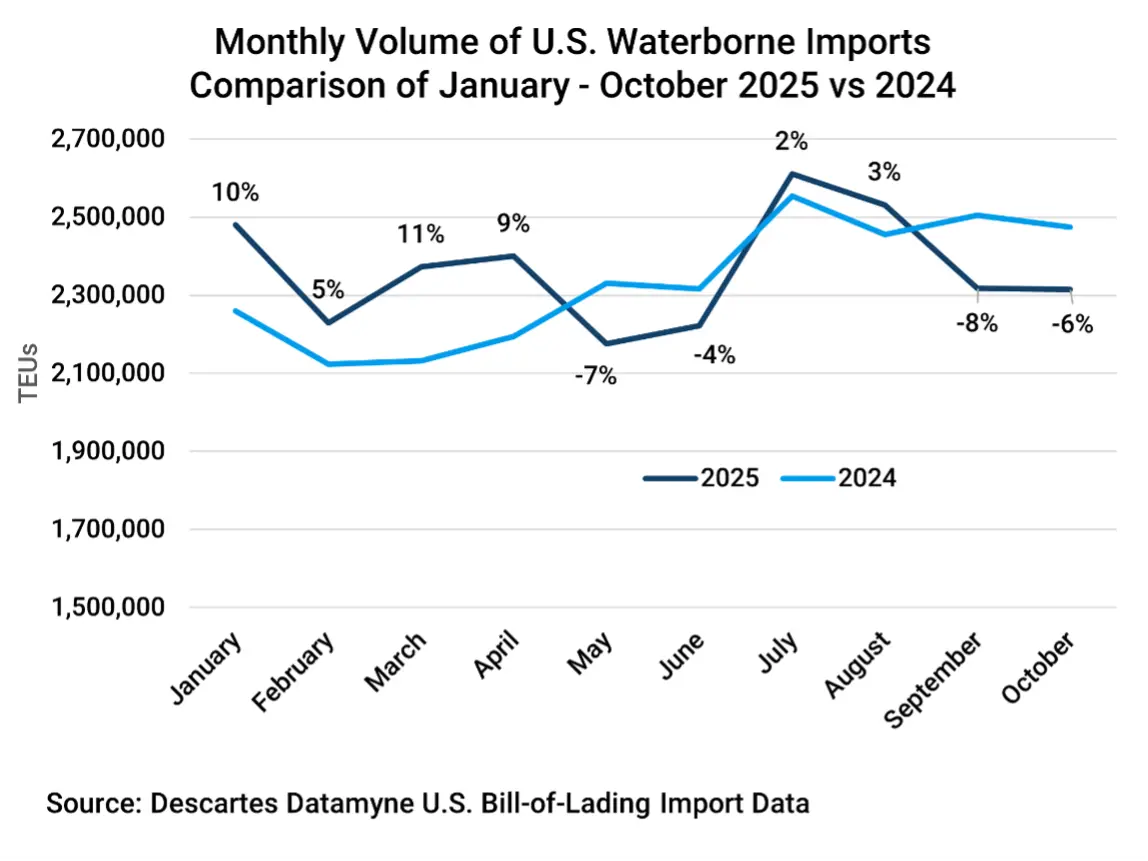
The Descartes Datamyne comparative data on monthly volumes of waterborne imports confirms that once surging in-bound shipments to the U.S. have ebbed below the preceding year’s levels:
Figure 14 Monthly Volume of U.S. Maritime Imports January through October 2024 vs 2025
In its November 2 appraisal of the Trump administration tariffs, the Wall Street Journal echoed the IMF on the muted impact of the tariffs on prices. The reason? The U.S. tariffs companies actually pay are lower than publicized. In addition to stockpiling, many companies are benefiting from exemptions or moving production to countries where lower rates apply. Only some companies are passing along some tariff costs to consumers.
According to the WSJ, average auto prices in September were only about 1.1% higher than in March.
A new round of U.S. tariff hikes was unveiled in September, covering, among other products, medium- and heavy-duty trucks and buses. Once again, there are exemptions and opportunities to bargain for better deals on offer.
How Descartes Can Help
Understanding the real impact of tariffs requires more than headline rates or policy announcements, it demands timely, granular, and multi-sourced trade intelligence. Descartes Datamyne delivers exactly that.
With the world’s largest trade databases, Descartes Datamyne enables organizations to:
Track Tariff Impacts in Near Real Time
Our U.S. Bill-of-Lading (BOL) data lets users detect front-loading, shipment surges, and shifts in sourcing behavior. This early visibility is essential when tariff timing is uncertain or frequently revised.
Analyze Trade Dynamics Across Industries and Partners
Whether evaluating downstream effects for automotive, metals, pharmaceuticals, or agricultural products, Descartes Datamyne’s ability to drill down from HS code classification codes allows for precise measurement of changes in price, volume, and supplier behavior.
Compare U.S. Imports with International Export Data
Our international trade databases provide a complete view of cross-border flows. By combining U.S. import records with partner-country export data, users can validate volumes, uncover routing changes, and better understand how USMCA or other regional agreements influence market dynamics.
Identify Opportunities for Tariff Mitigation
Descartes Datamyne helps companies discover alternative suppliers, evaluate duty-savings strategies, and monitor tariff exemptions and shifts in sourcing that competitors may be leveraging. Visibility into active shippers, consignees, transport modes, and country-of-origin trends supports smarter procurement and compliance planning.
Support Strategic Forecasting and Risk Management
As the current tariff environment remains fluid, with fluctuating rates, exemptions, and policy revisions, businesses can use global trade data from Descartes Datamyne to make informed decisions.