


U.S. trade policies scored tactical gains in 2025, closing the trade gap and boosting Foreign Direct Investment (FDI). But the strategic objective – reindustrializing the U.S. – remains a distant goal. Meanwhile, Descartes Datamyne™ data shows, some sectors are sustaining collateral damage as U.S. tariffs strain and reshape global trade relationships.
Key Takeaways
- U.S. tariffs narrowed the trade deficit and boosted foreign direct investment in 2025, but reindustrialization gains remain limited.
- Manufacturing-focused FDI increased as investors adjusted to clearer U.S. tariff frameworks and bilateral trade agreements.
- Mexico overtook China as the top U.S. trading partner as supply chains shifted away from tariff-exposed routes.
- U.S. maritime import and export volumes declined in the second half of 2025 amid tariff-driven trade disruption.
- Retaliation against U.S. tariffs severely impacted agricultural exports, particularly soybeans, cotton, and pork.
- The economic costs of U.S. tariffs continue to ripple through global supply chains, reinforcing long-term trade volatility.
- How Descartes Datamyne can help businesses navigate U.S. tariffs in 2026.
Data released on January 8 by the Bureau of Economic Analysis (BEA) indicates progress toward two goals of the U.S. tariffs and broader U.S. trade policies, as articulated by the U.S. Trade Representative (USTR): readjusting the trade balance between the U.S. and its trade partners and reindustrializing the U.S. economy.
First, the U.S. goods and services trade deficit in October 2025 declined nearly 40% from the preceding month, falling to its lowest level since 2009.
Figure 1 The U.S. Trade Deficit in October
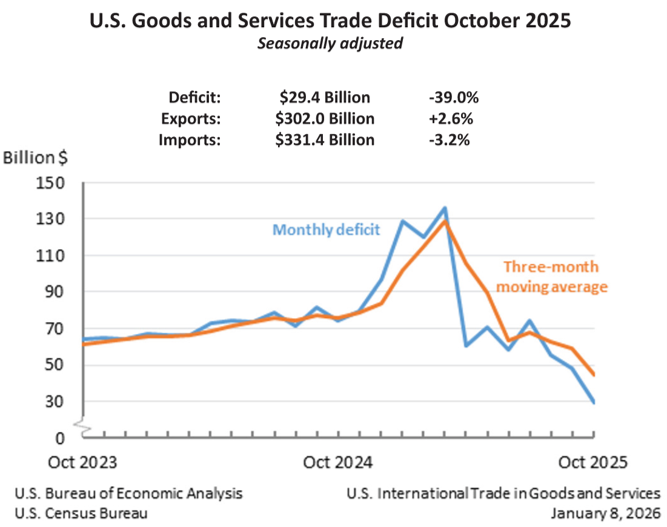
Source: Bureau of Economic Analysis
U.S. Census Bureau
Second, BEA quarterly data on foreign direct investment (FDI) shows inflows to the U.S. reaching $89 billion in third-quarter 2025, a slight improvement over $86.5 billion in 2Q25, and a substantial increase from $43.03 billion in 1Q25.
Figure 2 Quarterly FDI into and out of the U.S.
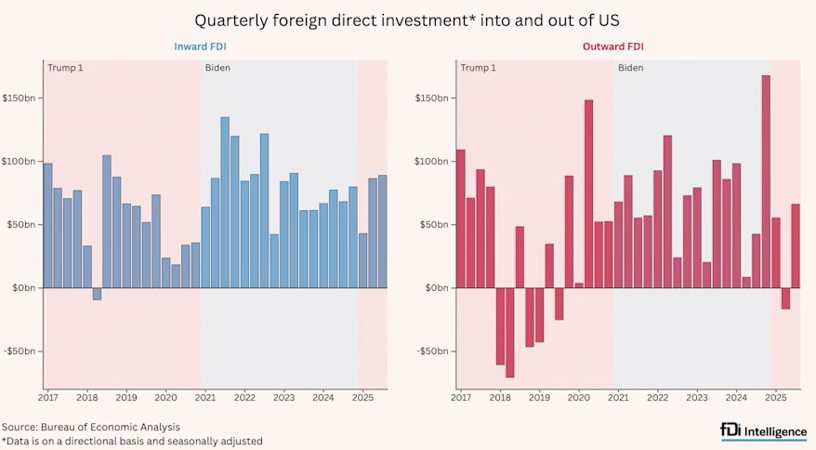
Source: Bureau of Economic Analysis
According to fDi Intelligence (the source for the above charts), much of the gain is due to new equity inflows, which surged to $40.6 billion in 3Q25, compared with $10.5 billion in 2024.
A big chunk is earmarked for manufacturing. Analysis from the Global Business Alliance (GBA) finds the manufacturing sector accounted for $97 billion in the first nine months of 2025. The Trump administration’s tally of investors counts 137 companies and sovereign entities, with about 70% committing to manufacturing upgrades, expansions or greenfield projects.
It would seem that after the uncertainty surrounding U.S. tariffs and trade policies at the start of 2025 something would had eased for investors. As GBA CEO Jonathan Samford told fDi Intelligence, U.S. bilateral trade frameworks that started being released in the summer “have given better clarity” on the intention and scope of U.S. trade policies. Still, he said, “a lot could change.”
New Frameworks for Trade with the U.S.
Indeed, the Trump administration provided some clarification on its objectives with the September 5 publication of a process for reaching bilateral trade agreements with countries subject to the blanket reciprocal U.S. tariffs announced in April and effective in August 2025.
October’s final agreements with Cambodia and Malaysia, and the frameworks for trade agreements with Thailand and Vietnam, reflect the process.
Briefly, the final deal with Cambodia calls for reciprocal tariffs and quotas to be subject to the agreement of both partners. Non-tariff barriers – such as opaque import licensing or domestic standards aimed at selectively restricting trade – are to be lowered. Intellectual property is to be protected.
Additional points of agreement address U.S. economic and security objectives, including collaboration on regulating trade in sensitive technologies, enforcing sanctions, and preventing illegal transshipments.
Finally, there are commercial considerations: the agreements with Cambodia and Malaysia include commitments to facilitate U.S. investment in the exploration and extraction of critical minerals and energy resources.
There are frameworks in place for negotiations with the United Kingdom (agreed in May) and the EU (July), with formal trade pacts pending. The U.S. and Japan trade deal initially framed in July was finalized in October.
In November, the U.S. announced frameworks for agreements on reciprocal trade with Ecuador. There is also an agreed framework for reciprocal trade and investment with Argentina. The U.S. signed an agreement with El Salvador on January 29, and with Guatemala on January 30.
Also in November, the U.S. and China agreed to ratchet back some of their draconian trade remedies, declaring a one-year truce.
So, some clarity and a promise of more stability in the application of U.S. tariffs. But as GBA’s Samford cautioned: things could change. At this writing, the European Parliament has suspended the approval of a U.S. trade deal agreed in July in protest over the U.S. quest for Greenland.
Especially consequential, the U.S.-Mexico-Canada Agreement (USMCA) will be up for its six-year review this July, a moment that could reset U.S. tariffs across North America.
Mexico Rises as Top U.S. Trading Partner
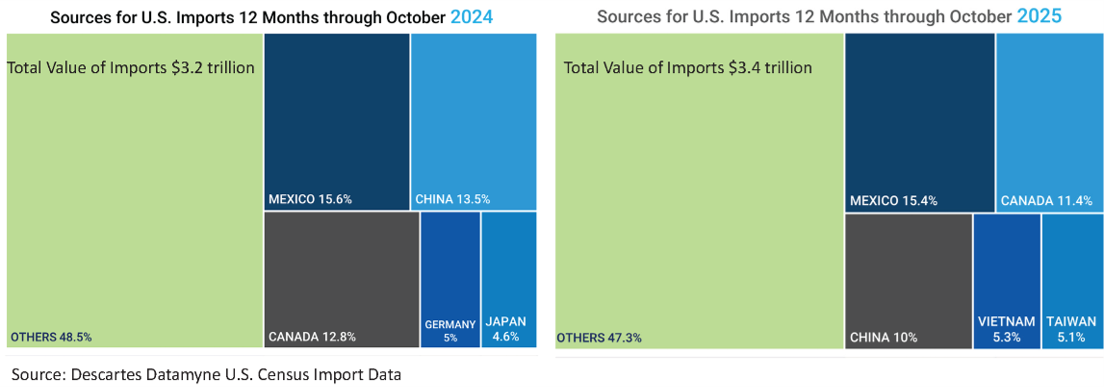
The U.S. decoupling from China, underway since 2016, gained momentum last year. Once the top source for imports ranked by value, claiming 21.5% share in 2015, China ceded first place to Mexico in 2023. In the 12 months ending with October 2025, it slipped to third behind USMCA partner Canada, with a U.S. market share just shy of 10%.
Figure 3 Top Countries of Origin for U.S. Imports 12 months ending in October 2024 vs 2025
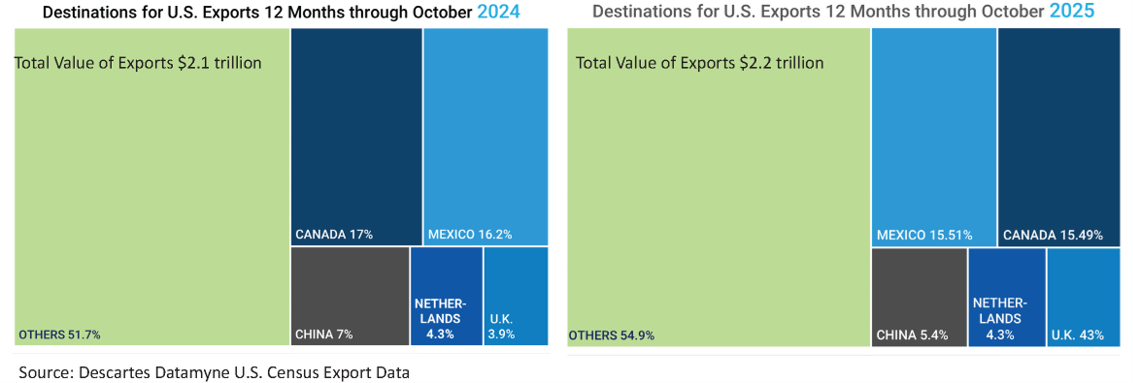
With trade tensions slowing commerce in both directions between the U.S. and Canada, Mexico edged past Canada to become the top destination for U.S. exports, claiming a 15.51% share to Canada’s 15.49%.
Figure 4 Top Destinations for U.S. Exports 12 months ending in October 2024 vs 2025
In his December report to Congress on the administration’s strategy for the joint review of USMCA, USTR Jamieson Greer noted that the trade pact has provided some certainty for North American trade. As our Census data indicates, Canada and Mexico are the mainstays of U.S. trade, accounting for 27% of imports, 30% of exports. According to the USTR, U.S. exports of goods and services to Canada and Mexico are up 56% since 2020. Over that same period, Mexico has captured about 25% of the reduction in U.S. bilateral trade deficit with China, “demonstrating the important role that Mexico plays in U.S. supply chain resilience.”
Bottom line: the Trump administration would like to see USMCA renewed for a 16-year term, but there is a laundry list of issues to be addressed (summarized in the USTR report to Congress).
Trans-Pacific Trade Shifts
Surveying prospects for the year ahead in the Kharon Brief, Jackson Wood, Director of Industry Strategy at Descartes, said he expects continued market disruption: “Economic security now is national security, and global trade is the primary domain of conflict.”
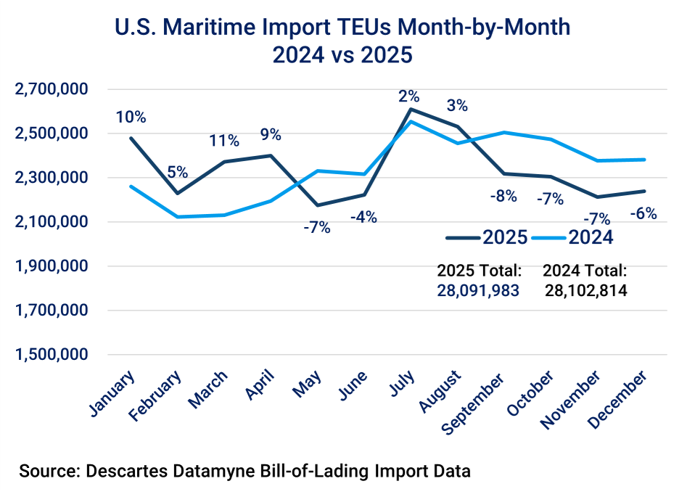
U.S. maritime trade is on the front lines of the conflict created by U.S. tariffs and retaliatory measures. Descartes Datamyne bill-of-lading (BOL) data shows that, after a July peak, monthly import volumes declined through year-end 2025.
Figure 5 Monthly U.S. Maritime Import Volumes 2024 vs 2025
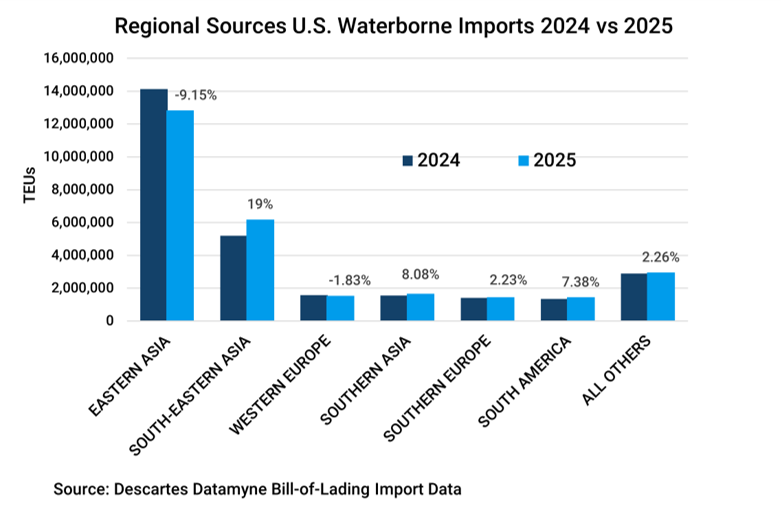
Much of the decline is accounted for by a 9.15% drop in shipments from East Asia, by far the leading regional source for U.S. maritime imports, responsible for 50.26% of the region’s outbound shipments in 2024, 45% in 2025. As production hubs continued to shift to Southeast Asia, the region increased its U.S. market share, climbing 19% to claim a 22.04% share in 2025.
Figure 6 Regional Sources for U.S. Maritime Imports Market Share 2024 vs 2025
The downward trend in East Asia volumes is largely attributable to China, the source for around three-quarters of the region’s trade with the U.S. Descartes Datamyne BOL data indicates a -10.83% drop in shipments to the U.S. in 2025.
A footnote: Our BOL data shows waterborne import volumes from Taiwan declined -4.53% year-over-year. On the other hand, our Census data captures trade in Taiwan’s top-value exports to the U.S. – computers, computer parts, and semiconductors – which ship by air. Census data for the 12 months ending October 2025 records a 58% year-over-year increase in the value of Taiwan’s imports, lifting it to fifth-ranked among U.S. import countries of origin.
In contrast to waterborne imports, export volumes exceeded 2024 levels until a precipitous -21% drop at year-end 2025, as our BOL data shows:
Figure 7 Monthly U.S. Maritime Export Volumes 2024 vs 2025
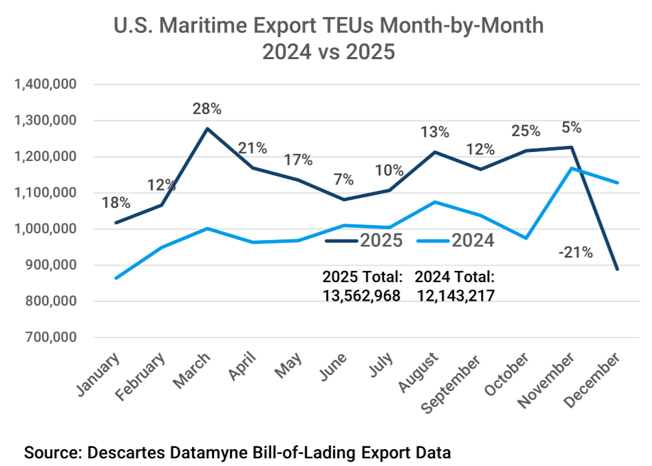
The story here is one of retaliation against U.S. tariffs.
Agriculture in Distress
Since U.S. agriculture slipped into recession in 2023, the sector’s economic distress has become acute as China has specially targeted U.S. farm products for retaliatory action, starting with soybeans.
Until 2025, soybeans [HS120190] were the top U.S. agricultural export, generally accounting for a little over 16% of the value of this trade. Over the first 10 months of the year, soybeans slipped to a 9.4% share, ceding top ranking to corn [HS100590]. Our BOL data shows China was the destination for 52%–55% of U.S. soybeans shipped in each of the five years ending with 2024. Prior to the opening rounds of the China-U.S. trade dispute in 2018, China’s share had been as high as 62%.
As our BOL export data illustrates, this trade came to an abrupt halt in 2025:
Figure 8 Monthly U.S. Maritime Exports of Soybeans to China 2025
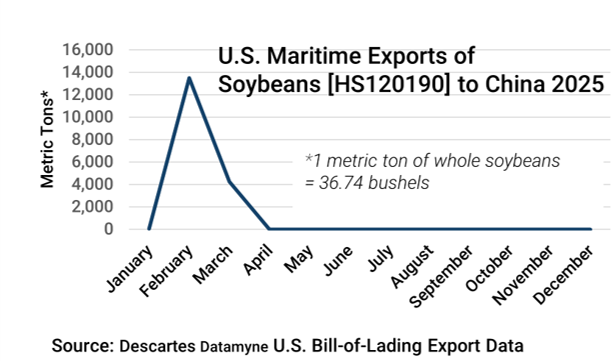
The Iowa Soybean Association was among those applauding the U.S. and China announcement because, as part of the trade truce brokered in October, the Chinese had committed to purchasing 12 million metric tons of U.S. soybeans before calendar year end. After a slow start, China is on track to meet its commitment by the end of this February.
The blowback from U.S. tariffs has not been limited to soybeans. Over 20% of U.S. ag production is for export, according to the Farm Bureau. Some 88% of cotton raised in the U.S. is bound for export markets. A little over 30% of U.S. pork production is for exports. A top customer for these and other U.S. agricultural exports, China has levied tariffs on a comprehensive list of products including pork, beef, and cotton. This table summarizes ensuing cutbacks in China’s purchases:
Figure 9 China’s Cutbacks in Agricultural Exports from the U.S.
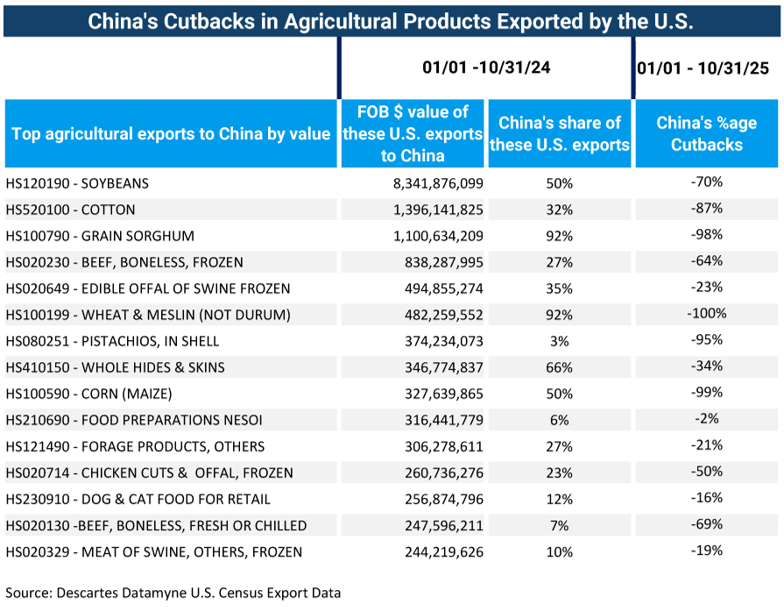
The resulting surplus of U.S. products that would otherwise have shipped to China has driven down prices, straining producers’ finances. China has also slapped export controls on fertilizers with the apparent aim of boosting global market prices (a move that has gotten some push-back from its domestic producers, according to Farm Progress).
Agricultural equipment manufacturer Deere has warned the economic distress is not limited to farmers. Cory Reed, president of the company’s agriculture and turf division, told the Financial Times that demand for expensive farm equipment in the U.S. is faltering as growers contend with weak crop prices, higher input costs, and persistent trade uncertainty. The company has cut back on domestic production and laid off factory workers.
Reindustrialization: Not There Yet
The express objective of U.S. tariffs under the Trump administration is to accelerate the re-industrialization of the U.S. That tariffs can be deployed to achieve that end remains to be seen. The available data suggests that the manufacturing sector, which fell into recession in 2023 after the Federal Reserve raised interest rates, is still contracting, as reported by The Economist (the source for the next chart). There’s an upswing in domestic production of semiconductors and computers; however, these are outliers, benefiting from previous administrations’ support (most recently, the CHIPs Act), some carve-outs from 2025’s reciprocal U.S. tariffs (see, for instance, the agreement on trade and investment with Taiwan) and booming demand from data centers.
Figure 10 Change in U.S. Manufacturing Production (against a 2017 baseline) 2000-2025
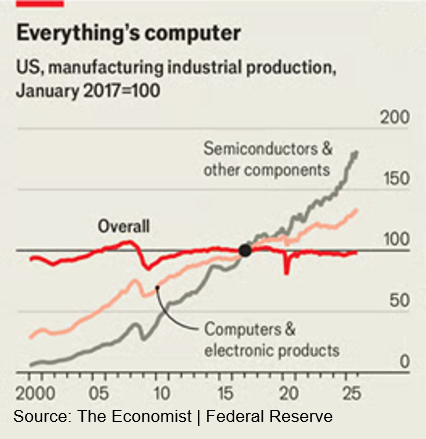
Source: The Economist; Federal Reserve
It’s a little soon to expect big gains in reshoring. The costs exacted by U.S. tariffs are still rippling through cross-border supply chains. It will take years for the new manufacturing capacity promised FDI investors to get up and running. Taiwan Semiconductor Manufacturing Company (TSMC) announced plans to invest in a semiconductor manufacturing site near Phoenix, Arizona in May 2020. The first wafer fabrication facility (of six planned) began production in 4Q24. Construction on the second fab was completed in 2025. Samsung’s new chip fabrication facility in Taylor, Texas is scheduled to come online in the latter half of 2026.
In the meantime, businesses will have to contend with an environment in which, as Jackson Wood has said: “Volatility is no longer episodic. It’s structural.”
How Descartes Datamyne Can Help
In an environment shaped by persistent trade volatility and evolving U.S. tariffs, access to timely, granular trade data is essential. Descartes Datamyne provides bill of lading and Census data that enables businesses, analysts, and policymakers to monitor shifts in global supply chains, identify changes in sourcing and demand, and assess the real-world impact of trade policies as they unfold.
With visibility into import and export flows by country, port, commodity, and company, Descartes Datamyne helps organizations anticipate risk, uncover new opportunities, and make informed decisions amid ongoing tariff-driven disruption. To see how Descartes Datamyne can support your trade analysis and strategy, request a demo today.