


A return to the 25% duty rate on U.S. automotive exports to China is set to enter into effect on December 15th, and U.S. auto-makers are worried about the effects. Overseas sales of U.S.-made cars have yet to recover after last year’s tariff cut shipments to China by more than half.
Particularly exposed to a resumption of the Chinese tariff: manufacturers of electric vehicles.
China’s 25% tariff on motor vehicles and a 5% duty on automotive parts made in the United States were initially imposed July 6, 2018, as trade tensions between the U.S. and China escalated in a round of tit-for-tat tariffs.
As a prelude to fresh trade talks in the new year, China suspended the tariffs effective January 1, 2019, through the first quarter, and then extended the suspension indefinitely on April 1. However, as negotiations stalled, the U.S. first threatened and then imposed sanctions on Chinese companies and new tariffs on more than 2,000 Chinese goods, with a focus on apparel, footwear, and textiles, effective September 1.
China immediately responded with new levies on U.S. imports, with more on the horizon (including the aforementioned duty on automobiles) in mid-December.
U.S. Auto Exports: Tariff Impact in 2018 & 2019
China’s September 5 announcement that the two countries have agreed to rejoin negotiations in October raises the hope that the hit U.S. carmakers’ overseas sales took last year won’t be repeated. With a return to China’s standard 15% duty on foreign car imports in first-half 2019, U.S. exports looked to be recovering, albeit still well off 2017’s peak – as the trade data from Descartes Datamyne summarized in this chart illustrates:
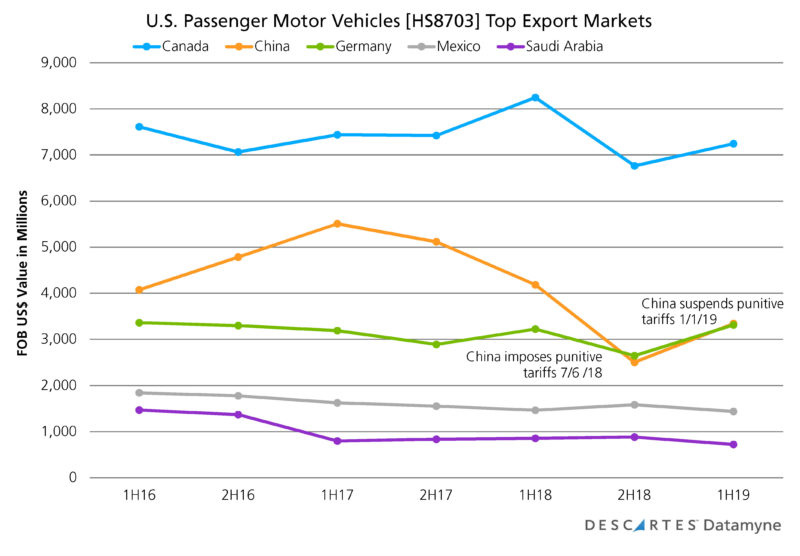 In the wake of the July 6 tariffs, U.S. auto exports to China dropped 40% from the first to the second half of 2018. Exports in 2H18 were 51% off the same period in 2017, and nearly 56% below the 1H17 peak.
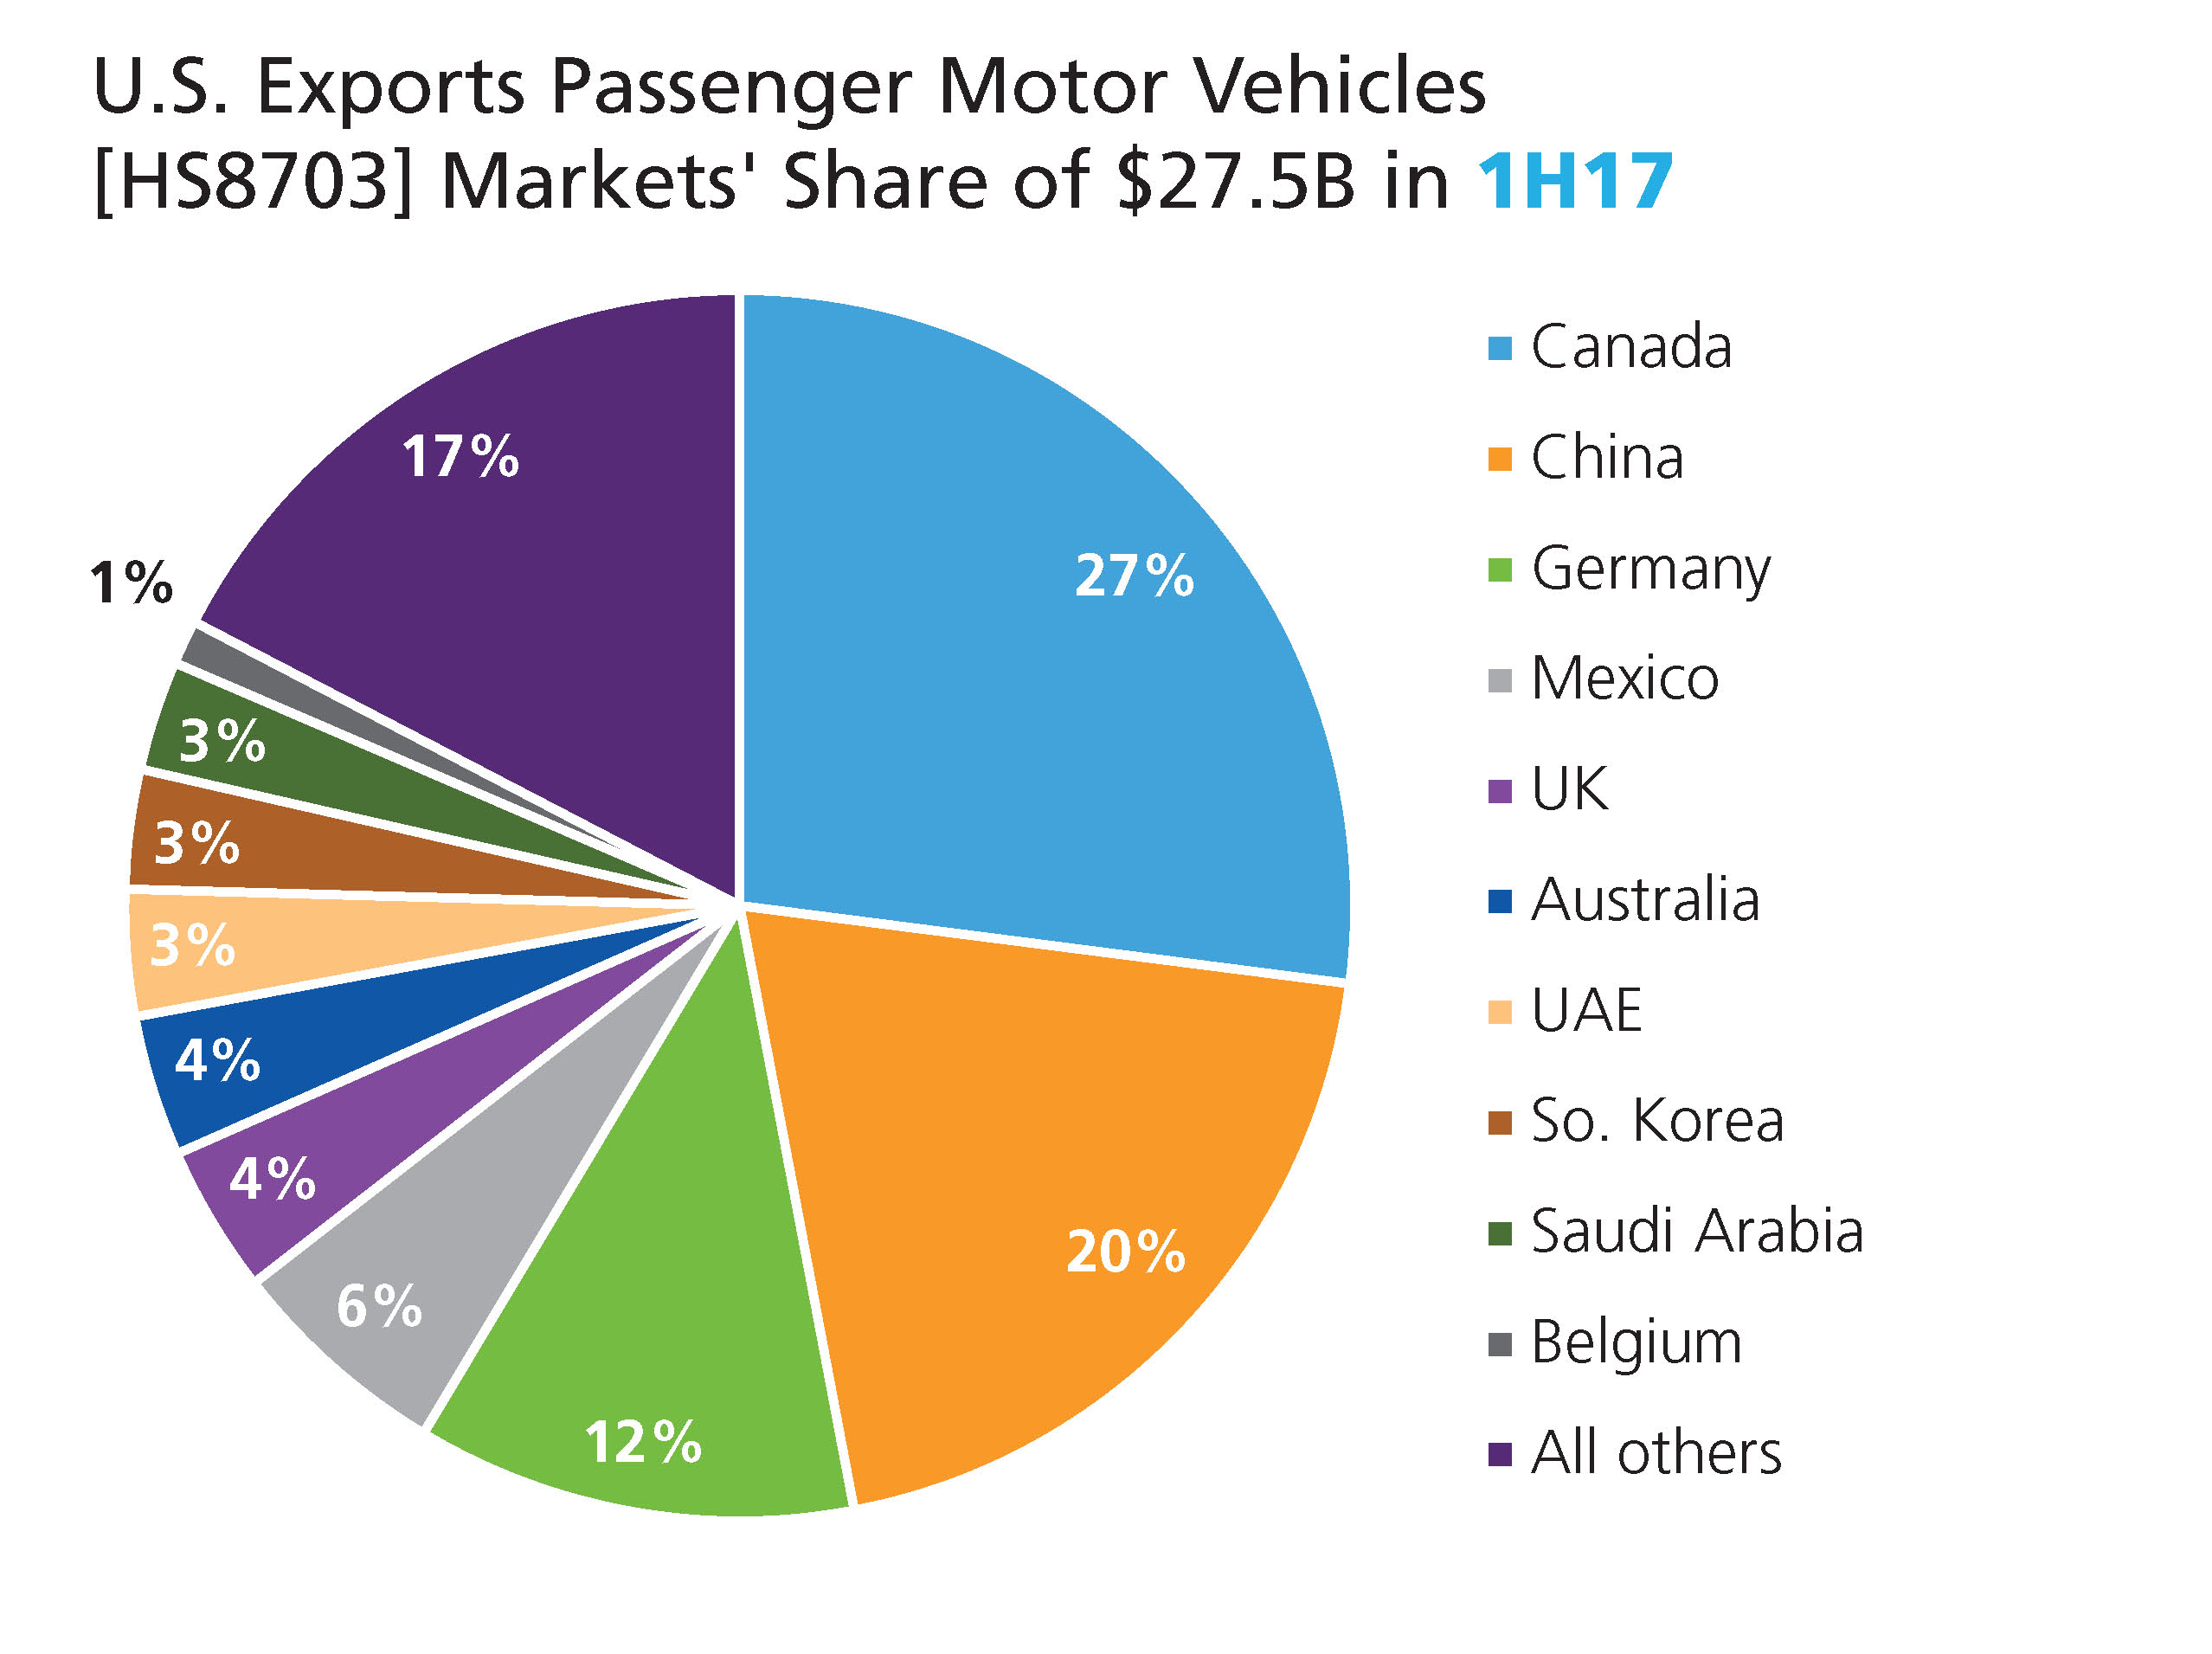
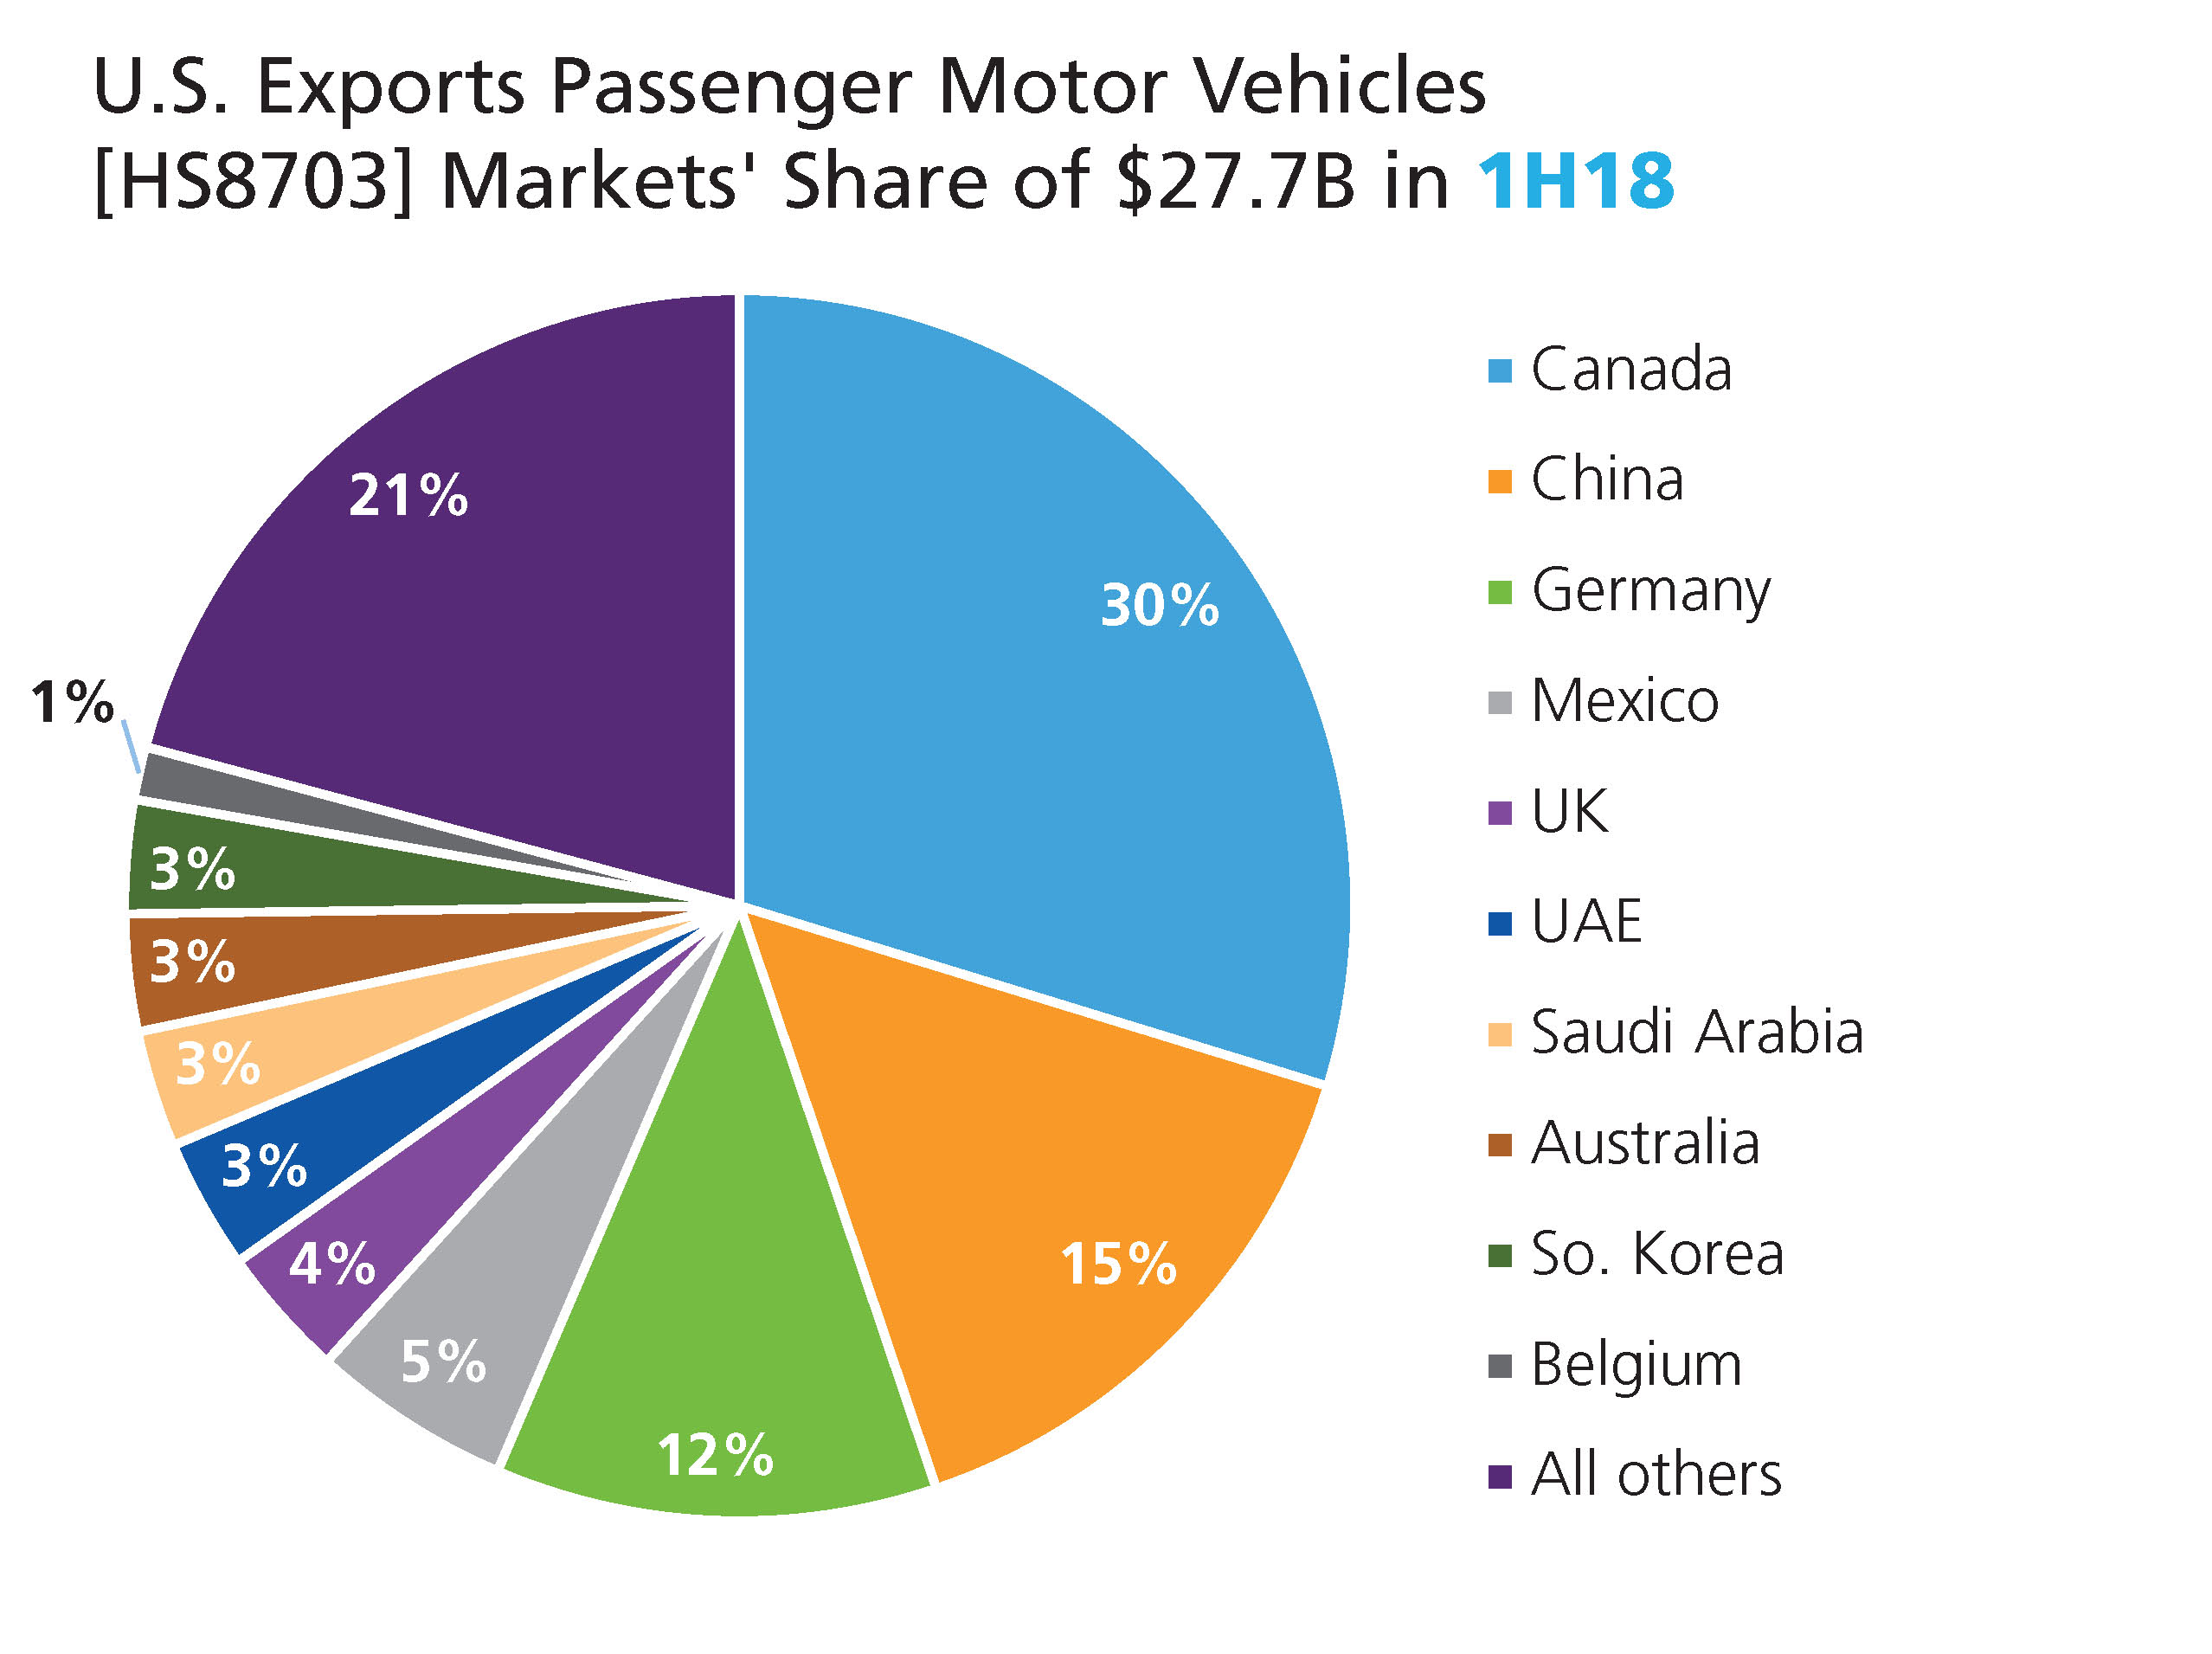
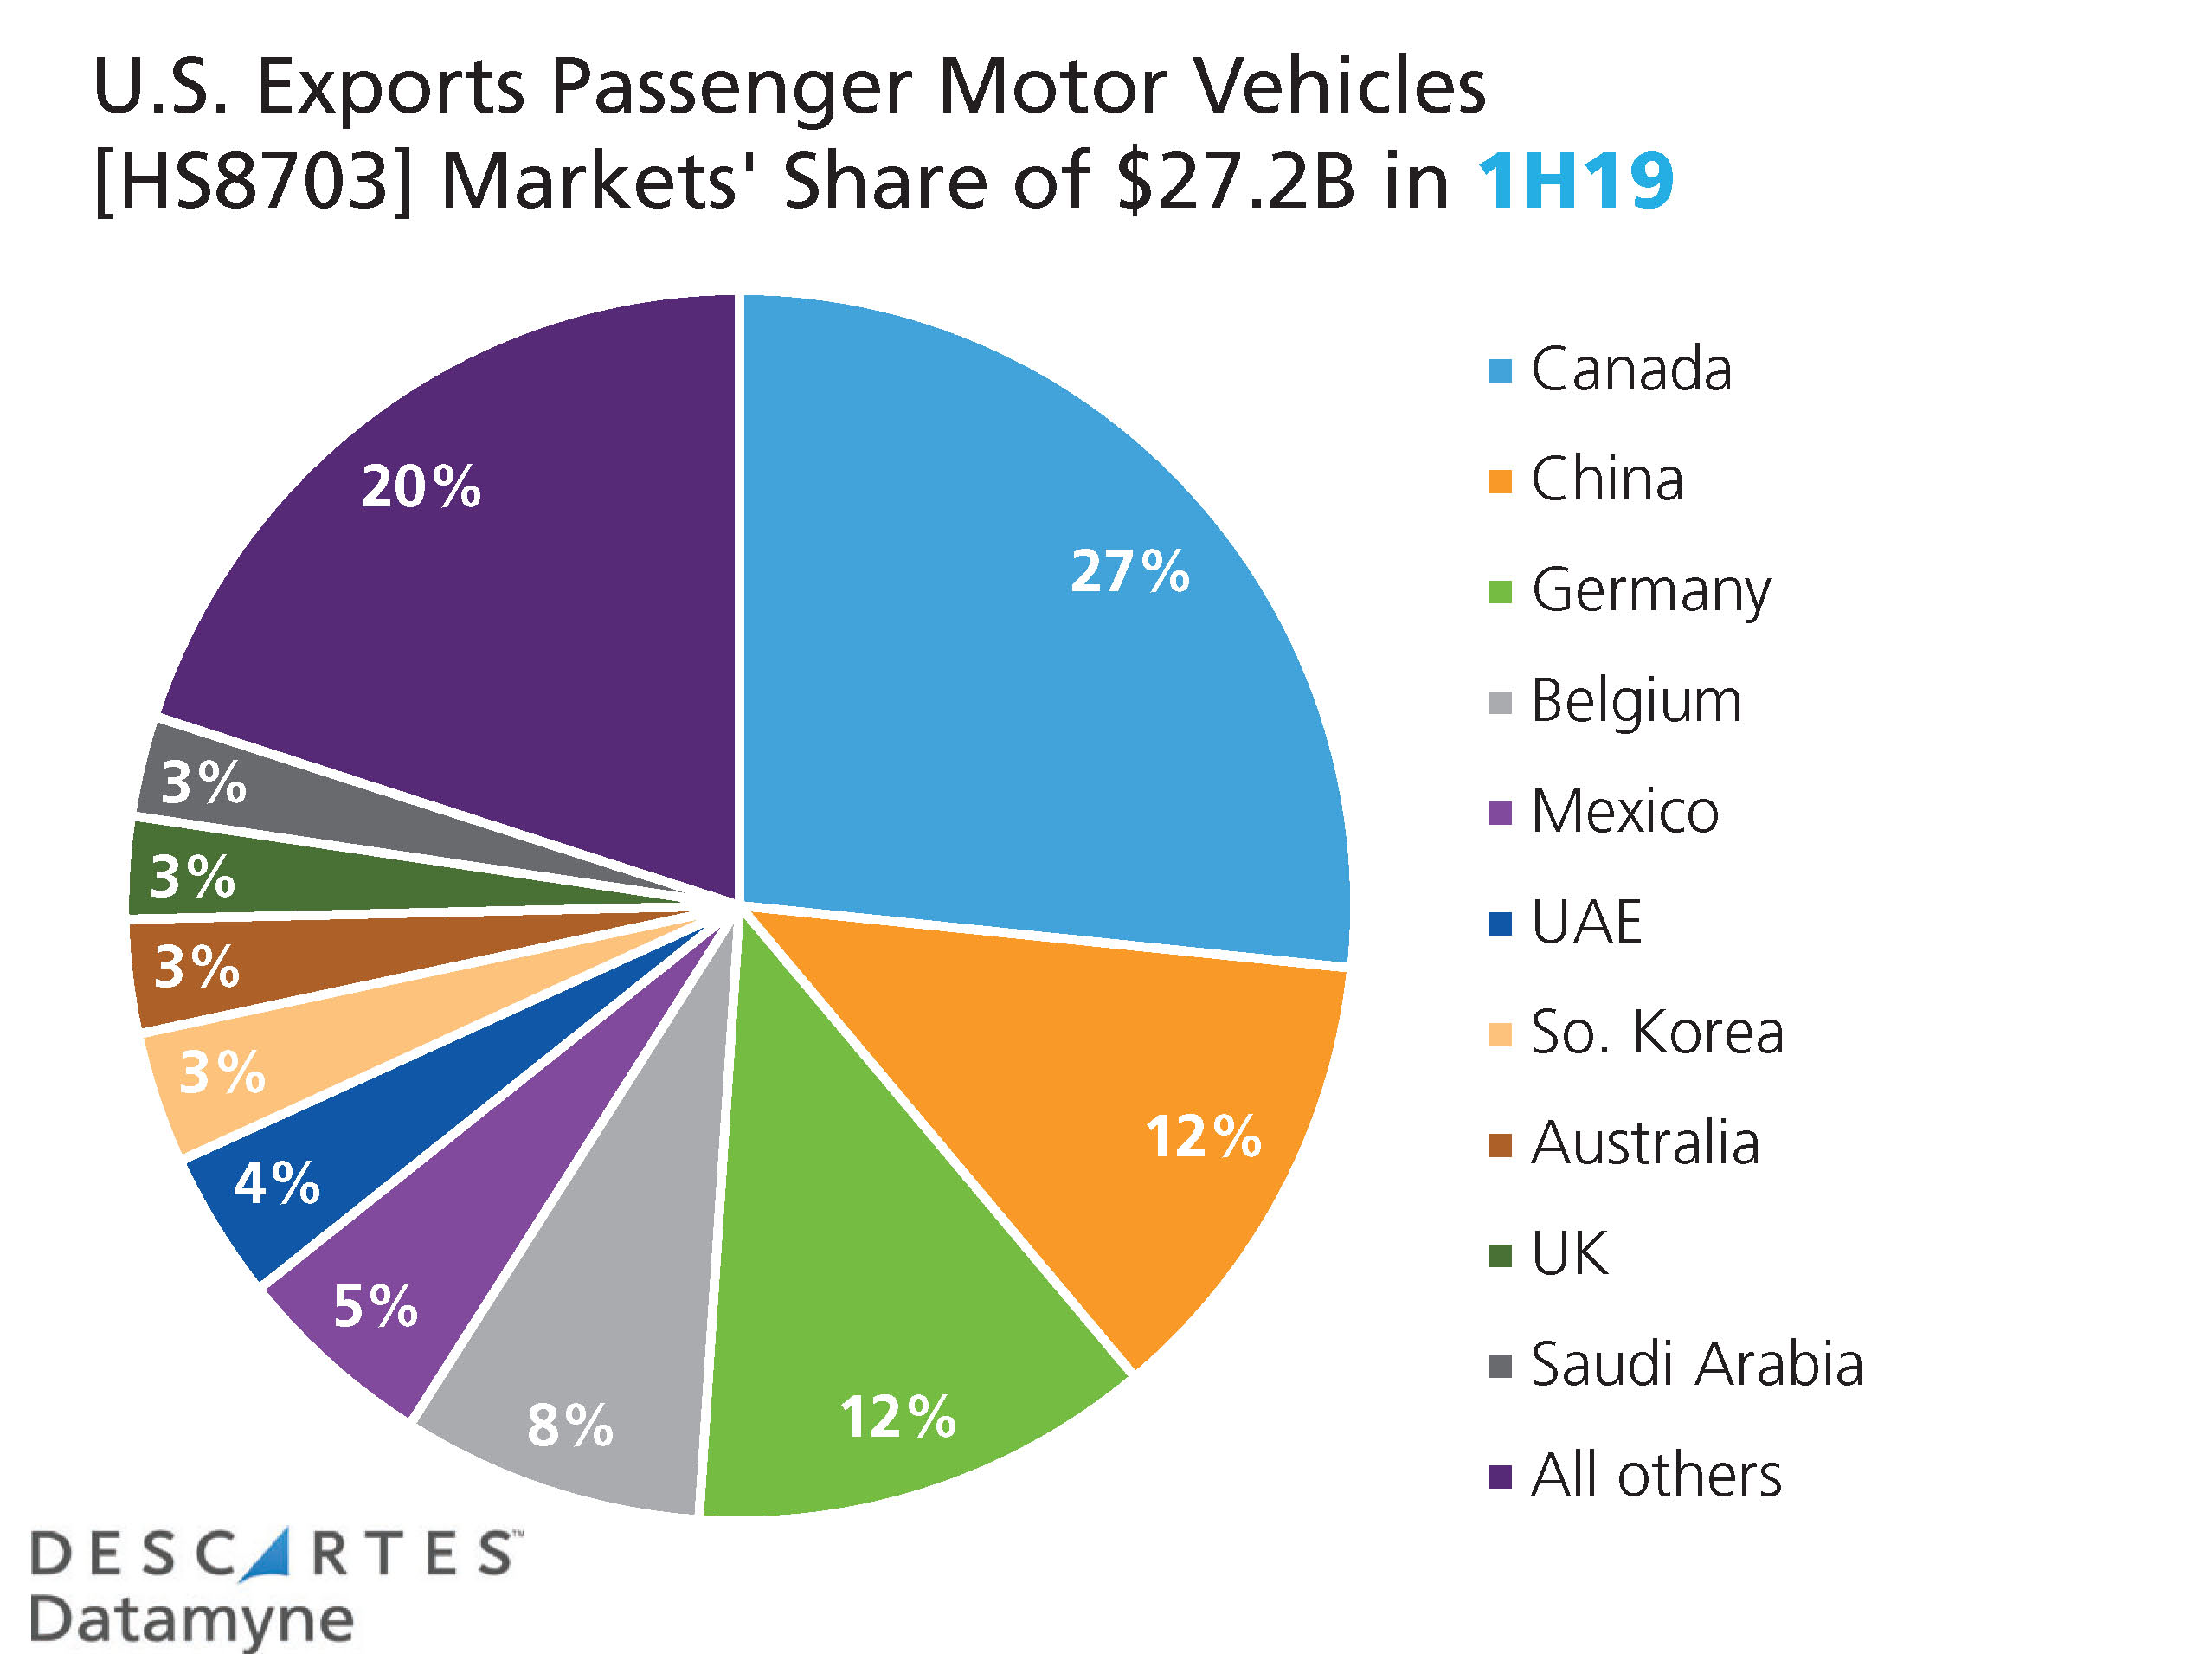
For U.S. auto exports overall, 2H18 declined 14% from the preceding half, down 9% compared with the second half of 2017, and 14% below the 1H17 peak. There simply weren’t enough alternate markets to cover the losses in exports to the second-largest customer for U.S. cars – a clear case for diversification, which appears to be happening as this series of charts comparing U.S. auto export market share across three years illustrates:
Here’s how the rise and tariff-driven fall of U.S. auto exports impacted the top product categories:
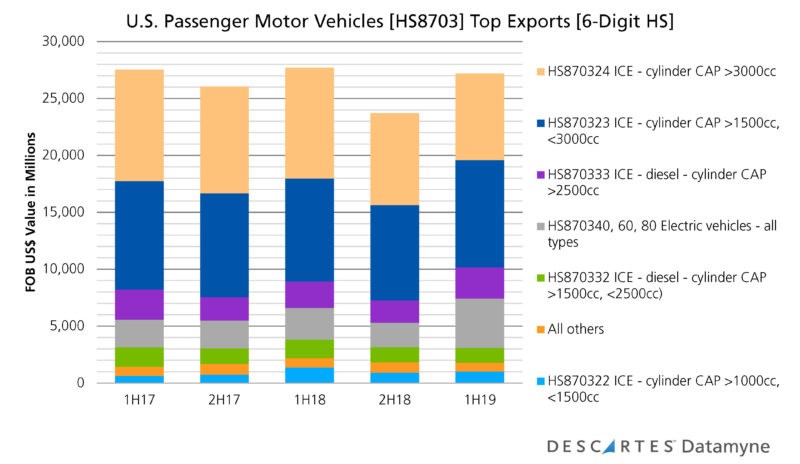 The trade data reveals a significant change in the product mix in the first-half 2019 rebound. While auto exports gained 15% in 1H19 compared with 2H18, most of the major product categories lost share, with some notable exceptions. Big internal combustion engine (ICE) cars [HS870324] that accounted for 34% of total U.S. auto exports in 2H18, saw their share slip six percentage points to 28% in 1H19. Over the same period, the other product categories slipped a fraction of a point. Diesel ICE vehicles with a cylinder capacity greater than 2500cc gained nearly 2%.
U.S. Auto Exports: Electric Vehicles Surge
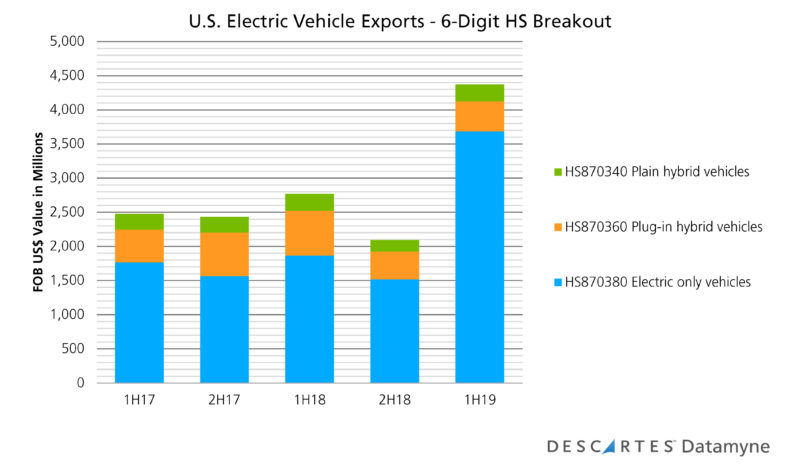
But the biggest gainer was electric vehicles of all types, accounting for 16% of U.S. auto exports in the most recent half compared with 9% in 2H18.
Note that our trade data on electric vehicles begins in 2017. Until then, EVs fell under the all-purpose “Motor Vehicles – Other” code of 870390 in the Harmonized System. The World Customs Organization created not one but three HS codes to distinguish between electric-only cars and two types of hybrids: plain hybrids with batteries that are charged by the car’s ICE and hybrids with batteries recharged by plugging into the electric grid.
These codes enable more refined data that reveals what may prove to be another significant trend. Electric-only vehicles commanded a significantly bigger share of 1H19 EV exports than hybrids, as this chart shows:
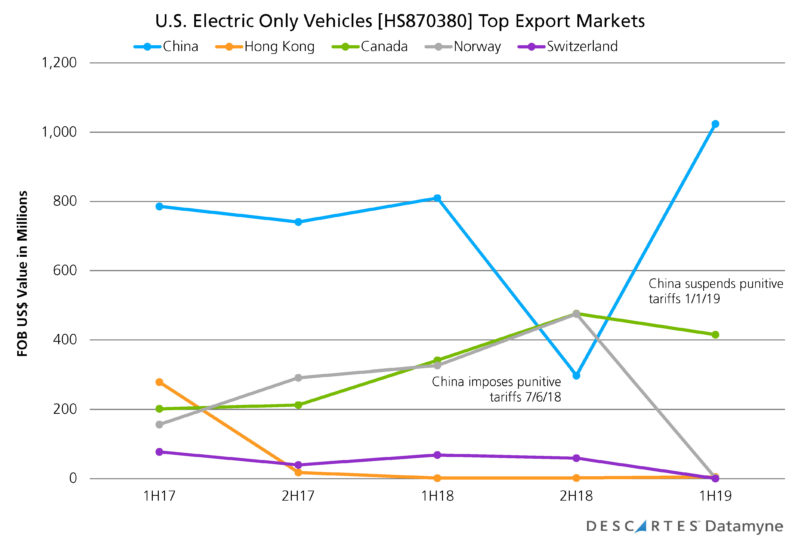
 Our trade data also reveals the primary driver of demand for electric-only vehicles – and why manufacturers of electric-only cars are especially vulnerable to the threatened re-imposition of a punitive tariff by China, the once and likely future top market for their products, as this chart illustrates:
Related:
Blog coverage:
- Truce Called in U.S.-China Trade War
- U.S.-China Trade Tariffs: Costs Start to Mount
- Tariff Changes Take Center Stage for Decision Makers
- U.S. Tariffs on Chinese Goods: Overview and Timeline
Solutions and Resources:
- You can look up these latest waves of U.S. tariffs aimed at China are covered in the Federal Register at 84 FR 43304 and 84 FR 45821. A more practical solution for businesses that operate internationally is Descartes CustomsInfoTM Manager, end-to-end enterprise software for up-to-date tariff classifications. Learn more
- Rapidly evolving trade policy and tariff instability are causing headaches for supply chain managers. Our Tariff Engineering Podcast discusses how companies restructure supply chains and potentially re-classify products to mitigate duty spend. Go to the podcast
- Take a closer look at the effects of the China-U.S. trade war and strategies to diversify supply chains to mitigate risks and improve supply chain resilience in our White Paper: Supply Chain Diversification & The Environment of Change. Download the white paper