


The repercussions from August 12’s deadly Tianjin blast continue to be felt across global supply chains.
Generally ranked among China’s (and by extension the world’s) top 10 ports, Tianjin handled US$45,681,904,539 worth of exports, accounting 6.10% of the country’s waterborne exports, in first-half 2015, and US$36,482,028,89 in imports, or 7.97% of China’s waterborne imports in that period.
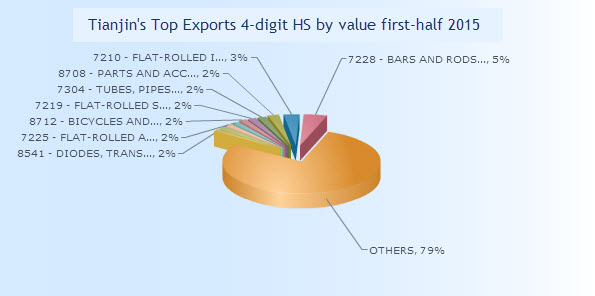
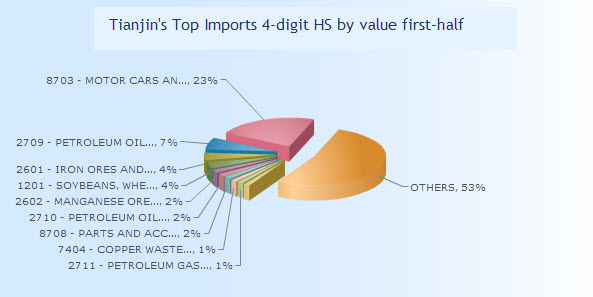
Our trade data on Tianjin, China, shows the import-export commodities which will feel the impact of disruption of the port’s shipments, starting with steel products among exports and raw materials among imports:
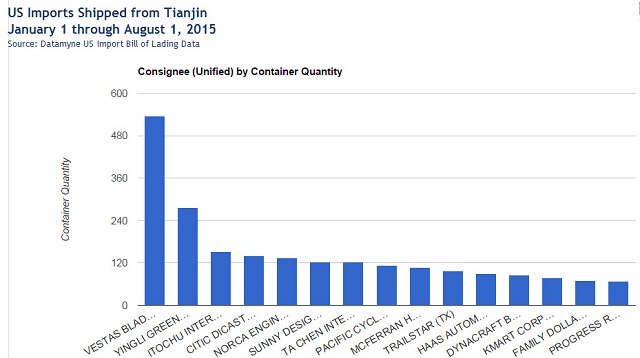
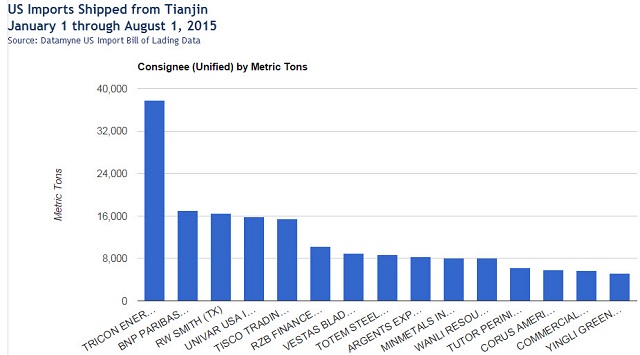
For more detail on US companies likely to be affected, we turned to our bill of lading data. Here, for example, are the top US importers of cargos shipped through Tianjin, ranked by volume in containers and (quite a different list) metric tons:
We have put together a FREE report on US imports shipped through Tianjin, covering top importers, shippers, carriers, with a special section on hazardous materials and hazmat shippers as declared on the bills of lading: Click here to download the report: Quick Look @ US Imports Shipped through Tianjin January 1 through August 1, 2015.