


Surging imports into the U.S. towards the end of the year typically ring up holiday cheer for distributors, retailers and other businesses. But with many ports, especially those along the western seaboard, experiencing severe and sustained congestion, higher volumes could be a double-edged sword.
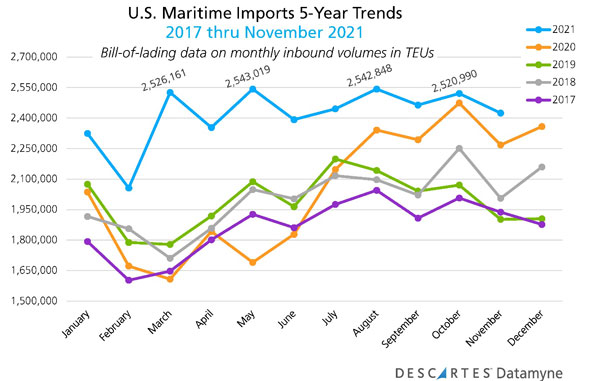
For the second year in a row, global trade data from Descartes Datamyne reveals the coronavirus pandemic upended seasonal shipping patterns. U.S. waterborne import volumes reached their highest level in May, while October saw inbound shipments a fraction of a percent (0.2%) off this year’s peak.
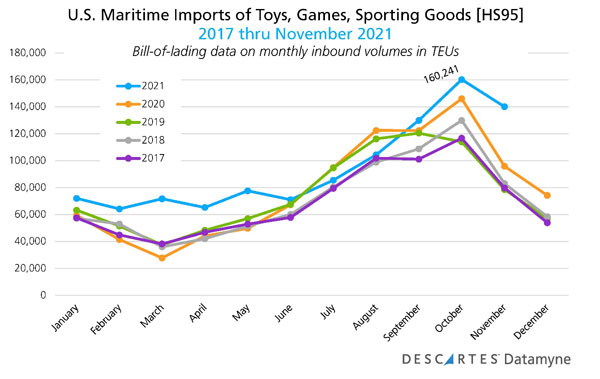
According to U.S. import trade data, derived from Bills of Lading data, the continued uptrend is in part fueled by imports of toys, games, sporting goods, and Christmas decorations covered by items under Harmonized System tariff code 95 (HS95).
As the chart below illustrates, overall October 2021 shipment volumes, measured in 20-foot equivalent units (TEUs), fell below the levels reached in March, May and August, as supply chains were overwhelmed by restocking demand.
Contrast this with imports of the winter holiday giftables and associated seasonal items covered under HS95 As the chart below shows, the pandemic has been no match for the demand for toys for the holidays this year (or last). Pent-up demand does seem to have lifted HS95 imports earlier in the year, and year-end seasonal demand pushed volumes past traditional peaks in October and November.
Unpacking the import cargoes
A late burst of shipments would be good news for holiday shoppers, which in turn would help give a boost to corporate bottom lines. But congested ports which delay the delivery of goods to stores (both real and virtual) is the immediate issue that needs to be looked at.
The Toy Association began sounding the alarm #ShopEarly4Toys well before Halloween, when empty shelf space were already beginning to appear at retailers.
Pandemic-era port congestion, which had already caused production-disruptive shortages and extended delivery delays across a range of bellwether industries was about to hit toys. Consumers were warned not to count on the most sought-after toys being available on Black Friday and not to wait for late-season discounts this year.
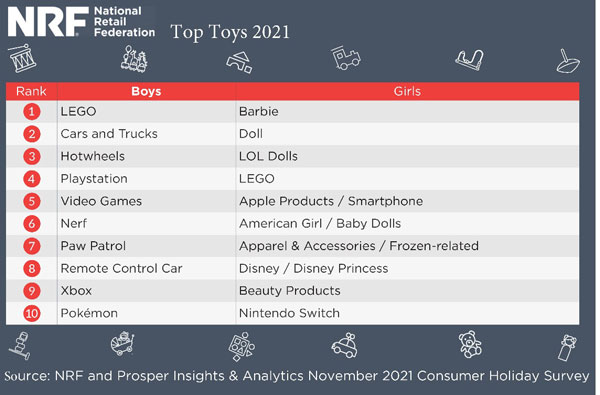
Some shoppers may have taken heed. While holiday sales are forecast to surpass 2020’s by as much as 10.5% by the National Retail Federation, only about 180 million U.S. shoppers hit stores the day after Thanksgiving. That’s down from 186.4 million in 2020 and 189.6 million in 2019, according to the NRF – which also published this wish-list of holiday gifts for boys and girls based on their consumer research (see table below).
End-of-Year Jump in Gift and Holiday-Associated Items
Four 2-digit Harmonized System tariff codes reliably top the rankings of U.S. waterborne imports by volume month after month: HS94 denoting furniture; HS84, the code for machines – including computers; HS39 for articles of plastic; and HS85, electrical and electronic equipment – including TVs. While imports of each of these codes arguably get a boost from seasonal gift-giving, the imports of a fifth code, HS95, covering toys, sports gear, and holiday decorations, are most definitely driven by the season.
HS95 generally starts the calendar year ranked 8th or 9th, according to U.S. Imports trade data, then climbs into the top 5 as the winter holidays approach, contributing about 6% of peak season import volumes. The next charts track these five codes’ share of imports month-by-month, the first through 2020, the second through November of this year (as released two days after month’s end).
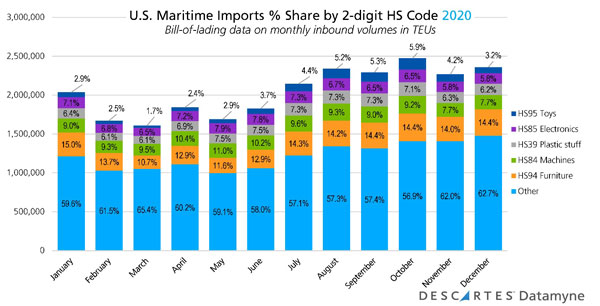
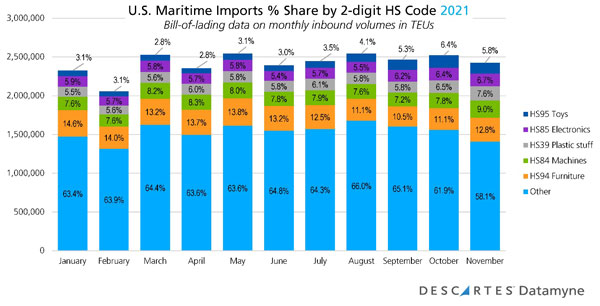
Note that the top 5 HS codes accounted for 43% of peak shipping in 2020 versus 38% in 2021, an indication of some seasonal volume growth potential lost to backlogged shipments. Furniture (HS94) and machines (HS84) ceded the biggest shares, while plastic stuff (HS39), electronics (HS85), and toys (HS95) made modest gains.
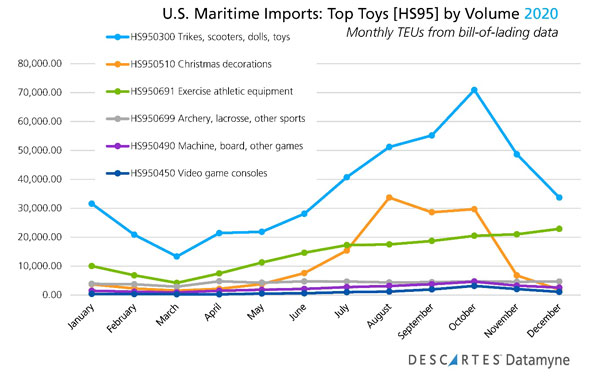
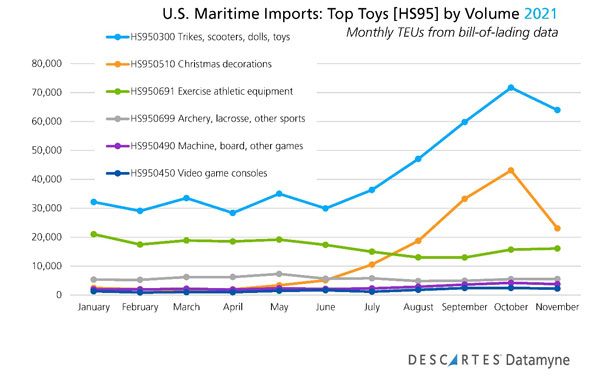
For a more granular view of the seasonal surge in toy imports, here’s a view of U.S. bill of lading data at the 6-digit HS level month-by-month, first tracking 2020 shipments, then 2021’s. (Refer to chart below).
Exercise Equipment Lose Steam as Toys Maintain Momentum
From the above U.S. imports trade data charts, it can be seen that HS950300, covering bicycles, tricycles and other wheeled toys, dolls, playsets and other (generally non-digital) toys, make up about half of all HS95 imports through the year, reaching an unmistakable October peak in 2020 and 2021.
Exercise equipment (HS950691), consumer demand for which got a big boost during pandemic lockdowns in 2020, appears to be losing its appeal (as a holiday gift, at any rate) in 2021.
But the big surprise revealed by Descartes Datamyne U.S. bill of lading data this year is the steady climb to a classic October peak of HS950510 – Christmas decorations, including artificial trees and tree ornaments. While echoing the pattern set by toys, Christmas decorations posted a 45.2% y-o-y gain in TEUs in October, compared to toys’ anemic 1.1% growth, and exercise gear’s -23.4% decline from the same month a year ago.
More U.S. consumers buy a fresh-cut tree than an artificial tree each year. But of the 94 million U.S. households that display a Christmas tree, 85% put up a (reusable) artificial tree for the holidays, according to the American Christmas Tree Association.
Port congestion reroutes trade
China has been and remains far and away the top country of origin for U.S. waterborne imports of HS95 goods: 77% by volume, followed by 7% originating in Hong Kong, so far this year. In 2020, China accounted for 78.5% and Hong Kong 7%; in 2019, 78.7% and 7.9%, respectively.
We looked at global trade data for any indication that shipments might be diverted from the congested ports of San Pedro Bay.
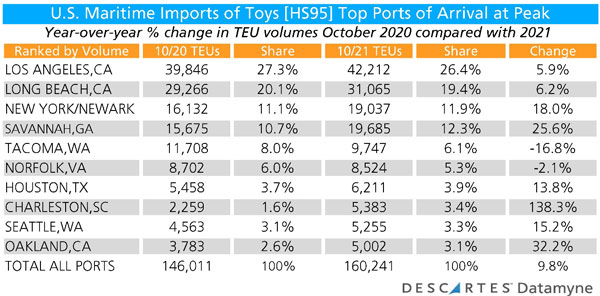
First, for context, this table summarizes the inbound volumes at the top 10 ports of arrival in October 2021 versus October 2020:
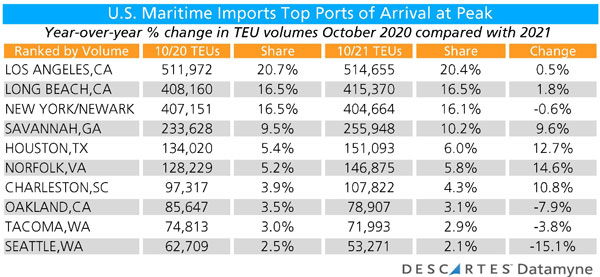
For the top three ports, Los Angeles, Long Beach and New York-New Jersey, accounting for 53% of U.S. waterborne imports in October, there was fractional change in share and near flat growth in TEUs compared with a year ago. The East Coast ports of Savannah, Norfolk, and Charleston, as well as Houston on the Gulf, posted healthy gains in TEUs handled, from 9.6% for Savannah to 14.6% for Houston, while their increased share was relatively modest. Meanwhile, the West Coast ports of Oakland, Tacoma, and Seattle saw their shares shrink and TEUs decline, from Tacoma’s -3.8% loss to Seattle’s -15.1% drop.
A prime factor in the top ports’ gains or losses in October is the shortage of truckers to move cargoes inland and out of port facilities. A problem that began at ports in California has spread and intensified along the West Coast and continues to cascade East. In mid-October, carriers announced they would be bypassing Savannah in favor of Charleston and Jacksonville due to congestion. At month’s end, carriers announced they would be dropping the Port of Seattle from scheduled service for the same reason.
Our bill-of-lading data for HS95 shipments shows more significant shifts in arrivals, as the chart below illustrates.
Note that the Port of New York-New Jersey, ranked third among destinations for toys in 2020, slipped to fourth place behind Savannah this October. Of the ports clocking the biggest percentage y-o-y gain in cargoes of toys, sporting goods, and decorations, HS95 imports accounted for 7.7% of all imports, 6.3% of cargoes received at Oakland, and 5% of inbound shipments at Charleston.
How Organizations Can Handle Supply Chain Disruptions
The global supply chain congestion is a challenging issue affecting international companies looking for ways on how to handle supply chain disruptions and shipping delays. Descartes Datamyne provides in-depth business intelligence with comprehensive, accurate, up-to-date, global trade data and information that helps organizations efficiently address shipping delays and enhance supply chain resiliency in the short and long terms.
Our business intelligence saves organizations significant time in accessing in-depth market insights and identifying new suppliers, trade lanes, markets, and customers.
Datamyne’s multinational trade data assets covering 230 markets around the world, including China, Latin America and the EU.