


Global trade trends show that U.S. imports surged in the run-up to the holidays. But after nine months of pandemic shut-downs, following on a year of trade dampening tariffs, the fall’s record volumes are largely making up for the losses in the spring. 2020’s year-end TEU tally is likely to fall short of last year’s mark. Among the exceptions are home exercise equipment and the just-launched next-gen video game consoles, which is this year’s must-have toy.
’Tis the season for decking the halls, making merry and playing Santa. Retailers stocking up for the year’s peak shopping season traditionally boost waterborne shipments of U.S. imports – most from Asia – beginning in August and reaching a peak in October.
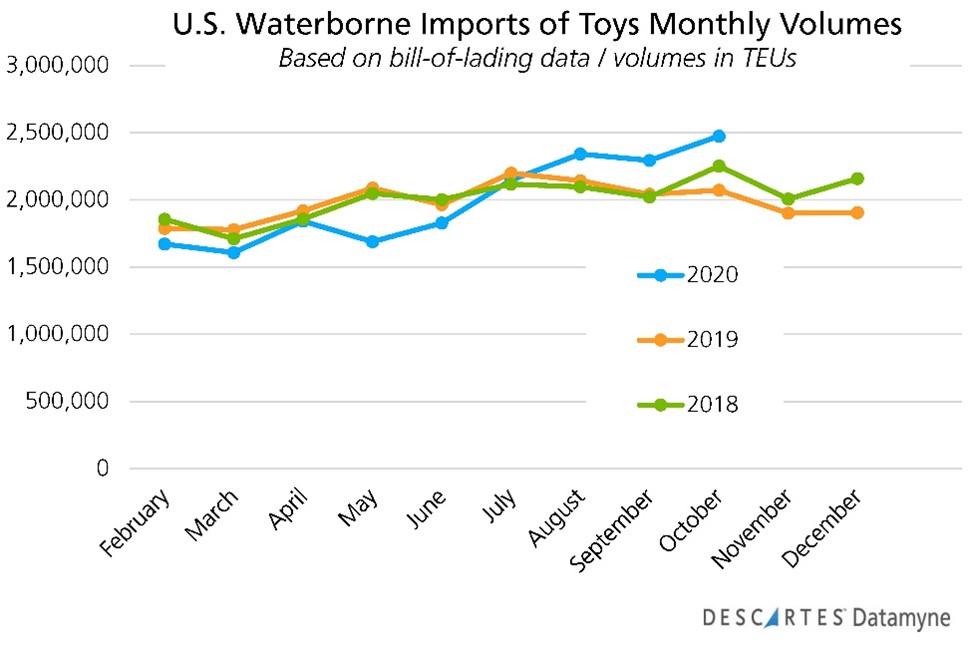
In keeping with the peak-season tradition, Descartes Datamyne bill of lading data for imports shows inbound shipment volumes, as measured in 20-foot-equivalent units or TEUs, on course to break peak season records. An early tally of October bills comes in at nearly 2.5 million TEUs. That’s a full 19% increase over the same month’s volume a year ago and a healthy gain of 9.5% over October 2018.
But 2020’s imports have followed a distinctly different pattern from the traditional global trade trendline last seen in 2017 – as this graph illustrates:
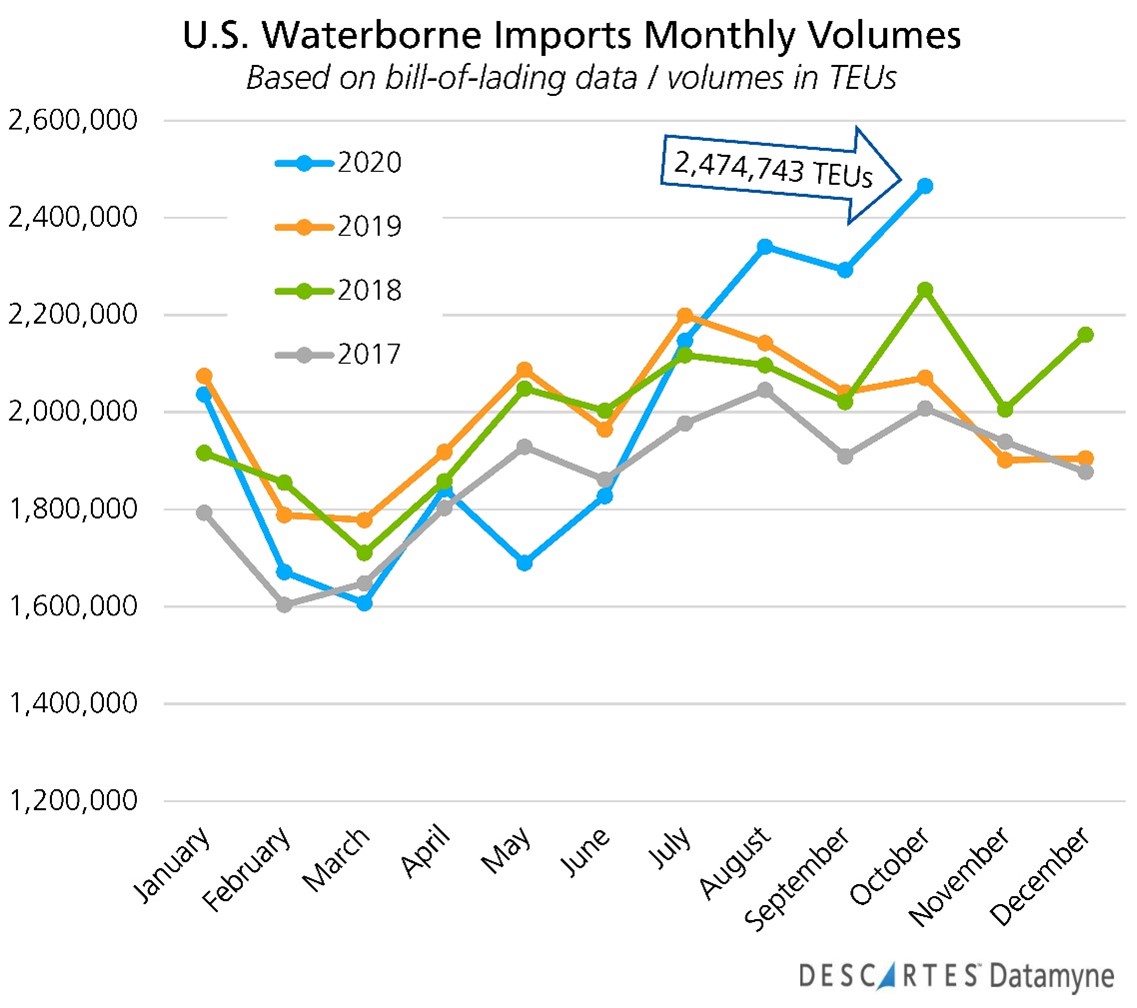
In 2018 and 2019, the U.S.-China exchange of punitive tariffs instead of trade goods disrupted the seasonal shipping pattern.
In 2020, COVID-19 again shifted global trade patterns, effectively throttling U.S. imports through July. While the resurgence in shipping that began in August is on track to produce a record peak, much of the gain is reclaiming ground lost to the pandemic, as the next graph illustrates:
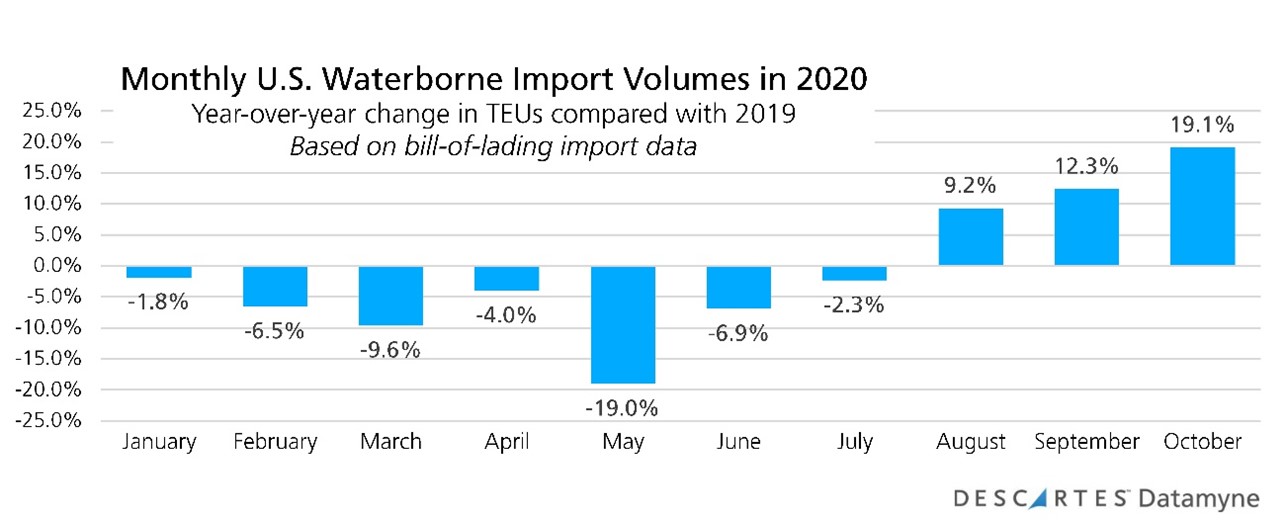
At the close of 2020, import volumes look likely to finish roughly even with or behind 2019’s inbound shipping. Our bill-of-lading data for January through October shows TEUs down 0.7% compared with the same period in 2019.
Not surprisingly, pandemic-related shut-downs have pushed shipments in the top containerized import product categories (as denoted by two-digit harmonized system tariff codes) to peak in October, as shown here:
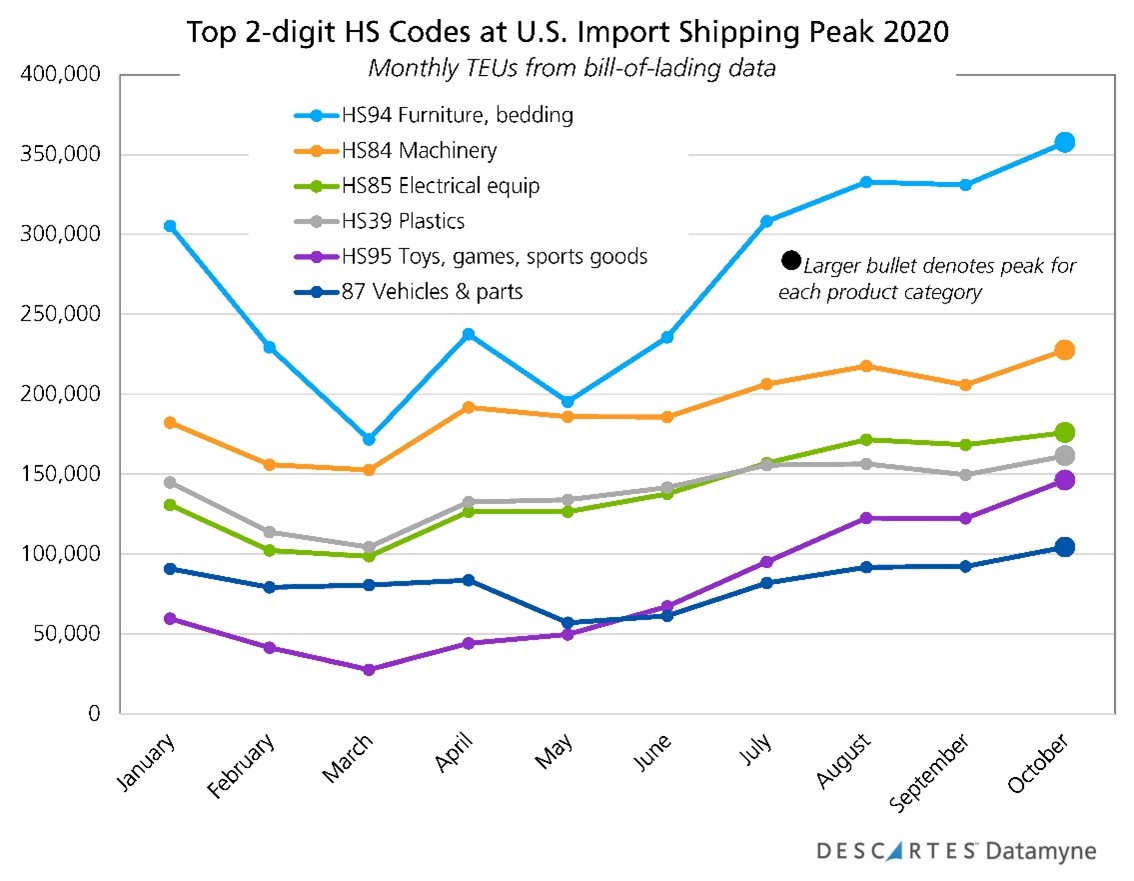
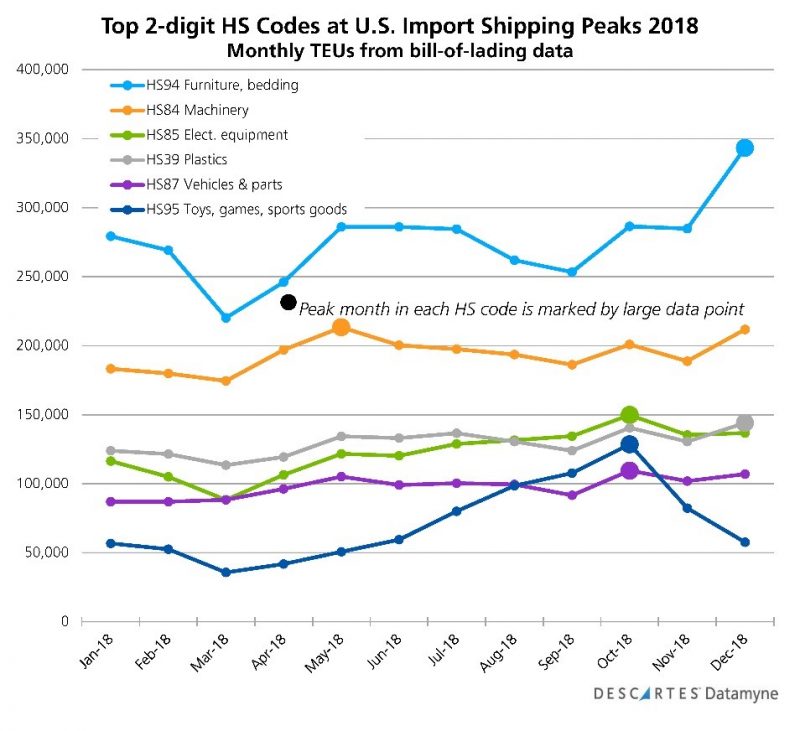
In past years (see 2018, for example) machinery (HS84) peaked in the spring, while furniture (HS94) and plastics (HS39) crested at year-end. Electronics (HS85), toys (HS95) and cars (HS87) – generally in that order – reached top volumes in October.
Unpacking toy shipments
Among the top import product categories, HS95 – Toys, games, sports equipment – this year followed the steepest volume growth trajectory, with October’s TEUs nearly 145% higher than January’s. By comparison, October TEUs for volume leader HS94 – Furniture – are 16.8% above January’s level. (More about furniture imports below.)
Toys rocketing to the top ranks of U.S. imports in October in time for December gift-giving is to be expected. But this year’s surge in toys appears to follow the larger global trade trend of mostly making up for depressed shipments in spring, as the graph shows:
Roughly half of U.S. toy imports, in all seasons, are accounted for by old-fashioned (read: non-digital) children’s toys – tricycles, scooters, and other wheeled toys; dolls and plush animals; puzzles and other playthings. Here’s the breakout of HS95 TEUs at the 6-digit HS code level:

Note: video game consoles rank sixth among U.S. toy imports by volume, according to Bill of Lading data. We are particularly interested in shipping data on this product because two of the industry’s top rivals targeted this November to launch their next-generation consoles.
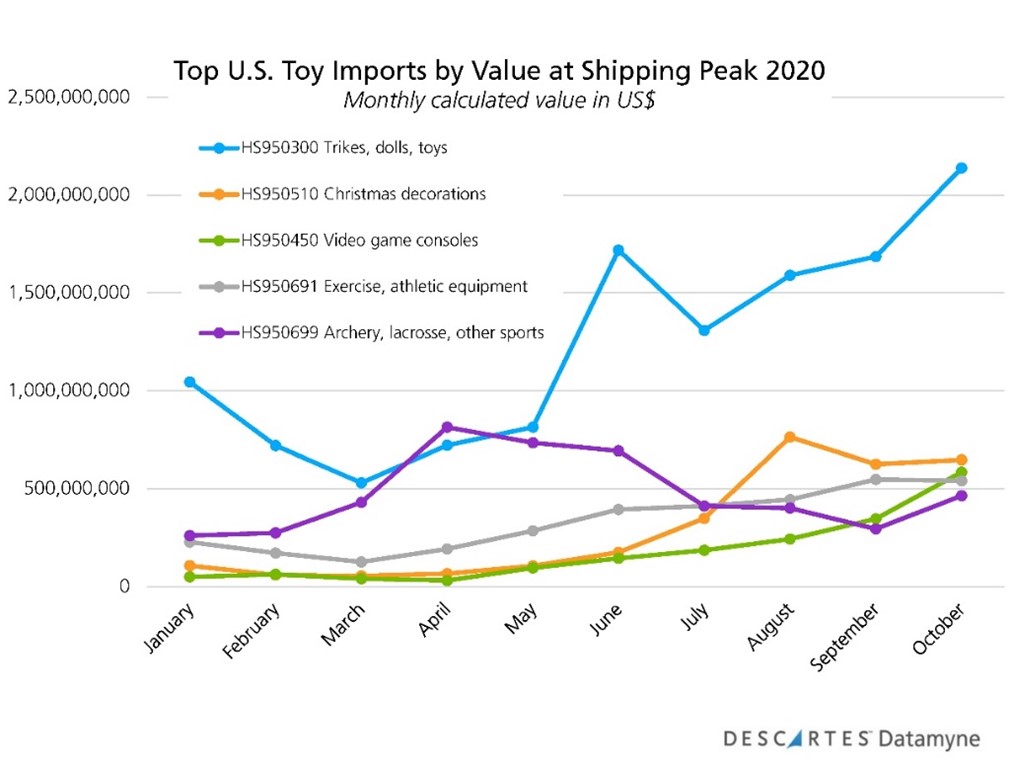
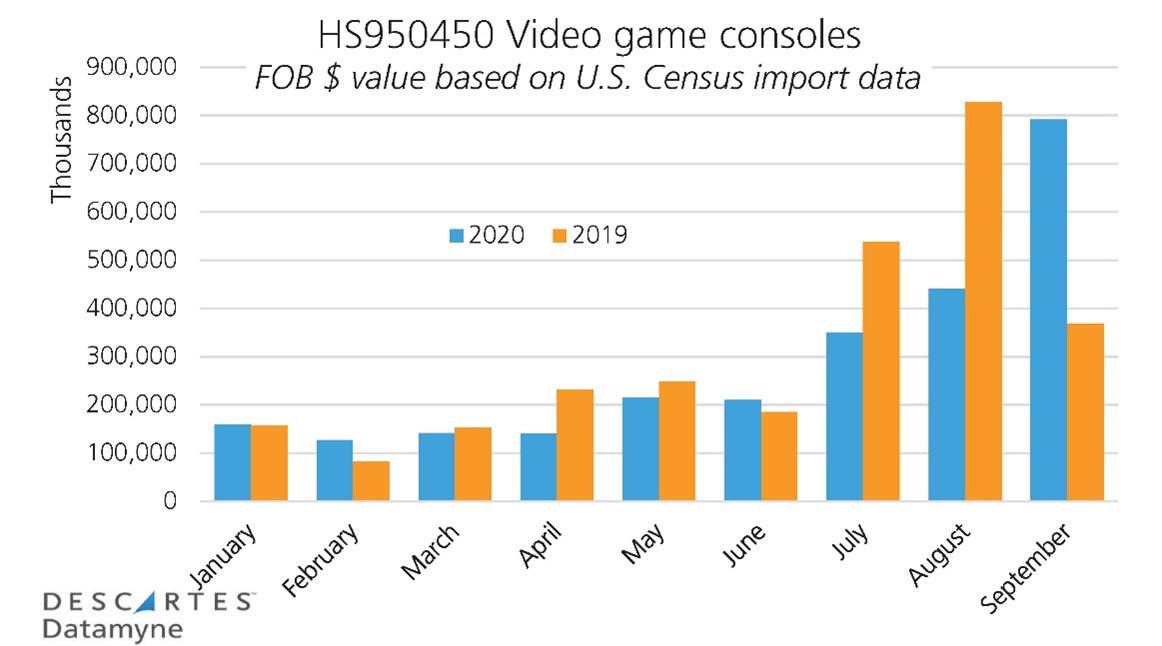
An upward turn in game console shipments beginning in summer and accelerating in fall is discernible in the graph of TEUs. However, for this less bulky but pricier cargo, we also want to look at our bill-of-lading data’s calculated values. As measured in dollars, a more pronounced surge lifts game consoles to the third-ranked toy import in October, as this graph shows:
The year-over-year comparisons of both volume and value of U.S. game console imports further indicate that this year’s late peak is not on-trend with last year’s seasonal shipping pattern:

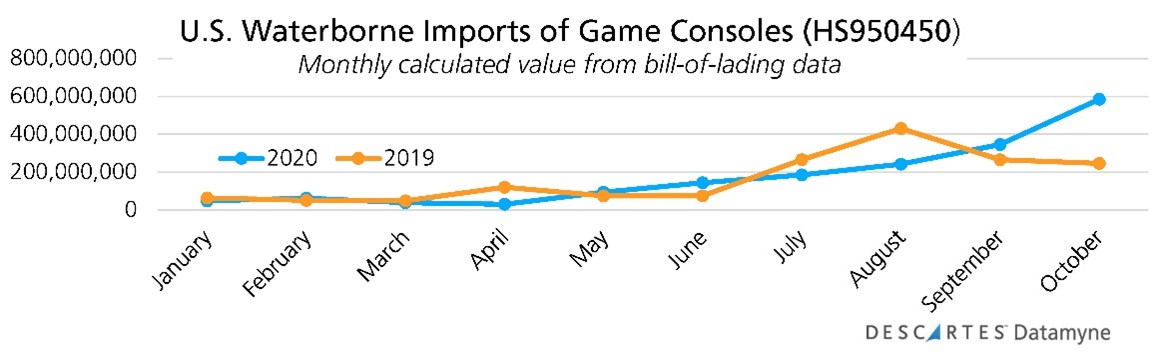
This does not look like a recovery of sales deferred during the spring’s lockdowns. This is a surge to meet fresh demand for long-awaited, next-general video game consoles. (It might be added that supplies are reportedly well below demand, and shortages are expected through the first quarter of 2021, both in the U.S. and markets around the world.)
While our bill of lading data can yield additional details on containerized trade, down to the level of individual shipments between shippers and consignees, and as soon as two days after cargos arrive in port, Descartes Datamyne Census data can supply a broader context for this trade.
Here, for instance, our Census data yields further evidence that new market demand, rather than recovery of deferred supply, is at work in boosting peak shipments. Compare the value of trade in the top four toy products month-by-month this year versus last:
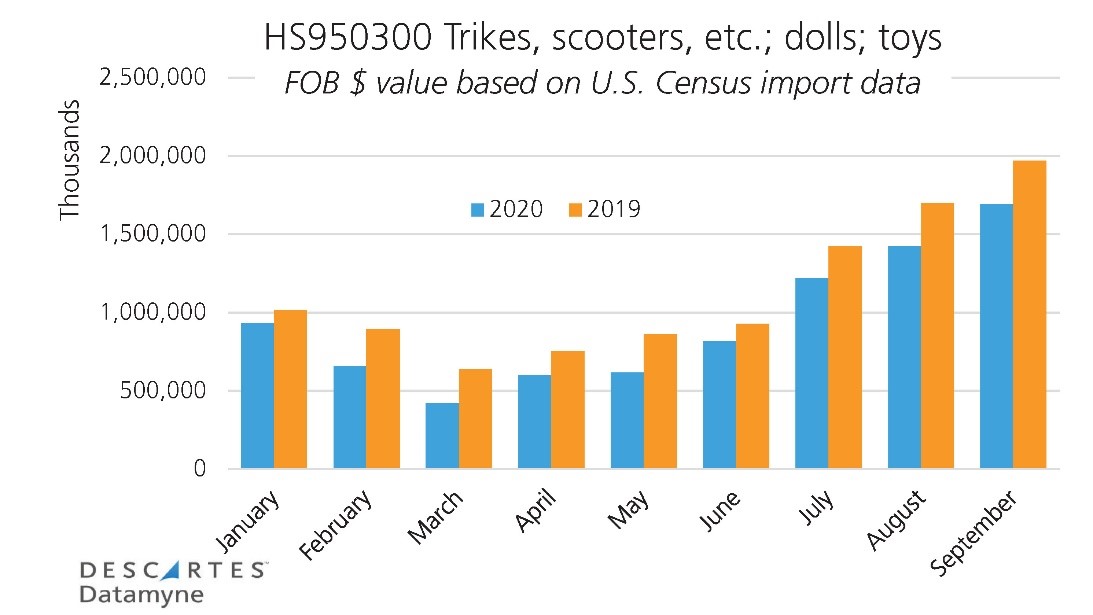

As with maritime shipping volumes overall, the seasonal spike in imports appears to be making up for lost ground in children’s toys and holiday decorations, but not enough to best last year’s performance. These exceptions standout:
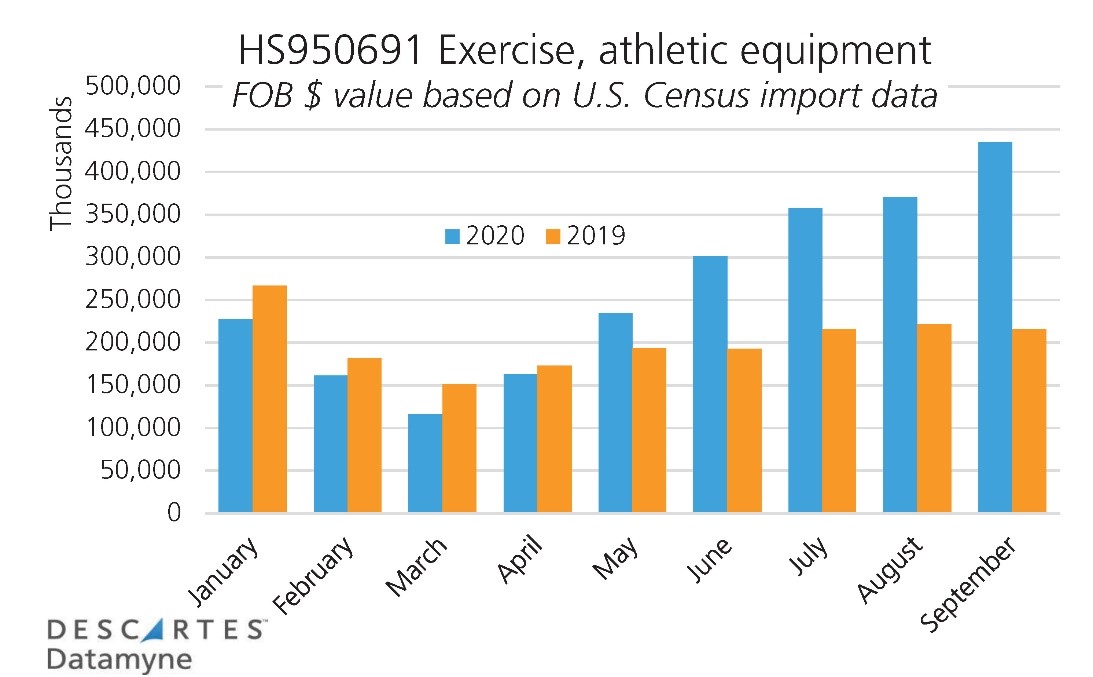
Exercise equipment began to climb in May as the pandemic put gyms off-limits and people began working out at home and has risen steadily to double in volume in September year-over-year. Video game consoles spiked (up 115% y-o-y) in September on the push to stock the new products ahead of their November roll-out.
Our bill-of-lading data establishes China as the pre-eminent source of containerized toy imports – 39% of the overall product category (HS95) and 76.6% of children’s toys (HS950300) on average in the first 10 months of 2020.
Our Census data-based grid offers additional insight into the countries active in this trade:
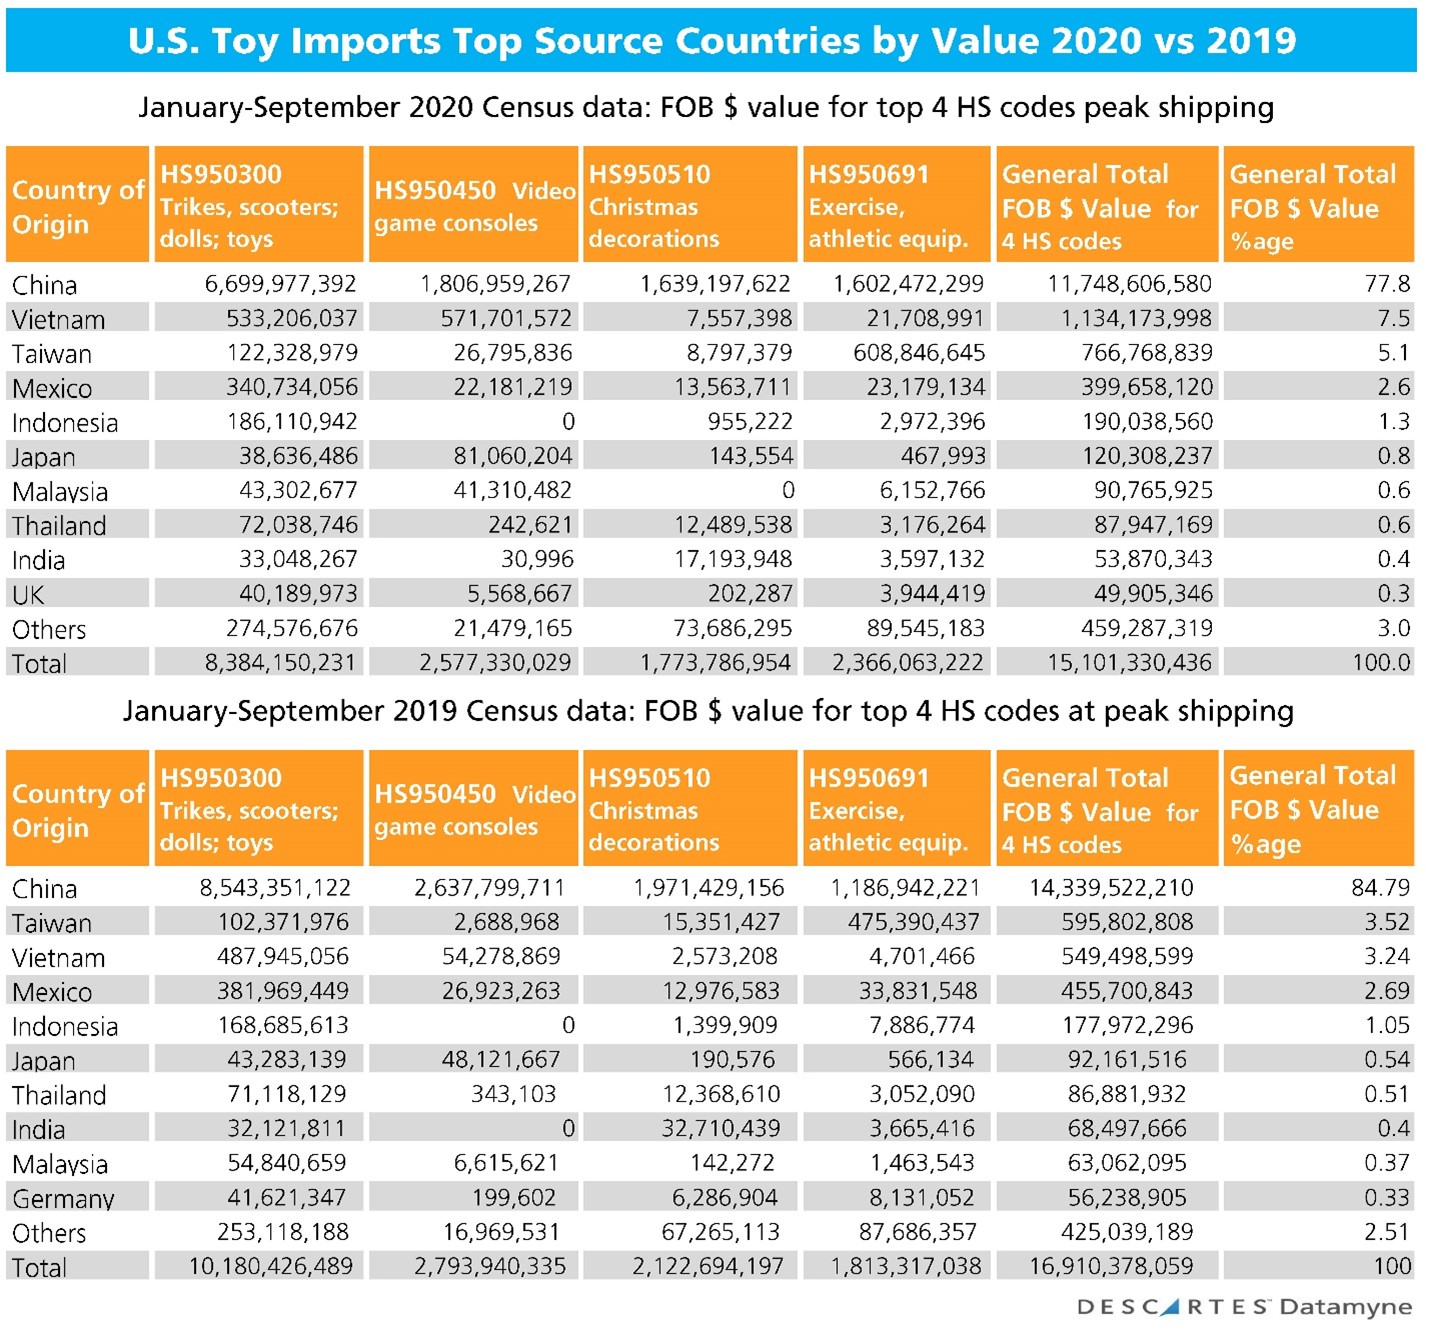
Note: the comparison here focuses on value of trade from January through September 2020, the latest available Census data as of this writing, versus the same nine-month period in 2019.
This data reveals a shift in video console sourcing. Not so long ago, virtually all game consoles in America were made in China. Last year the third major player in the gaming device space announced it was moving production of its handheld console to Vietnam – largely due to price-boosting U.S. tariffs on HS950450 products imported from China.
The Census data covers imports that arrive in the U.S. via plane, truck or rail, as well as by sea. The inclusion of intra-continental shipments brings Mexico into the ranks of top sources. According to our Mexican data, 74.5% of this country’s total exports to the U.S. traveled by road, 12.9% shipped by rail, 9.0% were waterborne, and 3.5% by air so far this year.
The eagerly awaited game consoles provide yet another reason to keep an eye on the Census data: One console maker has reportedly turned to expensive air cargo to get its product to the hotly contested U.S. market ahead of the competition.
Tracking centers of production
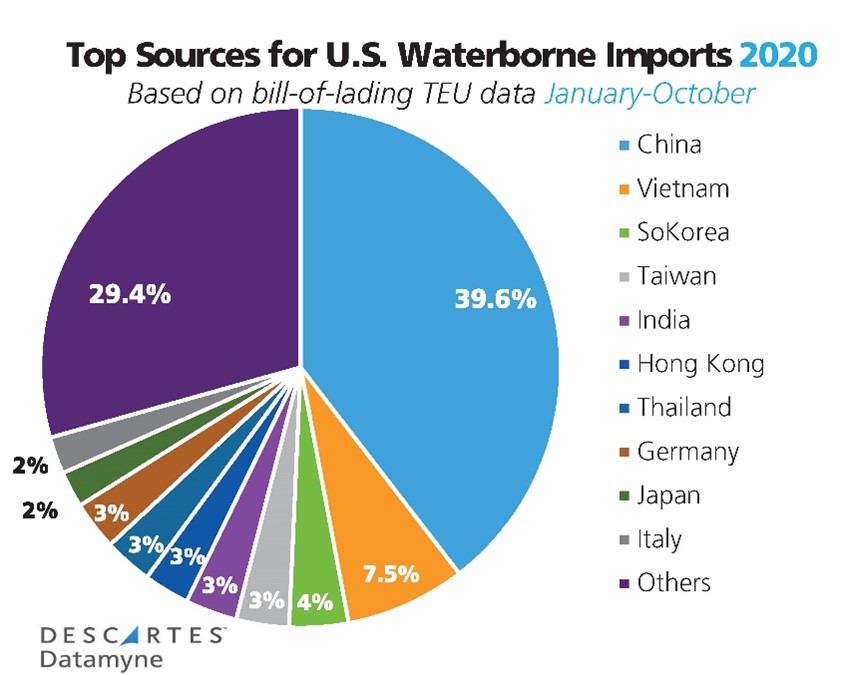
China’s pre-eminence as a source for U.S. waterborne import is not limited to toys. Current data shows China is still the one country sending the most shipments to U.S. ports. The pandemic didn’t move the needle much on China’s share of U.S. import TEUs, which accounted for 40.2% of volume in 2019 versus 39.6% in the first 10 months of 2020, as the next charts summarize:

But a closer look at multiple data views reveals shifts in centers of production are underway. We used both bill-of-lading and Census data to pinpoint changes in furniture, the peak shipping season’s leading product category based on volumes as well as the biggest gainer year-over-year in TEUs in October, up 39% over the same month in 2019.
Furniture’s autumn surge has been driven by pent-up demand following a steep downturn in sales in the spring. Retail orders fell in April (as much as 66%, according to The Street) the month lock-downs took effect coast-to-coast. However, as the Home Furnishings Associations reports, a rebound in orders began in May and has strengthened in subsequent months. More worrying to merchants has been the need to push back delivery times by weeks due to global supply chain disruptions. Imports account for some 70% of the furniture business in the U.S.
China has long been the top country of origin for U.S. waterborne imports of furniture; its nearest rival is Vietnam. Descartes Datamyne bill-of-lading data indicates China’s share of TEUs has slipped from 65.4% in 2018 to 57% in 2019. As of the end of October, China accounts for 51% of this year’s furniture shipments.
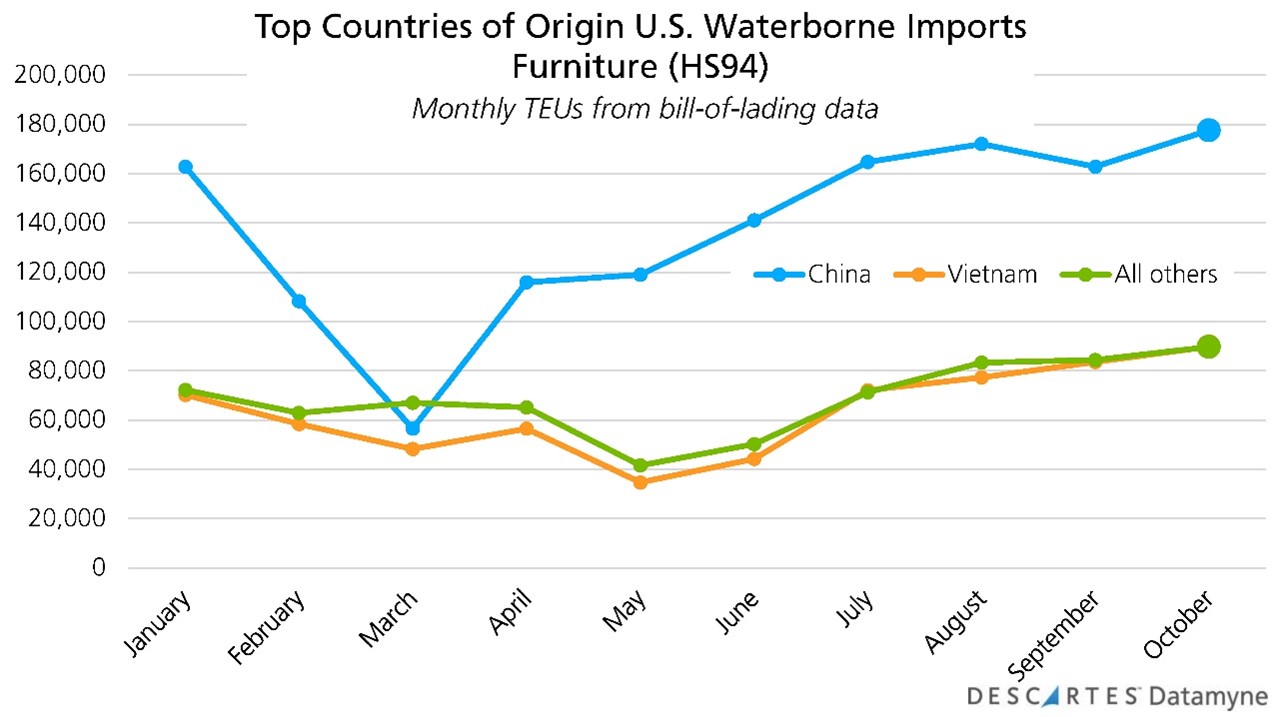
We used the bill-of-lading data to identify the top four products (denoted by 6-digit HS code) driving this fall’s surge in maritime imports of furniture for a closer look. Together, they account for more than half of the furniture TEUs that arrived at U.S. ports in October. Then, based on our Census data, we ranked the country sources for these imports by share of value, and compared this year’s results to date with those of 2019, as summarized in the following grid:
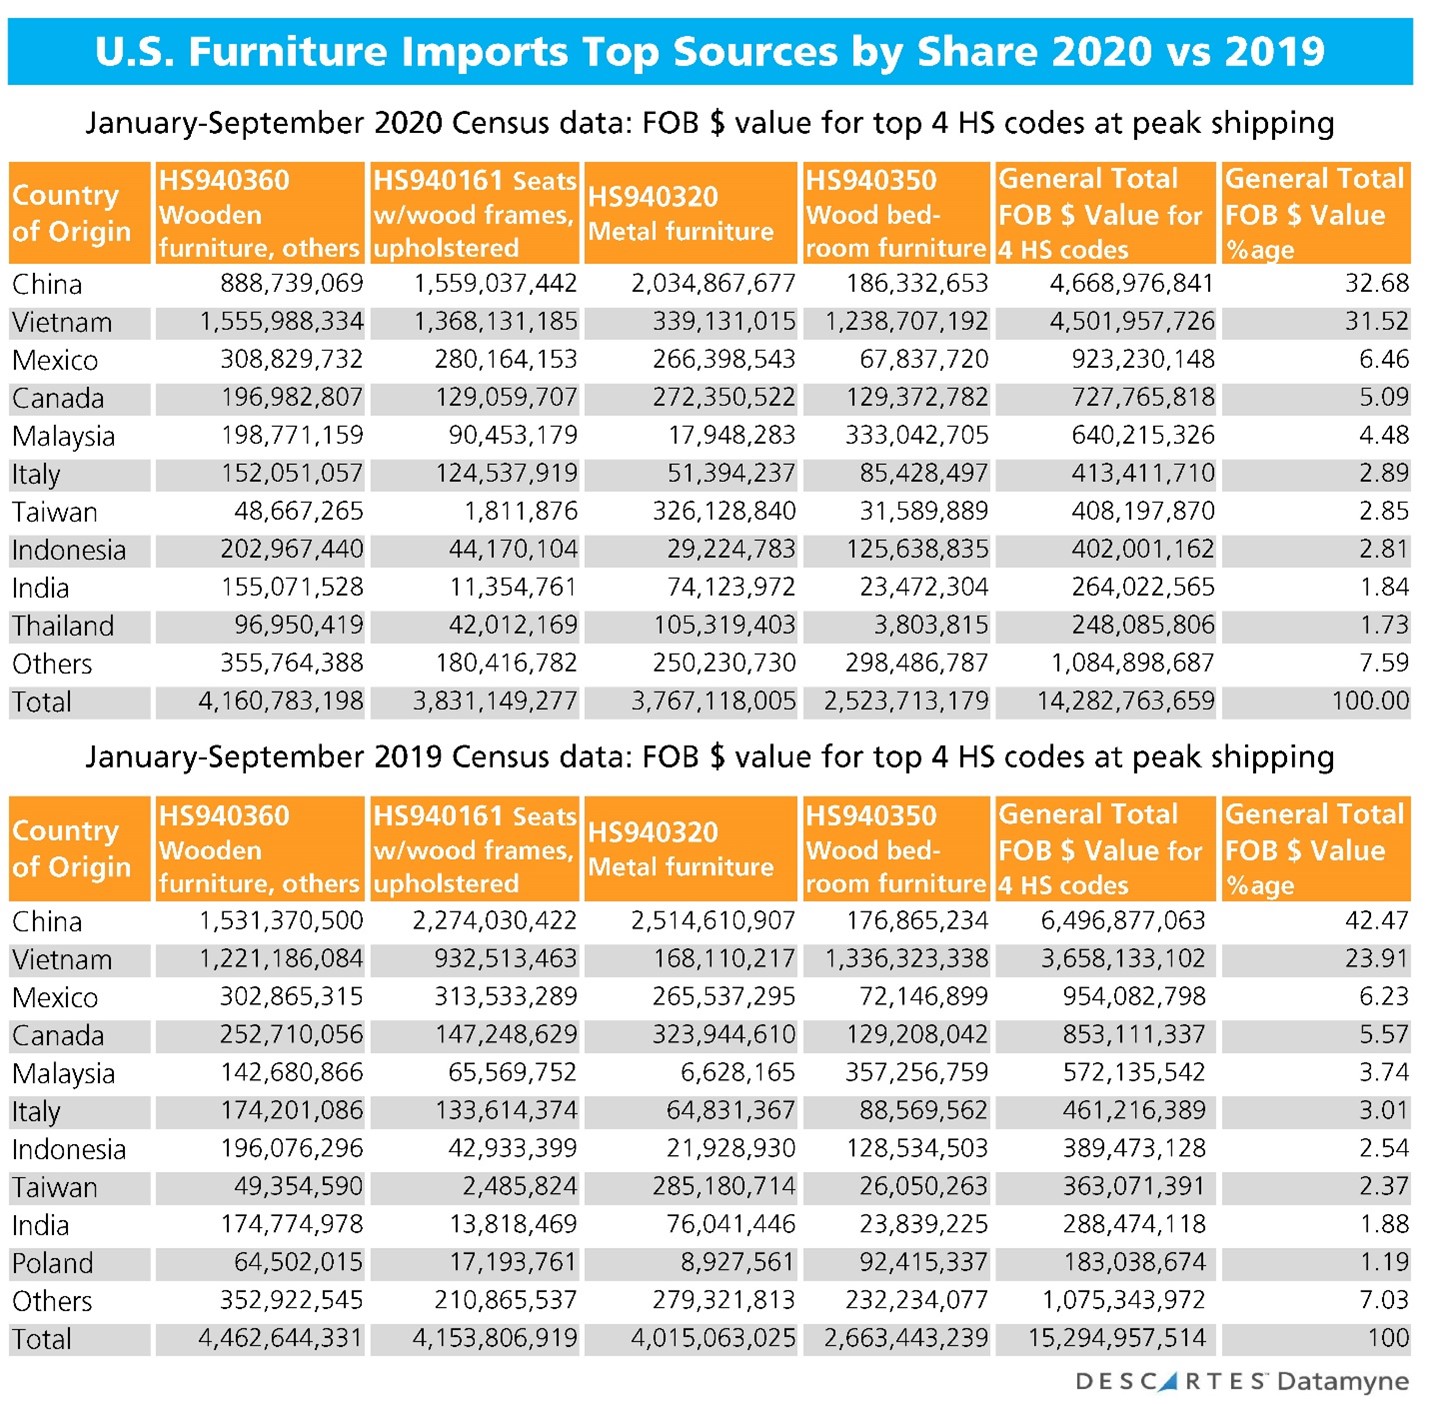
China still holds the lead over other countries of origin for the peak season’s high-demand furniture products in this view – but China’s share scales down to 42.5% in 2019 and 32.7% in 2020. The data also reveals shifts in centers of production: note the near parity in output of upholstered chairs by China and Vietnam. China is eclipsed by Vietnam in wooden furniture, others; and wooden bedroom furniture.
The Census data, which includes shipments by air and overland as well as by sea, also brings the U.S.’s North American trading partners, Mexico and Canada, into the picture.