


Wave upon wave of supply chain disruption has delivered the hard lesson that diversified lines of supply are essential to keep production and commerce moving. Now comes what may be the biggest disruptor yet: The deployment of clean hydrogen to industry, agriculture and transportation, starting with ammonia, and in particular green ammonia, production.
Descartes Datamyne global trade data provides a way to track the transition and find chemical suppliers ready to support the roll-out, just as the U.S. Department of Energy (DoE) has finalized its roadmap to accelerate the country’s transition from carbon- to hydrogen-based energy.
While it may be today’s most direct route to decarbonization, electrification – ultimately fueled by renewables – is not a one-size fits all solution. Hydrogen could be the key to greening industrial processes that use carbon inputs, long-range transport, and – again ultimately – storing renewable energy for shipment from source to consumer.
The first milestone on the DoE roadmap, with an ETA of 2030, is greening the century-old process for making ammonia, a compound of nitrogen and hydrogen used principally as an agro-chemical to make fertilizer, and as a feedstock for other nitrogen compounds and specialty chemicals. The traditional process strips hydrogen from natural gas. The green process uses hydrogen from water produced by electrolysis powered by renewables (green hydrogen), or as a by-product of carbon management (blue hydrogen).
Green ammonia seen as low hanging fruit
For the DoE strategists, green ammonia is a “low-hanging fruit” in the overall campaign to decarbonize the U.S. economy. Indeed, they see the ammonia market as one of today’s best opportunities to start building large-scale demand for clean hydrogen.
There are already green ammonia production plants in operation, with more coming online this year, and chemical suppliers signing contracts to start exporting green ammonia within a year. The costs of green hydrogen should become more competitive as production scales up, natural gas prices increase, and new government incentives, such the U.S. Inflation Reduction Act’s hydrogen production tax credits, take effect.
Beyond deploying clean hydrogen to the global chemical supply chain, green ammonia fertilizers will substantially decarbonize the agricultural sector. University of Minnesota researchers estimate green ammonia could reduce farming’s carbon footprint by as much as 90% for corn and small grain crops – that’s if it’s used to power the farmer’s tractor and heat the farmhouse as well as fertilize the farmer’s fields.
The DoE strategy calls for subsequent waves of hydrogen deployment in high-value applications for which there are a few deep decarbonization options, such as steelmaking, refining, biofuels, and other petrochemical production – methanol is a second-wave target (see Figure 1).
Figure 1: Deployments of clean hydrogen to decarbonize industry, transportation and the power grid
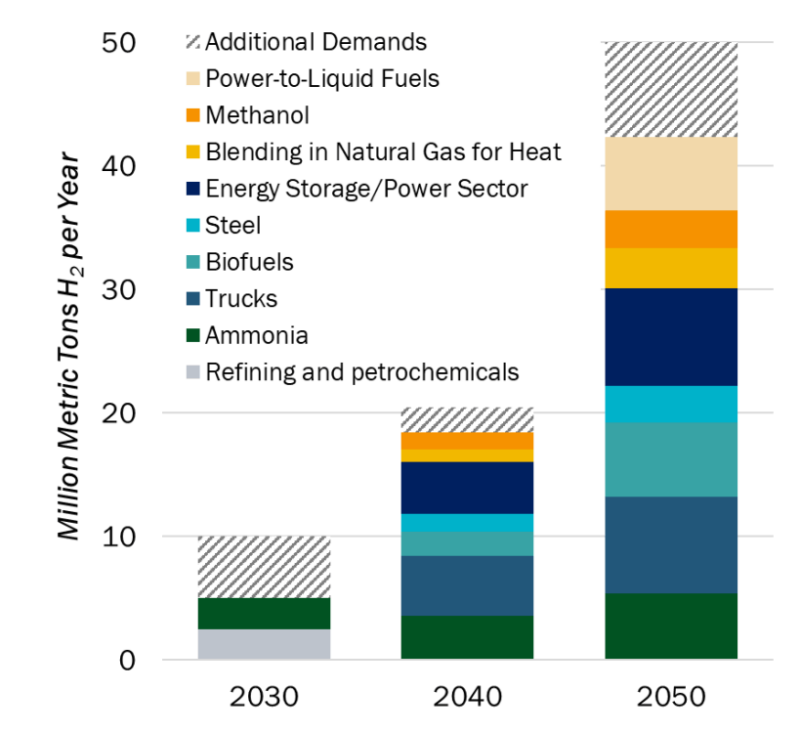
Source: U.S. National Clean Hydrogen Strategy and Roadmap
Global trade data tracks trends in ammonia markets
Ammonia is a global commodity, with supply a function of the availability and production costs of natural gas, demand rising and falling with the needs of the agricultural sector. Price competition in the global marketplace is intense.
Geopolitics and government policies can and do change the supply-demand equation. The starkest current example is the Russia-Ukraine conflict, which has effectively suspended ammonia exports originating in Russia, previously the second-ranked source (behind Trinidad and Tobago) accounting for about 20% of ammonia in global trade. (A proposed agreement to pump Russian ammonia gas to the Ukrainian border for export is stalled because the pipeline is damaged, Reuters reports.)
Among the exporters filling the gap in 2022 left by Russia and Ukraine was China, which the Descartes Datamyne global trade data shows, increased the quantity of its ammonia exports more than 100-fold (10,827%). About 40% of Chinese ammonia went to India.
The U.S. also boosted its ammonia exports last year – but with a comparatively modest 163% gain over a significantly lower base (351,598 kg versus China’s 2,179,970 kg in 2021).
The U.S. is both a leading producer and a net importer of ammonia. As our global trade data shows (in Figure 2), U.S. cross-border trade in ammonia has declined overall over the last decade:
Figure 2: U.S. Import-Export Trade in Ammonia [HS2814] Annual Volume
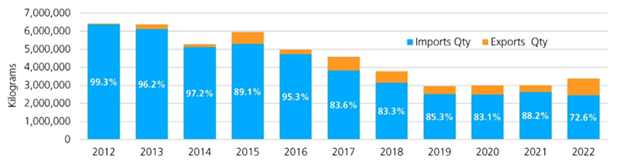
Source: Descartes Datamyne
A resurgence in domestic ammonia manufacturing, driven by the shale revolution’s plentiful supplies of low-cost natural gas, has reduced U.S. reliance on imports to meet domestic demand to 12% in 2021, from 18% in 2018 and 44% in 2007, according to U.S. Geological Survey estimates. About 88% of U.S. ammonia consumption is for fertilizer use.
Over the same period, U.S. ammonia exports have grown in spurts, while claiming a larger share of trade in this commodity (see Figure 3).
Figure 3: U.S. Import-Export Trade in Ammonia [HS2814] Annual Percentage Change
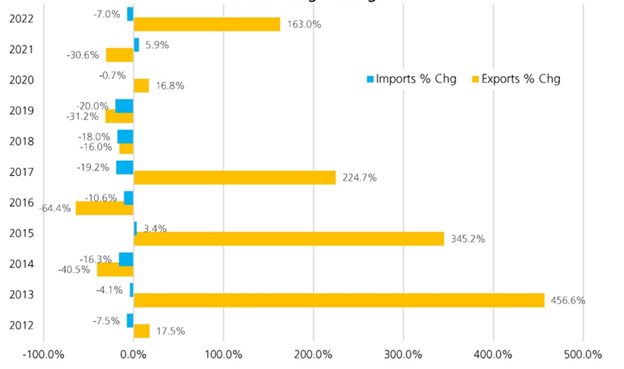
Source: Descartes Datamyne
Based on this year’s Census data through April, the relative share of U.S. inbound and outbound trade in ammonia has shifted substantially, with imports accounting for 64% and exports 36% of total trade. Compared with the same period a year ago, total trade climbed 22%, with exports increasing 310% while imports declined -12%.
What global trade data reveals about current and potential partners in ammonia
Our global trade data also reveals changes in U.S. trading partners, especially in exports, with more of the U.S. agro-chemical heading to a more diverse group of markets, including destinations in Europe, this year to date. (Refer to Figure 4)
Figure 4: Pie Charts Showing Top Markets for U.S. Ammonia Exports (2012-2022)
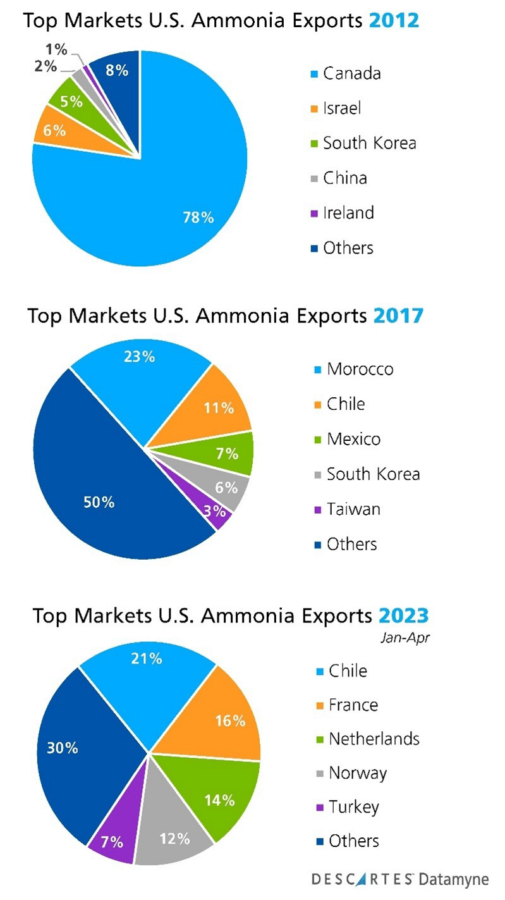
Source: Descartes Datamyne
A top destination for U.S. ammonia in 2023, Norway is partnering with the International Maritime Organization, on the GreenVoyage 2050 project supporting shipping’s transition towards a low carbon future. (including studying alternative marine fuels; see, e.g., one shipowner’s “expectations on using ammonia as marine fuel”).
There have been changes, too, in the countries of origin for U.S. ammonia imports. (See Figure 5)
Figure 5: Pie Charts Showing Top Markets for Ammonia Imports into the U.S. (2012-2022)
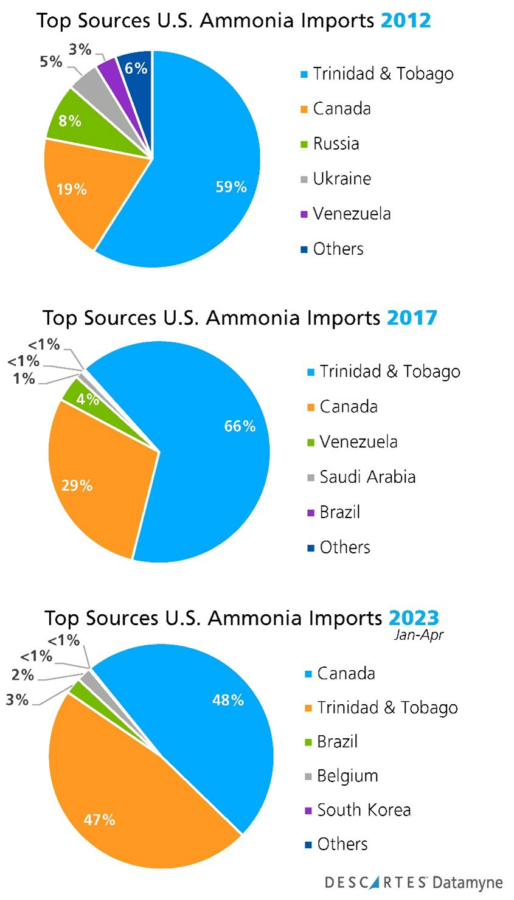
Source: Descartes Datamyne
Geopolitics are likely the reason for the absence of Russia, Ukraine, and Venezuela from 2023’s line-up of the agro-chemical’s U.S. suppliers.
Perhaps more surprising, Canada has gained significant share of a shrinking pie from erstwhile top source Trinidad and Tobago. A global leader in exports of liquid natural gas as well as ammonia, Trinidad and Tobago seems hesitant to embrace green alternatives, even as its carbon-based fuel resources have passed their peak, the New York Times reports.
Canada, in contrast, is racing to ship green hydrogen to the EU – it’s signed an agreement to begin exports to Germany by 2025 – but is facing headwinds, according to Reuters.
Like the U.S., Canada has its own roadmap to transitioning to green ammonia production. Most ammonia producing countries do. And, like the U.S., most producing countries reserve most of their ammonia for domestic agricultural applications or specialty chemical production. It remains to be seen how much share today’s top producers of ammonia will command in a green global marketplace. Certainly, countries with limited carbon resources but huge potential for sun and wind power are eager to bring their renewable energy, stored as green ammonia, and shipped to global markets.
It seems likely that as more national governments settle on decarbonization policies, clean hydrogen deployment will pick up speed. Another accelerant: Current high energy prices and the disruption of ammonia supply in Europe, driven by the Russia-Ukraine conflict, is providing proof of concept and encouraging investment in green ammonia, says the Financial Times.
Whether the momentum gains or falters, Datamyne’s global trade data offers a way to track the progress of green ammonia in markets around the world.
Our trade data also provides a way to identify active buyers and sellers of ammonia (or chemical suppliers), along with trade intelligence on their import-export activities, suppliers and/or customers, and company profile information.
How Descartes Datamyne Can Help
Descartes Datamyne delivers global trade data and intelligence with comprehensive, accurate, up-to-date, import and export information that helps companies save significant time in spotting supply and demand shifts, optimizing trade lanes, expanding into new markets and identifying new buyers and suppliers.
Datamyne features the world’s largest searchable trade database covering 230 markets across five continents. Gathered directly from official filings with customs agencies and trade ministries, including bills of lading, our data is detailed (down to company names and contact details), timely and authoritative.
Descartes software solutions include a landed cost tool to calculate the economic viability of importing from a range of markets. Our applications can also screen against multiple denied parties lists simultaneously to help ensure organizations are not doing business with entities named on official government watch lists.
Also check out the Descartes Environmental, Social and Governance resource center, and read about how to Build Supply Chain Resilience.