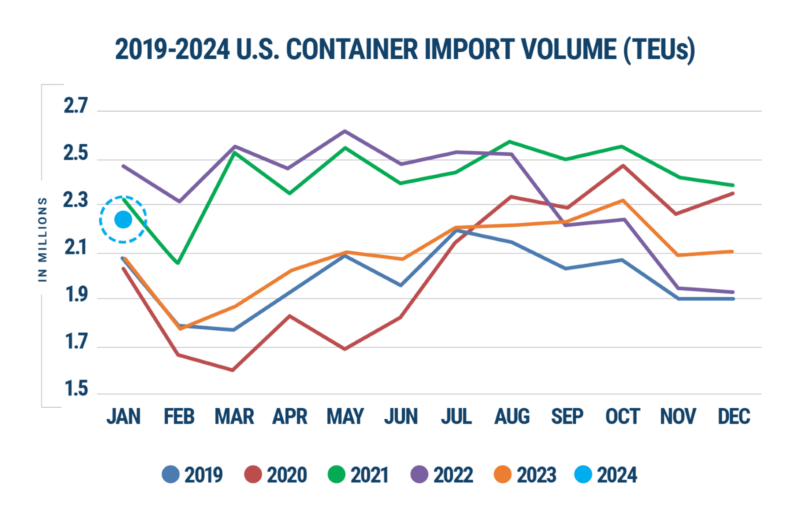
Global trade data tracked by Descartes indicates that In January 2024, the volume of U.S. imports in the surged by 7.9% compared to December 2023, marking the most substantial month-over-month growth for January in the past seven years. The increase was largely driven by a 14.9% uptick in imports from China, with the Ports of Los Angeles and Long Beach experiencing much of this influx. However, the combined effects of the Panama drought and the conflict in the Middle East are beginning to affect transit times, leading to significant delays at major East and Gulf Coast ports. The latest logistics metrics update from Descartes indicates a rapid acceleration in container import volume for February. There are emerging signs suggesting that global supply chain performance could be impacted throughout 2024 due to conditions at the Panama and Suez Canals, as well as upcoming labor negotiations.
Steady growth of U.S. Imports
In January 2024, U.S. import volumes rose by 7.9% compared to December 2023, reaching 2,273,125 twenty-foot equivalent units (TEUs) (refer to Figure 1). In comparison to January 2023, TEU volume experienced a 9.9% increase, and it surged by 9.6% from the pre-pandemic levels of January 2019.
Figure 1: U.S. Container Import Volume Year-over-Year Comparison

Transit delays worsen, especially at East Coast ports.
In January 2024, transit delays at major ports experienced a general uptick, as depicted in Figure 2. Notably, the Port of Los Angeles witnessed a marginal reduction in delays. Conversely, top East Coast ports, including Norfolk, New York/New Jersey, and Charleston, faced substantial increases in transit delays, some exceeding 2 days.
Figure 2: Monthly Average Transit Delays (in days) for the Top 10 Ports (Nov. 2023 – Jan 2024)

Source: Descartes Datamyne™
Note: Descartes’ definition of port transit delay is the difference as measured in days between the Estimated Arrival Date, which is initially declared on the bill of lading, and the date when Descartes receives the CBP-processed bill of lading.
Manage Supply Chain Risk with Descartes Datamyne
Descartes Datamyne provides a robust solution for managing supply chain risks by delivering comprehensive, accurate, and up-to-date global trade and shipping data. This information enables companies to efficiently identify shifts in supply and demand, optimize trade lanes, explore new markets, and discover potential buyers and suppliers.
With the world’s largest searchable trade database covering 230 markets across five continents, Datamyne sources its data directly from official filings with customs agencies and trade ministries. This includes detailed information, down to company names and contact details, making it both timely and authoritative. The inclusion of bills of lading information ensures robust import coverage.
In addition to providing trade intelligence through shipping data, Descartes’ software solutions feature a landed cost tool. This tool aids in calculating the economic viability of importing from various markets. Furthermore, Descartes applications include a screening feature that checks against multiple denied parties lists simultaneously. This screening process helps organizations ensure that they are not engaging in business with entities listed on official government watch lists.
It’s important to note that this report is based on the initial compiled release of U.S. Customs and Border Protection (CBP) data and may be subject to revision by CBP at a later date. Any revised data can be accessed through Descartes Datamyne.
This is an excerpt of an article originally posted in the Descartes Global Shipping Report Resource Center. If you are looking for how Datamyne’s global trade and shipping data can help you, Contact Us.


