
Section 232 tariffs have shifted the flow of trade in steel and aluminum since their 2018 introduction, Descartes Datamyne trade data shows. On April 2, the U.S. administration revised rates and changed how they are assessed. Breaking from previous content-based assessments, duties apply to the full value of goods containing the affected metals, now including copper. On June 1, the tariffs were extended to more products, while exemptions provide targeted relief to some sectors.
Key Takeaways:
- Section 232 tariffs now apply to the full value of many products containing steel, aluminum, or copper.
- New tiered tariff rates range from 10% to 50%, depending on the product and origin.
- Some machinery, molds, and derivative products qualify for temporary reduced rates through 2027.
- Products with less than 15% metal content are exempt from Section 232 duties.
- Section 232 tariffs have contributed to lower U.S. imports of steel, aluminum, and copper.
- U.S. sourcing patterns have shifted as importers adapt to changing tariff policies.
- Orders on antidumping and countervailing duties (AD/CVD) remain an important trade remedy, particularly for steel imports.
- Descartes Datamyne trade data helps businesses monitor tariff impacts, identify new suppliers, compare sourcing options, and estimate landed costs.
The tariff rollercoaster continues, as Plastics Today noted in reporting the impact of the latest tariff policies on the plastics industry, with implications for machinery, molds, and parts.
Not all of it is bad news for importers. As Descartes’ recent blog on U.S. plastics trade noted, the stacking of tariffs (Section 232 and Section 301) had flattened year-over-year growth in imports of essential plastics-manufacturing components in 2025.
The revised tariff scheme offers some relief from duties for injection molds [HS8480718045] and compression molds [HS8480718060], as well as several lines for injection molding machinery and parts [under HS8477].
The relief is temporary: a reduction from the top rate of 50% ad valorem to 25% will expire at the end of 2027. The complete list of products selected for temporarily discounted rates is in Annex III to the presidential proclamation. Additionally, a de minimis exemption applies for products that contain less than 15% of the tariffed metal. The rate on derivative products is cut from 50% to 25%, but as the lower rate is applied to the full value of the products the duties paid might be higher. Here’s a rundown of the key changes:
Introducing Tiered Rates Applied to the Full Value of Goods
The Trump Administration had already boosted the Section 232 levy on steel and aluminum from 25% to 50% in June 2025. That order specified the rate was to be assessed on the metals content of derivative products. The new order provides for different rates, all to be assessed on the full value of the products. Here’s a summary:
- Starting at the top of the tiered rate system, a 50% tariff applies to the full value of steel and derived products [generally denoted by HS72 and HS73], aluminum and derivative products [HS76] and copper products [HS74]. The complete list is in Annex I-A.
- A 50% rate applies to the full value of trucks, fork-lifts, earthmovers, and tractors (excepting those used in agriculture), but with an expiration date of December 31, 2027. These products are listed in Annex I-C.
- A 25% tariff is assessed on the full value of articles of steel, aluminum, and copper, as well as products containing significant amounts of these metals. These include the manufactured goods categorized under HS82 through HS87, and HS94 (this last covering steel wire decking and prefab buildings of steel). The complete list is in Annex I-B.
- Note that some products listed in Annex 1-C are exempt when imported exclusively for manufacturing mobile industrial equipment or fixed industrial or agricultural equipment listed in Annex III.
- Products that were but are no longer subject to Section 232 tariffs are listed in Annex II. Among the newly excluded items are milk and cream products [HS0402.99.68, -70, -90] shipped in metal containers, among the 407 products to which the tariffs were extended August 19, 2025.
- Imported derivative products made from metals smelted (or, in the case of steel, melted) and poured in the U.S. merit a special rate of 10%. Derivative products with less than 15% metal content are exempt from the Section 232 levy.
These tariffs do not replace rates in existing agreements with trading partners, including the Economic Prosperity Deal struck with the U.K. in May 2025 and the USMCA pact with Canada and Mexico, which was up for joint review July 1 and which the U.S. has declined to renew. According to the statement issued by US Trade Representative Jamieson Greer, the trade agreement will remain in force while trade negotiations proceed.
Before Section 232: AD/CVD Tariffs Aim to Level the Playing Field
Prior to the Trump Administration’s first imposition of Section 232 tariffs on steel and aluminum in 2018, the primary remedies for addressing unfair competition from abroad were AD/CVD investigations overseen by the International Trade Commission (ITC).
Almost always initiated in response to an industry petition, ITC investigations aim to determine whether domestic producers have been negatively impacted by underpriced imports dumped on the U.S. market and/or foreign government subsidies for their exporters’ products. If so, customs duties are imposed on the imports to counter the market advantage.
There are 70 countries currently subject to AC/CVD orders; China accounts for nearly a third (see Figure 1).
Figure 1: Countries Currently Subject to U.S. AD/CVD Orders
China’s trade practices have long been a concern to the U.S., and steel imports have been targeted to curb imports from this source. In 1997 the U.S. initiated an AD/CVD investigation into cut-to-length carbon steel plates from China, among other countries (a case that ended in an agreement to cut imports rather than antidumping duties). The world’s leading producer of steel since 1996, China’s share of global steel production stood at 53% in 2025, according to the World Steel Organization.
By 2015, U.S. tariffs on some Chinese steel imports neared 500%. But, even as U.S. deployment of targeted AD/CVD orders multiplied, pressure on the domestic industry from overseas competitors continued to build. According to one steelmaker: “It can be like whack-a-mole. AD/CVD duties do have an effect, but there is so much excess steel capacity in the world that when, say, China is blocked, here comes the steel from someplace else.” Indeed, as the Financial Times reported back in 2018, China has been investing in steel production in Southeast Asia since the mid-teens.
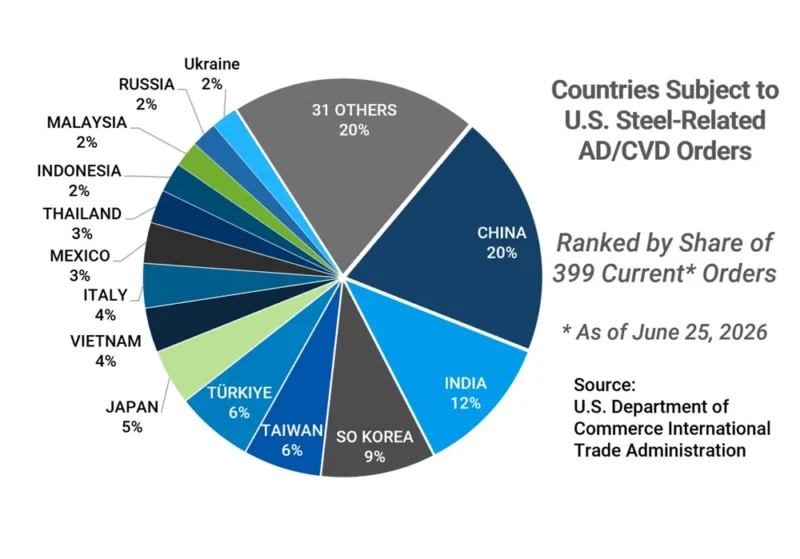
Today, roughly 39% of active orders for AD/CVD tariff treatment are aimed at steel and steel products. As of June 25, 2026, the International Trade Administration reported 847 AD/CVD orders currently in force and 86 ongoing investigations. Roughly 39% of all active orders for AD/CVD tariff treatment are aimed at steel and steel products, 20% at Chinese imports (see Figure 2).
Figure 2: Countries Currently Subject to U.S. AD/CVD Orders on Steel
Source: U.S. Department of Commerce International Trade Administration.
Section 232: A Matter of National Security
In 2018, the Trump Administration deployed a sweeping plan to reduce steel and aluminum imports from just about every source with Section 232 tariffs. First authorized by the Trade Expansion Act in 1962, but rarely invoked, Section 232 tariffs are intended to protect domestic industries that are deemed critical to the nation’s security.
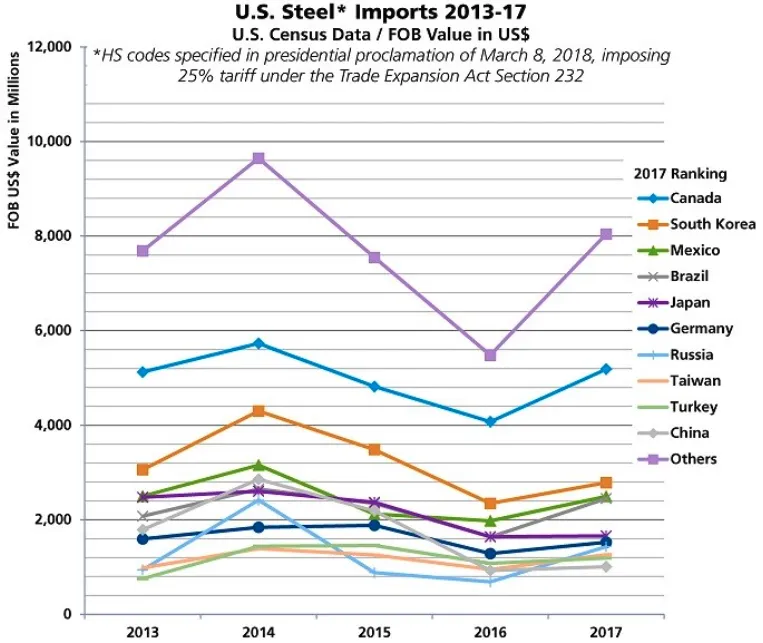
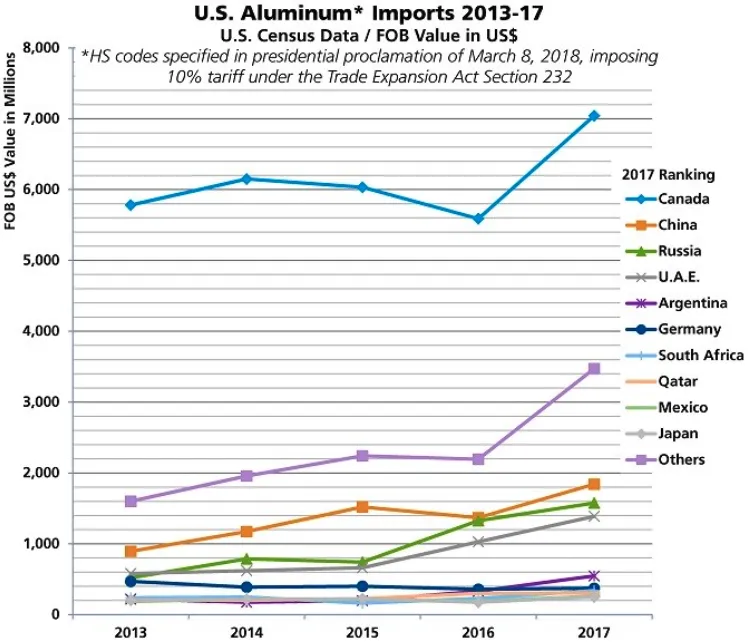
Our previous blog on the subject provided baseline data on imports of steel (see Figure 3) and aluminum (see Figure 4) and over the five years from 2013 to 2017, indicating a surge in steel and aluminum imports in 2017 following a 2016 decline (driven by steep tariffs on imports of corrosion-resistant (CORE) steel, as we reported then). Interestingly, China had slipped well down the ranks of countries-of-origin for U.S. steel imports, from No. 3 in 2014 to No. 10 in 2017. Aluminum imports also gained momentum in 2017 after a much shallower decline in 2016. China held its place as No. 2, behind top source Canada, through these years.
Figure 3: U.S. Steel Imports (2013-2017)
Source: Descartes Datamyne U.S. Census import data.
Figure 4: U.S. Aluminum Imports (2013-2017)
In 2020, Section 232 tariffs were extended to downstream products made of steel and aluminum. The presidential order cited spikes in imports of such derivative products as steel nails and aluminum stranded wire as an indication that the 2018 tariffs were being circumvented. No substantive changes were made to the tariffs during the Biden Administration.
Last year, the second Trump Administration expanded the scope of the steel and aluminum tariffs and initiated Section 232 tariffs on copper, specifically semifinished copper products and copper-intensive derivative products. Copper ores, concentrates, mattes, cathodes, anodes, and scrap were not included in this round. (Commerce was tasked with investigating whether more copper products should be added; the results are expected to be released this summer.)
Copper was added to the U.S. Geological Service list of critical minerals just last year. As the July 30, 2025, tariff order notes, copper is the second most widely used material by the U.S. Defense Department, a necessary input in a range of defense systems, including aircraft, ground vehicles, ships, submarines, missiles, and ammunition. Copper also plays a central role in building construction, electrical and electronic products, and transportation equipment.
The Difference Tariffs Have Made
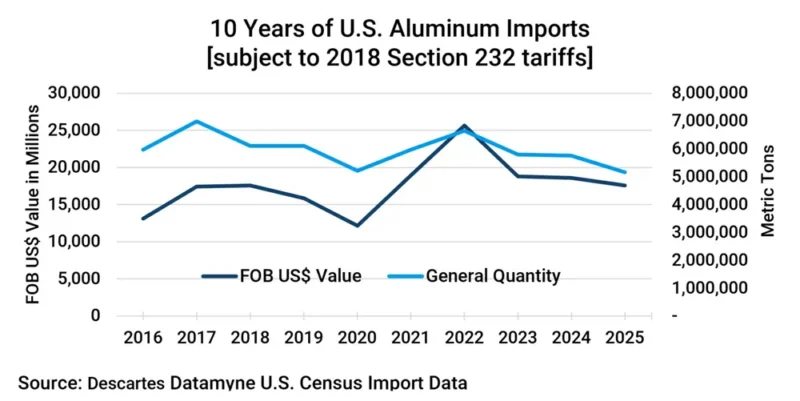
The Descartes Datamyne trade data indicate that the Section 232 tariffs have helped reduce U.S. imports of steel and aluminum (see Figures 5 and 6). The data shows a drop in both metal’s trade volume following 2018, the year Section 232 tariffs were initially deployed, and again in 2025, when the tariffs were adjusted. The 2020 extension of the steel and aluminum tariffs to derivative products may have had an effect but it was overshadowed by the profound impact of COVID era shutdowns. The rise and fall of trade value shows supply and demand at work, especially in the post-pandemic surge in demand for scarce supplies.
Figure 5: Value and Quantity of U.S. Steel Imports Subject to 2018 Section 232 Tariffs 2016-25
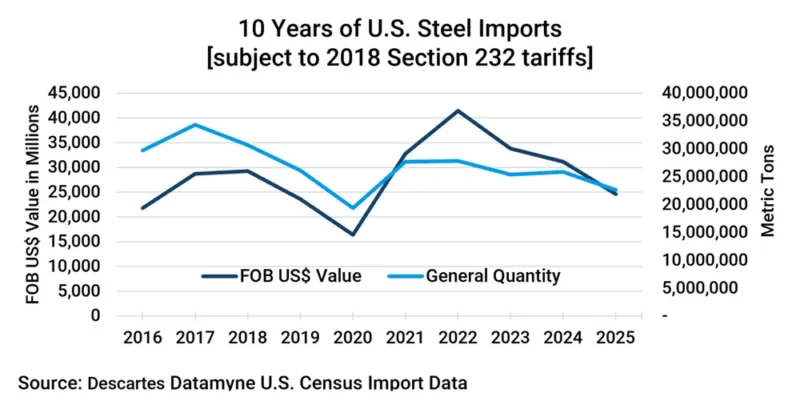
Figure 6: Quantity of U.S. Aluminum Imports Subject to 2018 Section 232 Tariffs 2016-25
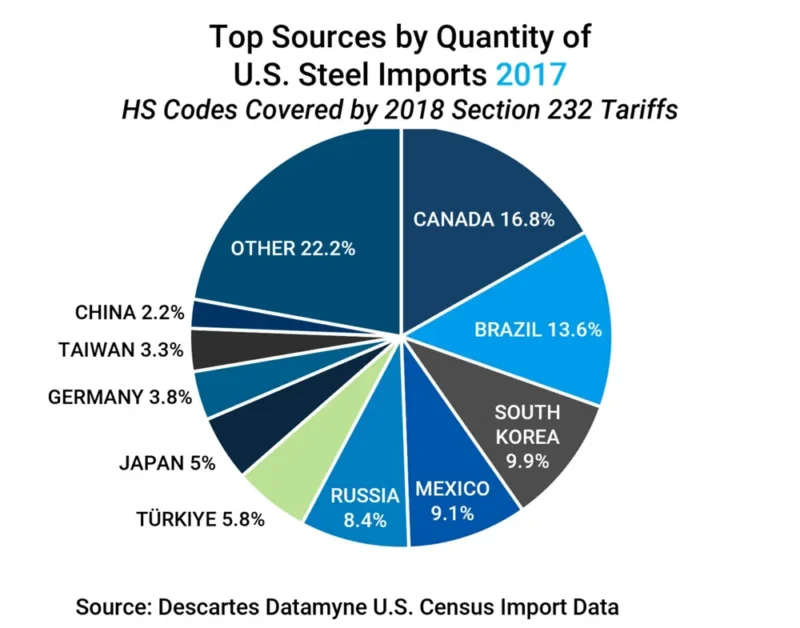
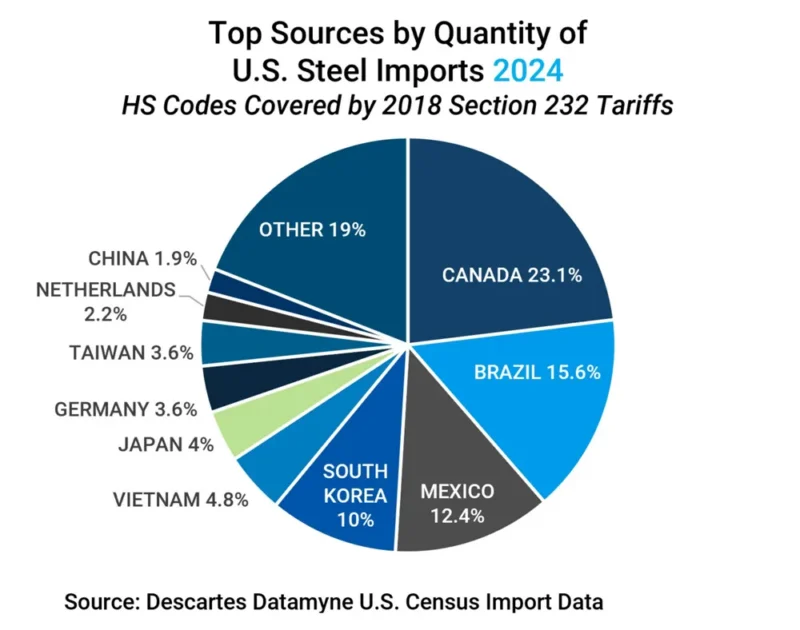
The 2018 tariffs also helped to reorder cross-border supply chains. Compare the top countries of origin for steel in 2017 with those of 2024 (see Figures 7 and 8). Notable by its absence from the 2024 ranking is Russia, which the U.S. imported very little steel from in 2022, and none since 2023. Meanwhile, separate trade agreements have been negotiated with the share-building sources of steel imports (including Vietnam with a 4.8% share of this trade in 2024 compared with 2.9% in 2017).
Figure 7: Top Countries of Origin by Share of U.S. Steel Imports in 2017
Figure 8: Top Countries of Origin by Share of U.S. Steel Imports in 2024
Section 232 Metals Imports Benchmarks for 2026
Following are current views of the top sources for imports of metals subject to Section 232 tariffs based on the latest available U.S. Census data on 2026 trade. First, the copper imports that fell under Section 232 levies August 1, 2025, show a clear illustration of the trade dampening effect of tariffs (see Figure 9).
Figure 9: Top Countries of Origin for U.S. Copper Imports Subject to 2025 Section 232 Tariffs January-April 2025 vs 2026
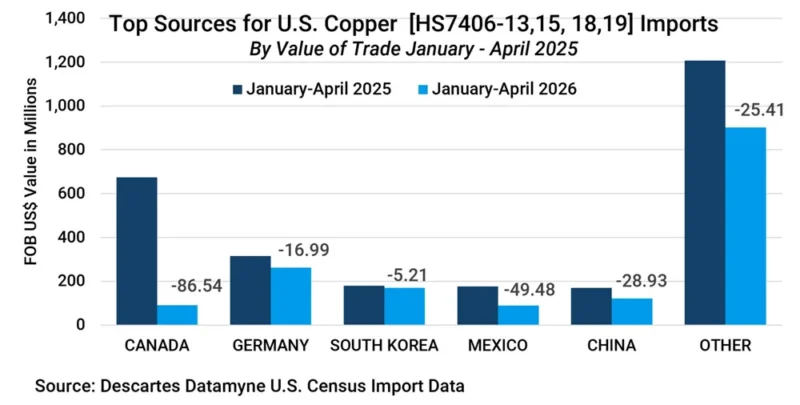
Figure 10 provides an overview of the trade in steel and aluminum products subject to the original 2018 Section 232 tariffs before and after the rate increased from 25% to 50% last June:
Figure 10: Top Countries of Origin for U.S. Aluminum Imports Subject to 2018 Section 232 Tariffs January-April 2025 vs 2026
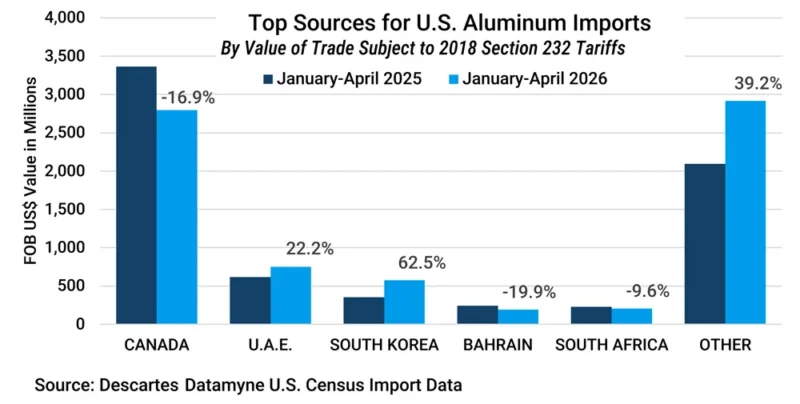
Figure 11: Top Countries of Origin for U.S. Steel Imports Subject to 2018 Section 232 Tariffs January-April 2025 vs 2026
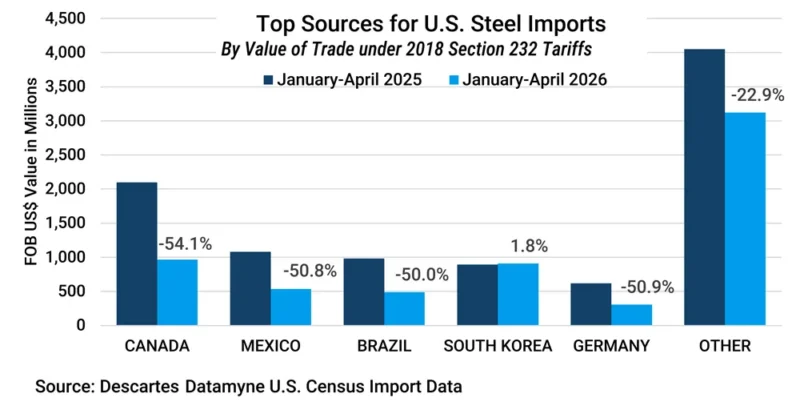
As the latest iteration of the Section 232 tariffs on metals was released this April, these charts comparing imports in the first four months of 2026 with the same period in 2025 serve best as benchmarks. The 2026 declines likely reflect the rate boosts of June 2025 (and frontloading helped lift these in imports in anticipation of the higher tariff rates). Again, there are intervening variables. The boost in aluminum imports is attributable to the possible frontloading of shipments ahead of the Strait of Hormuz shutdown. An October 2025 agreement on trade and investment reached by the U.S. and South Korea contributed to the 2026 increases in imports from that source.
In any event, slowing inbound trade is not an end in itself for Section 232 tariffs; it’s the means to boost a resurgence in domestic industry and onshore vital supply chains.
In the latest Section 232 order, the administration reports some progress on this front. Under the aluminum and steel tariff policies, domestic capacity utilization has increased from approximately 39% in 2017 to approximately 50.4% at present for aluminum production and from approximately 72.3% in 2017 to approximately 77.2%. The goal is to achieve sustained domestic capacity utilization of 80% for both metals.
How Descartes Datamyne Can Help
As tariff policies continue to evolve, importers need the ability to understand how changing duties affect sourcing decisions, supplier relationships, and total landed costs.
Descartes Datamyne combines comprehensive U.S. import and export trade data with powerful tariff intelligence to help businesses navigate an increasingly complex trade environment. Companies can monitor tariff changes across thousands of products, compare duty rates between sourcing countries, and evaluate how tariff exposure affects procurement strategies and landed costs before making decisions.
With Descartes Datamyne, businesses can:
- Track changes to Section 232, Section 301, AD/CVD, and other U.S. tariff programs.
- Compare tariff rates and duty exposure across multiple sourcing countries to identify lower-cost alternatives.
- Calculate estimated landed costs by incorporating applicable tariffs into sourcing decisions.
- Identify and qualify new suppliers in countries with more favorable tariff treatment.
- Monitor competitors’ sourcing strategies and shifting supply chains using detailed shipment-level trade data.
- Analyze import trends by product, country, supplier, and customer to uncover market opportunities and mitigate supply chain risk.
Whether you’re responding to new Section 232 requirements, evaluating alternative sourcing strategies, or monitoring the impact of future tariff actions, Descartes Datamyne provides the trade intelligence needed to make faster, more informed supply chain decisions.