


As national governments supercharge the drive toward electrification, the scramble to secure supplies of Lithium-Ion (Li-ion) batteries is fueling major investments in mines, factories, and R&D. Global trade data is capturing signs of shifting cross-border supply lines and the rise of new buyers and sellers.
Descartes Datamyne trade data on U.S. imports of Li-ion batteries reveals some early results of new U.S. industrial policies, starting with the U.S. program to strengthen the resilience of supply chains deemed critical to national security that was launched by the Biden Administration in 2021. Along with pharmaceuticals and semiconductors, large capacity batteries – and Li-ion batteries specifically – have been singled out for industrial policies aimed at shifting their sourcing to domestic centers of production and trusted allies.
New Industrial Policies to Reshape Global Trade
Li-ion batteries are critical to U.S. strategy to achieve a robust, clean energy strategy, essential to achieving the goal of “electrifying everything.” Government subsidies, tax incentives, and mandates by local and national policies are being deployed in the U.S. to accelerate the transition to all-electric buildings and electric vehicles (EVs). Note that the U.S. is not alone (nor in the lead) on pressing forward to electrification: More than 20 countries have set deadlines for a full phase-out of internal combustion engine (ICE) car sales within the next 10 to 30 years.
The impact of these policy initiatives is reshaping cross-border trade. The post-pandemic surge in U.S. imports of Li-ion batteries underscores the challenge of meeting rising demand for – and moderating the costs of – the “gasoline of the 21st century.”
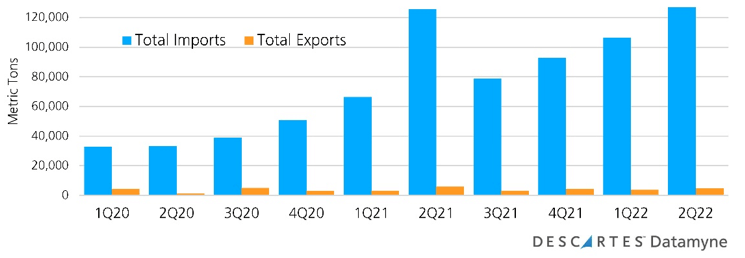
The global trade data (see Figure 1) indicates this year’s second-quarter import volume was on a par with the same quarter in 2021, advancing just 1.2%. But a year-over-year comparison with 2Q20 shows a nearly four-fold increase of 283.8% in 2Q22.
Figure 1: U.S. Imports of Lithium-Ion Batteries (HS850760) by Volume
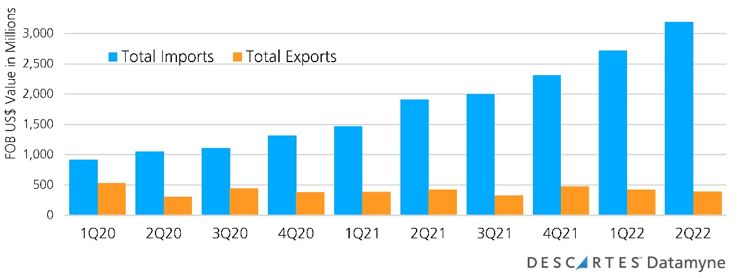
In contrast, U.S. Li-ion imports in 2Q22 posted a 67.2% gain in (FOB) value over 2Q21, and tripled in value – increasing 204.1% – compared with 2Q20 (refer to Figure 2). The value gain 2021 to 2022 on flat growth in volume is an indicator of increasingly limited supplies commanding higher prices.
Figure 2: U.S. Imports of Lithium-Ion Batteries (HS850760) by Value
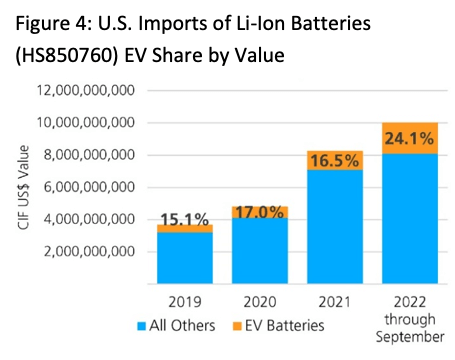
The U.S. Census global trade data shows that a minority, albeit growing and disproportionately valuable, share of these U.S. imported batteries are destined for power vehicles (Figures 3 and 4).
Figure 3: U.S. Imports of Li-Ion Batteries (HS850760) EV Share by Volume
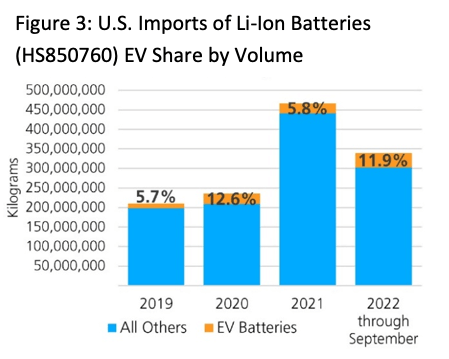
Figure 4: U.S. Imports of Li-Ion Batteries (HS850760) EV Share by Value
Global Trade Data Shows China’s Market Edge in Li-ion Batteries
Reliance on imports – and over-reliance on China as a source – is one of the concerns the new U.S. industrial policies aim to address. China accounted for 63.6% of U.S. Li-ion battery import volume in 2020, 58.1% in 2021, and 48% in the first nine months of 2022 (Figure 5). Not surprising as China launched its own industrial policies to achieve leadership in EVs and batteries in 2012. Today China is the leading supplier of Li-ion batteries to the world, as Descartes Datamyne Global Trade Data documents.
Figure 5: Top Supplier Countries of Lithium-Ion Batteries (HS850760) by Value
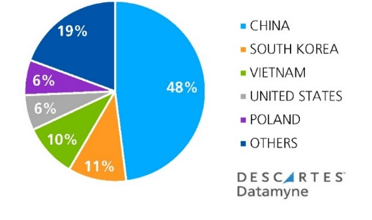
Based on Global Trade Data 2022 through September
Chinese companies, starting with the world’s leading producer of car batteries, are well-represented among the top suppliers shipping Li-ion batteries this year, according to our Global Trade Data (Figure 6).
Figure 6: Global Trade Data – Top Suppliers of Lithium-Ion Batteries
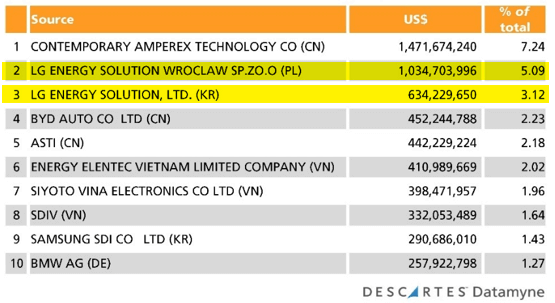
Based on Global Trade Data value of trade 2022 through October 28
But the global trade data and intelligence reveals a broader geographic distribution of suppliers than might be expected. For example, South Korea’s top supplier, LG Energy Solution, the makers of batteries for cars, electronics, appliances, and energy storage systems, has invested in centers of production in Poland – currently shipping more batteries internationally than its parent, as the global data shows (refer to yellow-highlighted lines in Figure 6, above) – China, Taiwan, Germany, and the U.S. – in Michigan and, soon, in Ohio and Tennessee.
There are also indications that Li-ion battery production will become less geographically concentrated as national governments prioritize critical supply chain resilience.
For example, the new gigafactories (so-called because output is measured in gigawatts) in the States are financed in part by U.S. Department of Energy (DOE) loans awarded earlier this year. As part of the U.S. government’s full-court press to secure the resources for a clean energy transition, the DoE in 2020 issued guidance on loan applications for projects to assure access to critical minerals; announced funding to develop domestic battery supply chains in 2021; and, in July 2022, approved the first advanced technology vehicles manufacturing loan in more than a decade to underwrite the expansion of a graphite processing facility in Louisiana (more on this below). In October, the administration tapped Infrastructure Act funds to award 20 companies grants to assemble batteries and process the stuff they are made of.
Supply Chain Resilience Starts Downstream
Downstream from the gigafactories, the foundation for Li-ion battery supply chain resilience must secure access to critical raw materials, too often available only from “unreliable foreign sources” as President Biden’s order invoking the Defense Production Act to boost domestic production of lithium and other critical materials.
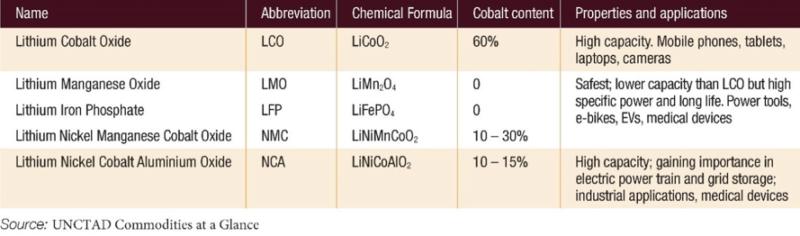
Li-ion battery cathodes are made from a blend of chemicals. For instance, in batteries that power most EVs, the cathode consists of nickel, manganese, and cobalt (NMC); the anode is usually graphite; and the electrolyte solution is lithium salts in an organic solvent. Other lithium battery chemistries are available (e.g., with nickel-cobalt-aluminum, or NCA, cathodes).This chart (Figure 7) from UNCTAD summarizes the Li-ion battery chemistries and their applications.
Figure 7: Types of Lithium-Ion Battery Chemistries
The bottom line: The worldwide lithium battery market is expected to grow by a factor of 5 to 10 in the next decade. Already on the rise pre-pandemic, worldwide demand will continue above historic levels for battery ingredients, many of them in the hands of a very few sources, which can be tracked by Datamyne’s global trade data. Cobalt, graphite, lithium, manganese, and nickel are all on this year’s Critical Metals List.
China has a head start of several years in the market competition for battery metals. While only about 13% of global lithium extraction occurs in China — behind Australia and Chile — its refiners process more than half the global supply, reports the Financial Times.
According to the U.S. Geological Survey 2022 Mineral Commodity Summaries, the U.S. is wholly dependent on imports to meet its need for graphite and manganese. The U.S. relies on offshore sources for about three-quarters of the cobalt and just under half of the nickel it uses.
With a brine operation in Nevada and two companies producing lithium compounds, the U.S. is able to meet more than 75% of its consumption needs – and it is an exporter of refined lithium. Nonetheless, with lithium supply security a top priority for Asia and Europe as well as the U.S., new strategic alliances and cross-border joint ventures are expected to change the competitive landscape. Developments in securing graphite cathode materials for U.S. gigafactories provide an example.
Global Trade Data Captures Impact on Graphite Imports
The U.S. National Blueprint for Lithium Batteries envisions the U.S. and its partners establishing a secure battery materials and technology supply chain by 2030. Goal 1: Secure access to raw and refined materials and discover alternatives for critical minerals.
Current global trade data captures what may be the shape of things to come in the preliminary results of an early U.S. initiative focused on graphite.
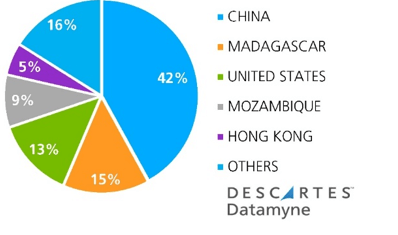
U.S. imports have surged the inbound flow of natural graphite, in line with gains posted by Li-ion batteries. But the data on country sources indicates something more than post-pandemic recovery is at work. As U.S. graphite imports have spiked this year (through September), China’s share, which had been receding over the past five years, has jumped to 75%, as summarized in this chart (Figure 8).
Figure 8: U.S. Imports of Natural Graphite (HS250410)
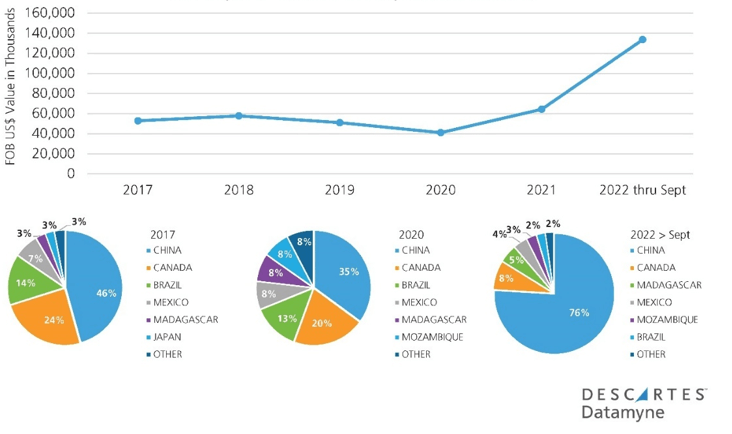
China’s market gain is likely a one-off, driven by demand from U.S. domestic gigafactories ramping up production, while worrying about forecasts of shortages, along with uncertainty about whether exclusions from Section 301 tariffs on Chinese-supplied graphite would be extended (as some domestic producers sought and the U.S. Trade Representative ultimately agreed). Our global trade data and intelligence on U.S. consignees provides some support for this analysis.
The trend better positioned to gain traction in the next few years is revealed by the mix of country sources illustrated by the pie charts. Five years ago, Mozambique was not among the countries of origin for U.S. graphite imports. In 2018, the Australian operator of Mozambique’s Balama graphite mine selected Louisiana as the location for a U.S. graphite processing plant to produce battery anode materials. By 2020, Mozambique was sixth-ranked source for U.S. graphite imports – much of it bound for Louisiana, global trade data shows, via a new graphite trade route from Mozambique to New Orleans. This year’s DoE loan (mentioned above) will be used to expand that Louisiana facility. Meanwhile, Mozambique has moved up to No. 5 among U.S. sources for graphite, and No. 4 among the world’s suppliers of graphite to a growing list of processors, principally in the U.S. and India, our Global Trade Data reveals (Figure 9).
Figure 9: World’s Top Sources by Value of Global Trade for Graphite (HS250410) in 2022 through September
This Australian-Mozambique-U.S. collaboration was cited as a model U.S. Secretary of State Antony Blinken when he convened a meeting of the Minerals Security Partnership (MSP) in September. Announced in June, the MSP aims to catalyze government and private sector investment to bolster critical mineral supply chains. Charter members Australia, Canada, Finland, France, Japan, the Republic of Korea, Norway, Sweden, the United Kingdom, the United States, and the European Union were joined by minerals-rich countries in attendance included Argentina, Brazil, the Democratic Republic of the Congo, Mongolia, Mozambique, Namibia, Tanzania, and Zambia.
The MSP is currently considering promising critical minerals projects that could be of interest to one or more MSP partners, the State Department said.
How Descartes Datamyne Can Help
Descartes Datamyne delivers global trade data and intelligence with comprehensive, accurate, up-to-date, import and export information that helps companies save significant time in spotting supply and demand shifts, optimizing trade lanes, expanding into new markets and identifying new buyers and suppliers.
Datamyne features the world’s largest searchable trade database covering 230 markets across five continents. Gathered directly from official filings with customs agencies and trade ministries, including bills of lading, our data is detailed (down to company names and contact details), timely and authoritative.
Descartes software solutions include a landed cost tool to calculate the economic viability of importing from a range of markets. Our applications can also screen against multiple denied parties lists simultaneously to help ensure organizations are not doing business with entities named on official government watch lists. Read also Building Supply Chain Resilience for more information.