
Last-ditch talks failed to avert U.S. Section 338 tariffs of 50% on imports from USMCA partner Canada, which took effect August 21. Prime Minister Mark Carney has called the dispute a trade war and retaliated. Descartes Datamyne trade data tracks the flow of goods across the U.S.-Mexico-Canada bloc and details the commercial stakes for North American trade.
Key Takeaways
- USMCA trade ties are under pressure as new tariffs weaken longstanding duty-free guarantees.
- Importers are increasingly using USMCA rules of origin to maintain tariff-free access.
- Mexico gained U.S. import share, while Canada’s share recovered more slowly.
- Canada offset declining U.S. trade by expanding exports to other international markets.
- Mexico strengthened its role in North American AI supply chains as ADP machine exports surged.
- Tariffs and changing demand disrupted automotive trade, particularly electric vehicle shipments.
- Evolving USMCA negotiations and tariff policies continue to create uncertainty for North American supply chains.
Since January 1, 1994, trilateral agreements eliminating tariffs and other barriers to free trade among the U.S., Mexico, and Canada have turned the bloc into a global economic powerhouse, supported by integrated cross-border supply chains in key sectors. The first trade agreement, the North American Free Trade Agreement, or NAFTA, was superseded on July 1, 2020, by the U.S.-Mexico-Canada Agreement (USMCA in the U.S., CUSMA in Canada, and T-MEC in Mexico). The new agreement contained a (then) novel provision: a “sunset clause” that mandated a six-year joint review with the option to extend or switch to annual reviews until 2036.
The mandated review of USMCA was to have begun July 1. Instead, the U.S. Trade Representative announced that USMCA would not be renewed in its current form (although it continues in force for now). The U.S. said it would pursue bilateral negotiations with its trade partners. The fourth round of U.S.-Mexico bilateral talks is slated for September in Washington, D.C. No bilateral negotiations between the U.S. and Canada have been scheduled.
Canadian Cliffhanger
On July 20, President Donald Trump issued executive orders imposing 50% tariffs on dairy products, automobiles and auto parts, and alcoholic beverages imported from Canada, effective on August 19. The executive authority cited was contained in Section 338 of the Smoot-Hawley Tariff Act of 1930, which permits levies as a countermeasure to discriminatory treatment of U.S. products in foreign markets. Because vehicles and components can cross borders several times during production, the measures also threatened the integrated North American automotive supply chain. The U.S. announced a three-day delay to permit negotiations aimed at addressing the issues it had raised. By all accounts (see, e.g., the Financial Times report), the talks ranged far beyond the pending Section 338 tariffs, touching on issues that were non-negotiable (at least within a three-day timeframe).
A tit-for-tat exchange of tariffs gained momentum: Prime Minister Carney promised Canada would meet the U.S. levies dollar-for-dollar with customs duties of its own. On August 24, President Trump threatened to raise the tariffs on Canadian cars and steel another 50%, effective January 1, 2027. The next day, Canada unveiled its counter tariffs: a 50% levy on 700 U.S. products, accounting for $20 billion in trade, effective September 8.
[This is a developing story current at the time of writing: August 31, 2026.]
Chipping Away at Tariff-Free Guarantees
With a few exceptions (such as dairy products), the North American trilateral trade agreements eliminated tariffs on goods originating within the bloc. In March 2018, citing national security, the first Trump Administration imposed protective tariffs on steel and aluminum imports under the authority of Section 232 [of the Trade Expansion Act of 1962]. Initially exempt under NAFTA, imports from Canada and Mexico became subject to the Section 232 levies in June of that year, after negotiations to strike better deals with the U.S. fell through.
In 2019, the U.S. implemented Section 232 tariffs on Canadian and Mexican auto and auto part imports but limited their application to each product’s non-U.S. content.
Fast-forward to the second Trump Administration: In the first quarter of 2025, new tariffs under the International Emergency Economic Powers Act (IEEPA) were deployed (and ratcheted up) to spur Canada and Mexico to step up enforcement against cross-border drug trafficking and illegal migration. In April 2025, the U.S. invoked IEEPA to roll out so-called reciprocal tariffs, aimed at reducing trade imbalances. Most goods that complied with USMCA rules of origin continued to be tariff-free.
For its part, Canada countered the U.S. IEEPA tariffs with 25% tariffs on a broad range of U.S. goods on March 4, 2025. Canada lifted most of its retaliatory tariffs on September 1, 2025, but left sector-specific tariffs on steel, aluminum, and automobiles in place.
When the U.S. Supreme Court tossed the IEEPA tariffs in February 2026, the Trump Administration launched Section 122 tariffs to take their place, with carve-outs for products already subject to the sectoral tariffs and USMCA-compliant products of Canada and Mexico.
In contrast, the broad-ranging Section 338 tariffs that took effect August 22 extend to a number of products that would be duty-free under USMCA, as do the Canadian counter tariffs, set to enter into force September 8.
Tracking Tariffs’ Impact on USMCA and North American Trade
Tariffs have worked to reduce U.S. reliance on Chinese imports. Ten years ago, China was the top country of origin for U.S. imports, commanding a 21% share by value of this trade. Mexico surged past China to become the top source as of 2023. In 2025, Canada moved up to second place, while China slipped to third, with its share dwindling to 9%.
Together, Mexico and Canada accounted for 29% of U.S. imports in the first half of 2026. These trade partners are also the top markets for U.S. exports, as they have been for more than a decade. USMCA markets were the destination for 30% of U.S. outbound trade through June of this year.
Descartes Datamyne U.S. Census trade data shows signs that the U.S. tariff regime has worked to erode the USMCA partners’ share of U.S. trade:
Figure 1. USMCA Partners’ Share of U.S. Trade 2022-2026
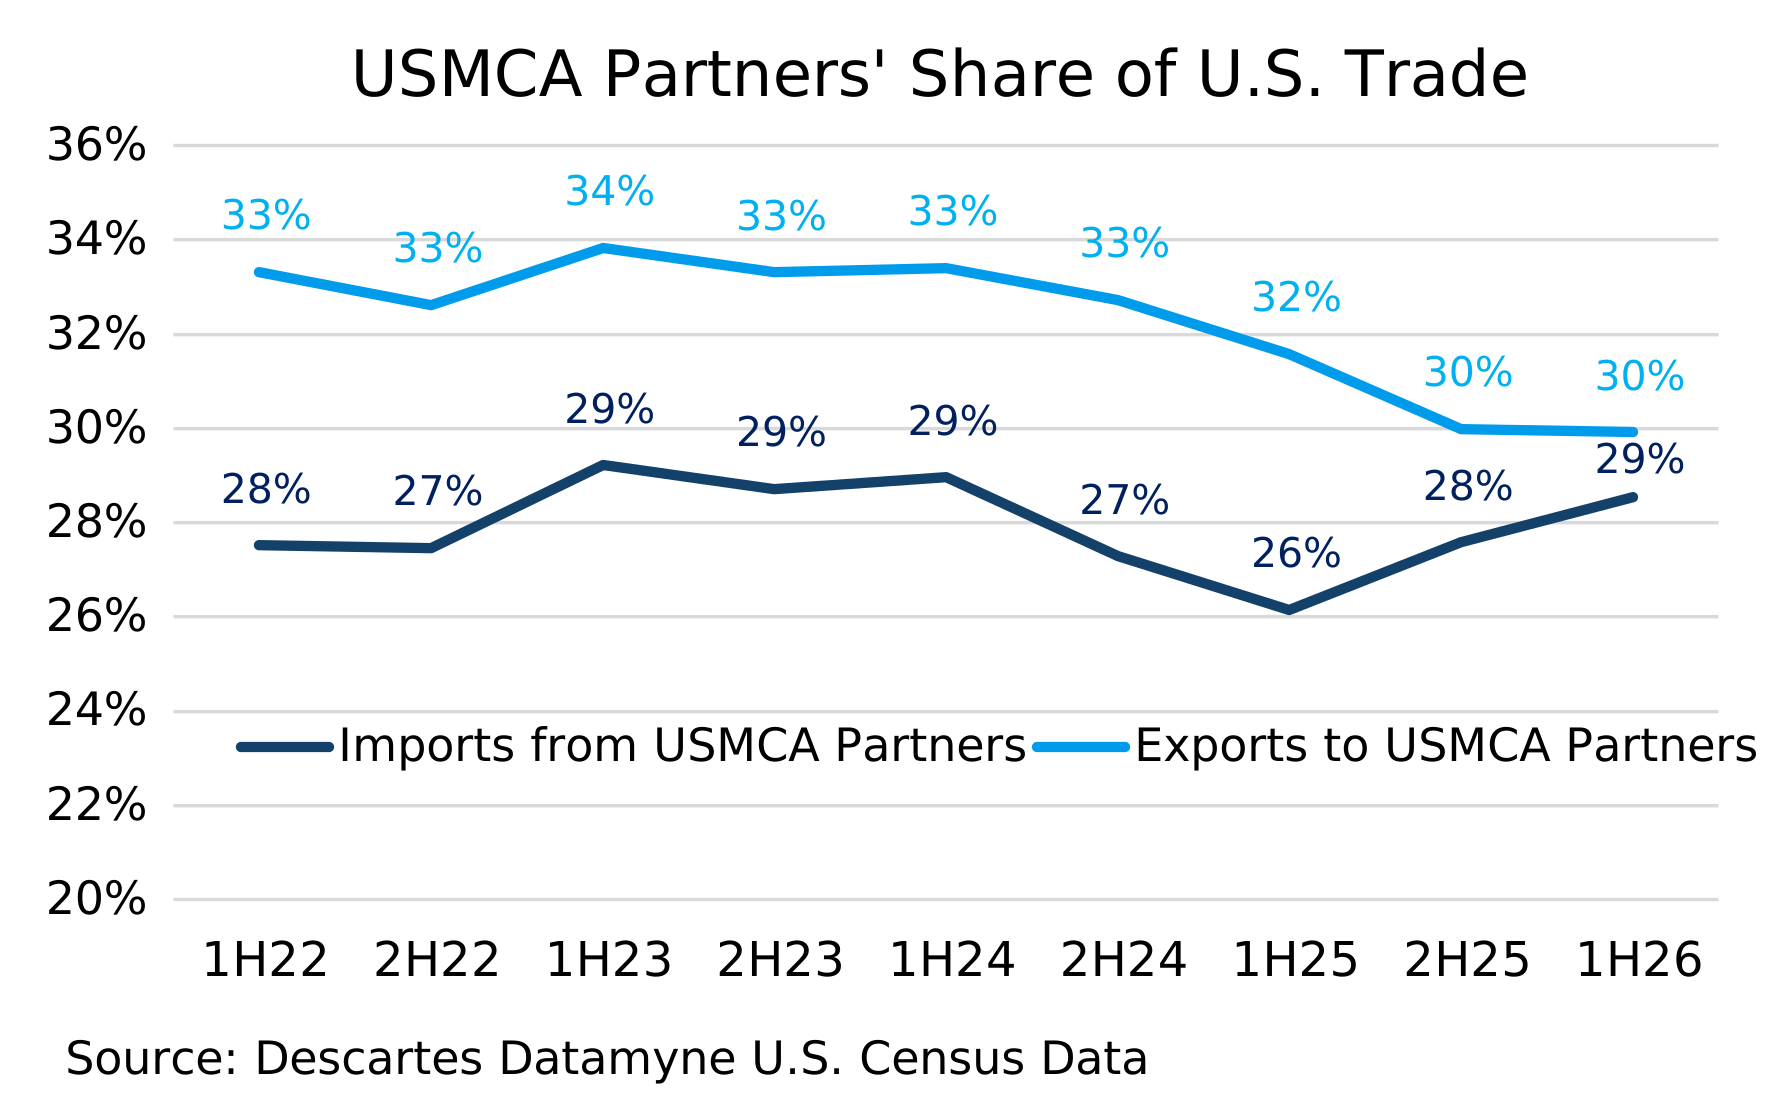
As the data indicates, U.S. imports from within the bloc dipped in 1H25, when IEEPA tariffs rolled out, but appear to have recovered. U.S. exports to its North American neighbors have edged down since 1H25. Certainly, Canada’s retaliatory tariffs have contributed to the decline. The explanation for the bounce-back in U.S. imports from its USMCA partners may lie in a finding of the Penn Wharton Budget Model:
Figure 2. Share of U.S. Imports Exempt from Tariffs under USMCA
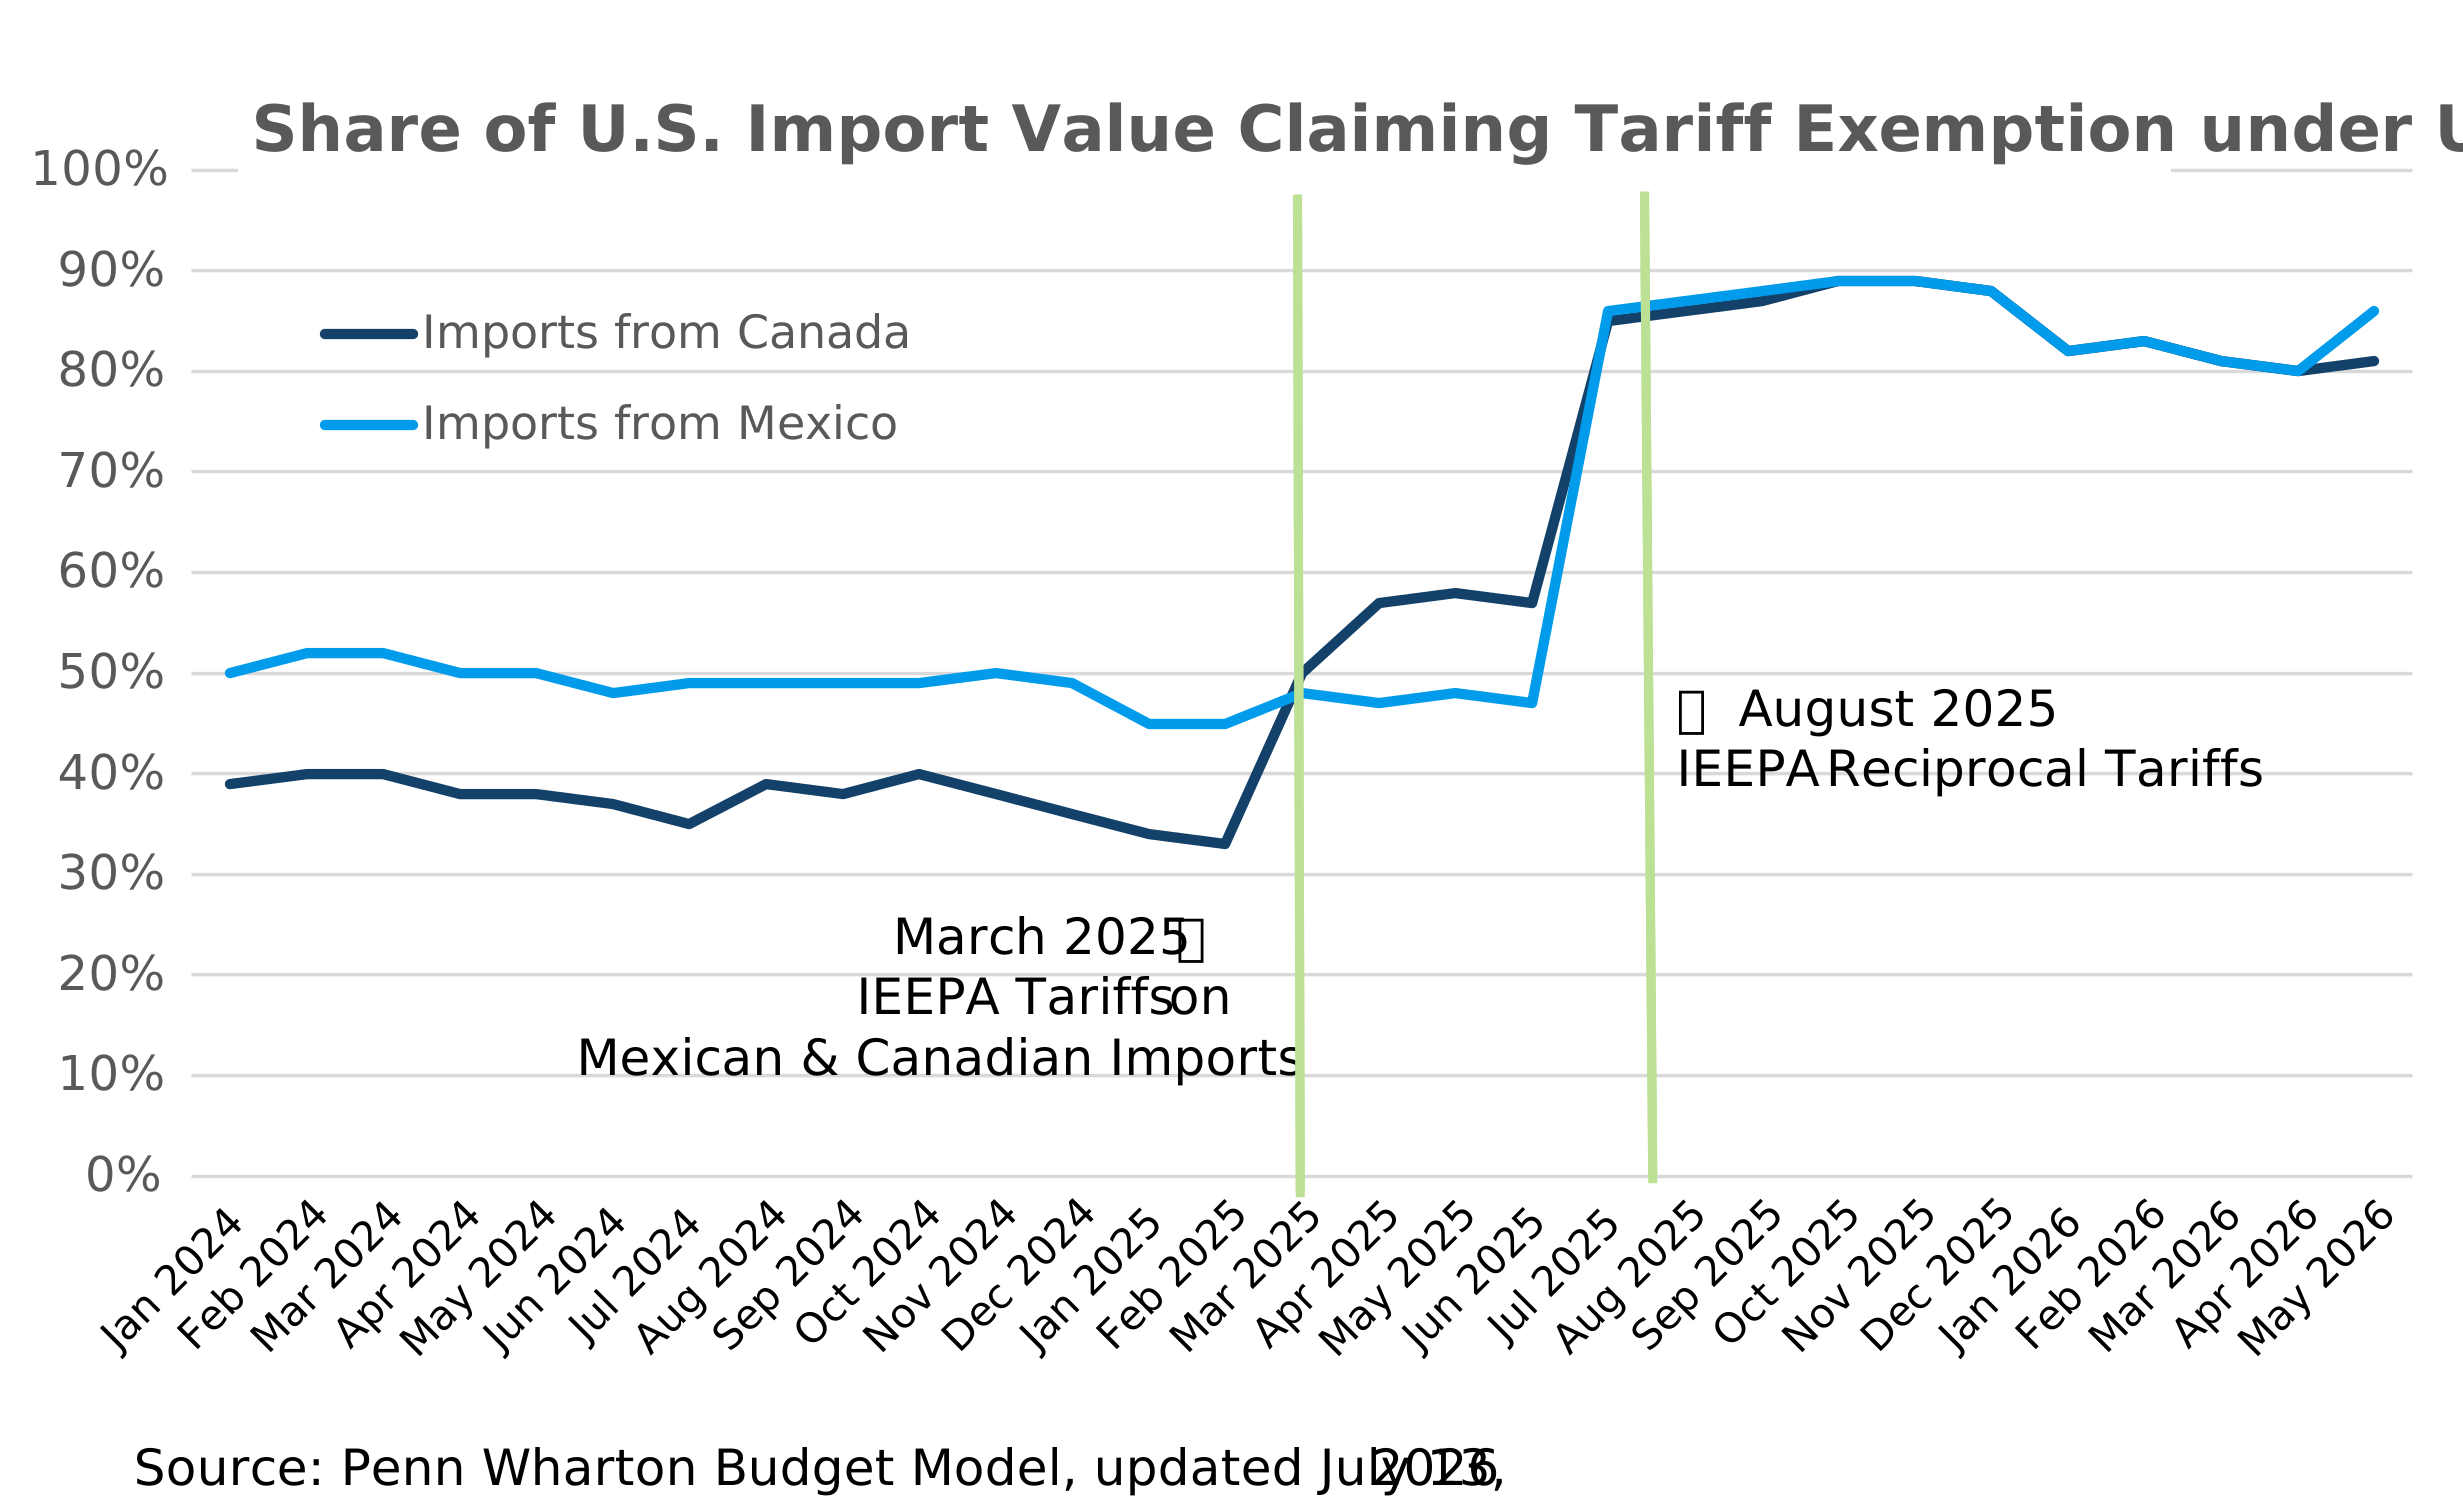
Noting the sharp increase for both countries, Penn Wharton suggests that the surge reflects importers aggressively leveraging USMCA rules of origin to secure duty-free status and avoid higher tariff rates. In other words, duty-free treatment encourages trade.
While Mexican and Canadian importers appear to have adopted the strategy of shifting to products that meet USMCA ROOs, the Descartes Datamyne trade data shows the two countries parting ways when it comes to trade with the U.S. Here, for instance, is the data comparing U.S. imports from Mexico with those sourced from Canada over the 18 months ending in June 2026:
Figure 3. Monthly Share of U.S. Imports by USMCA Partner January 2025 through June 2026
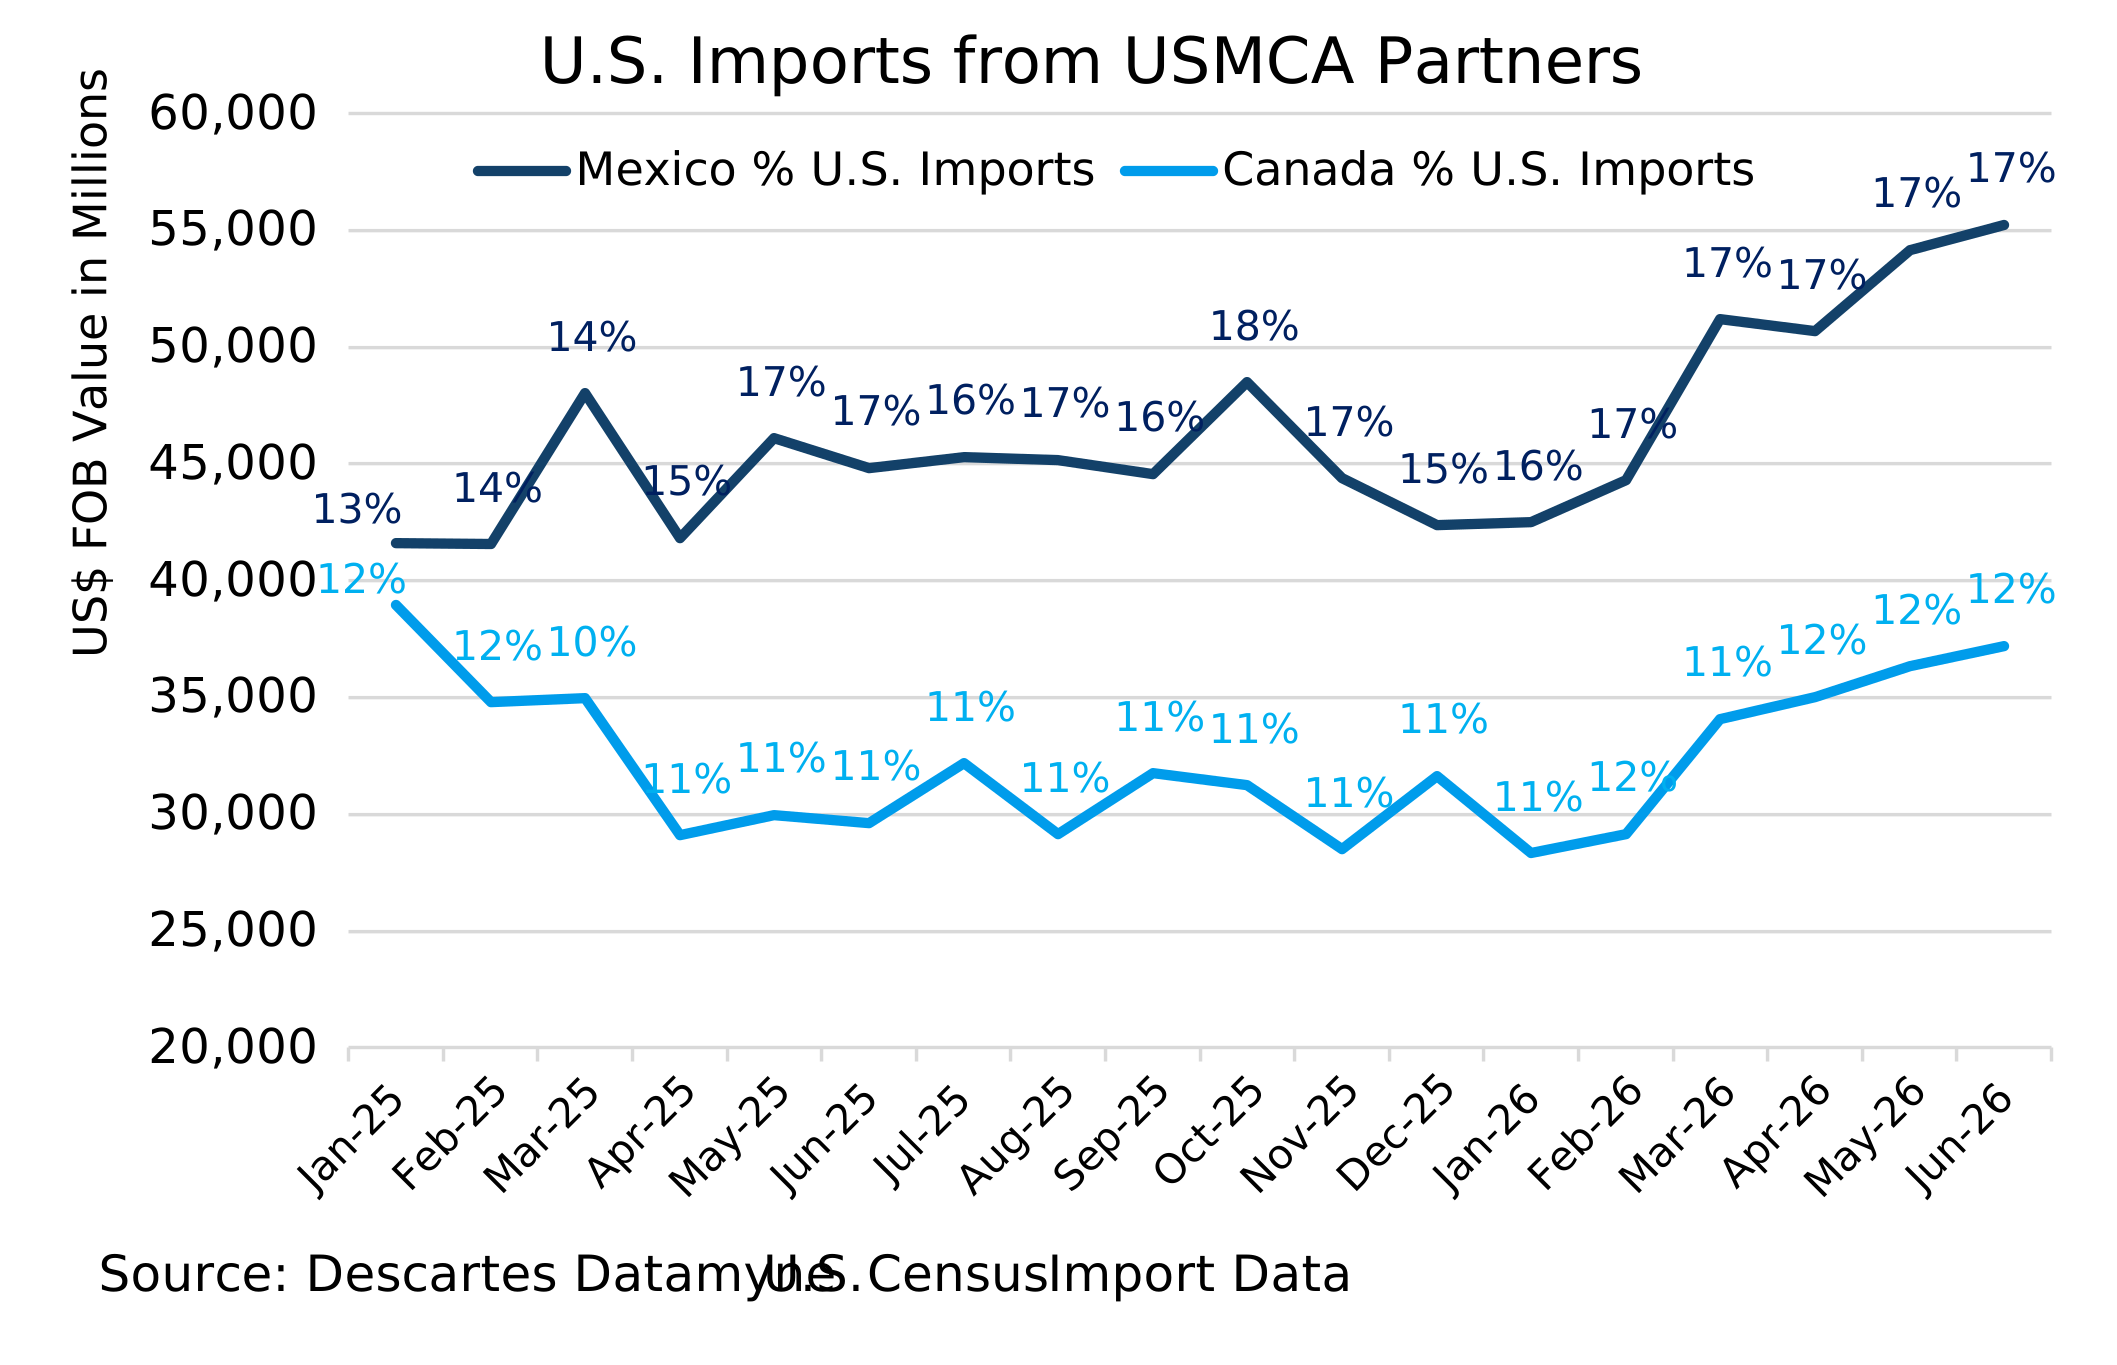
While both partners have seen ups and downs in outbound trade with the U.S., Mexico has grown its market share by four percentage points, while Canada has only recovered the 12% share with which it began the period. Figure 4 tracks U.S. exports to USMCA partners over the same 18 months:
Figure 4. Monthly Share of U.S. Exports by USMCA Partner January 2025 through June 2026
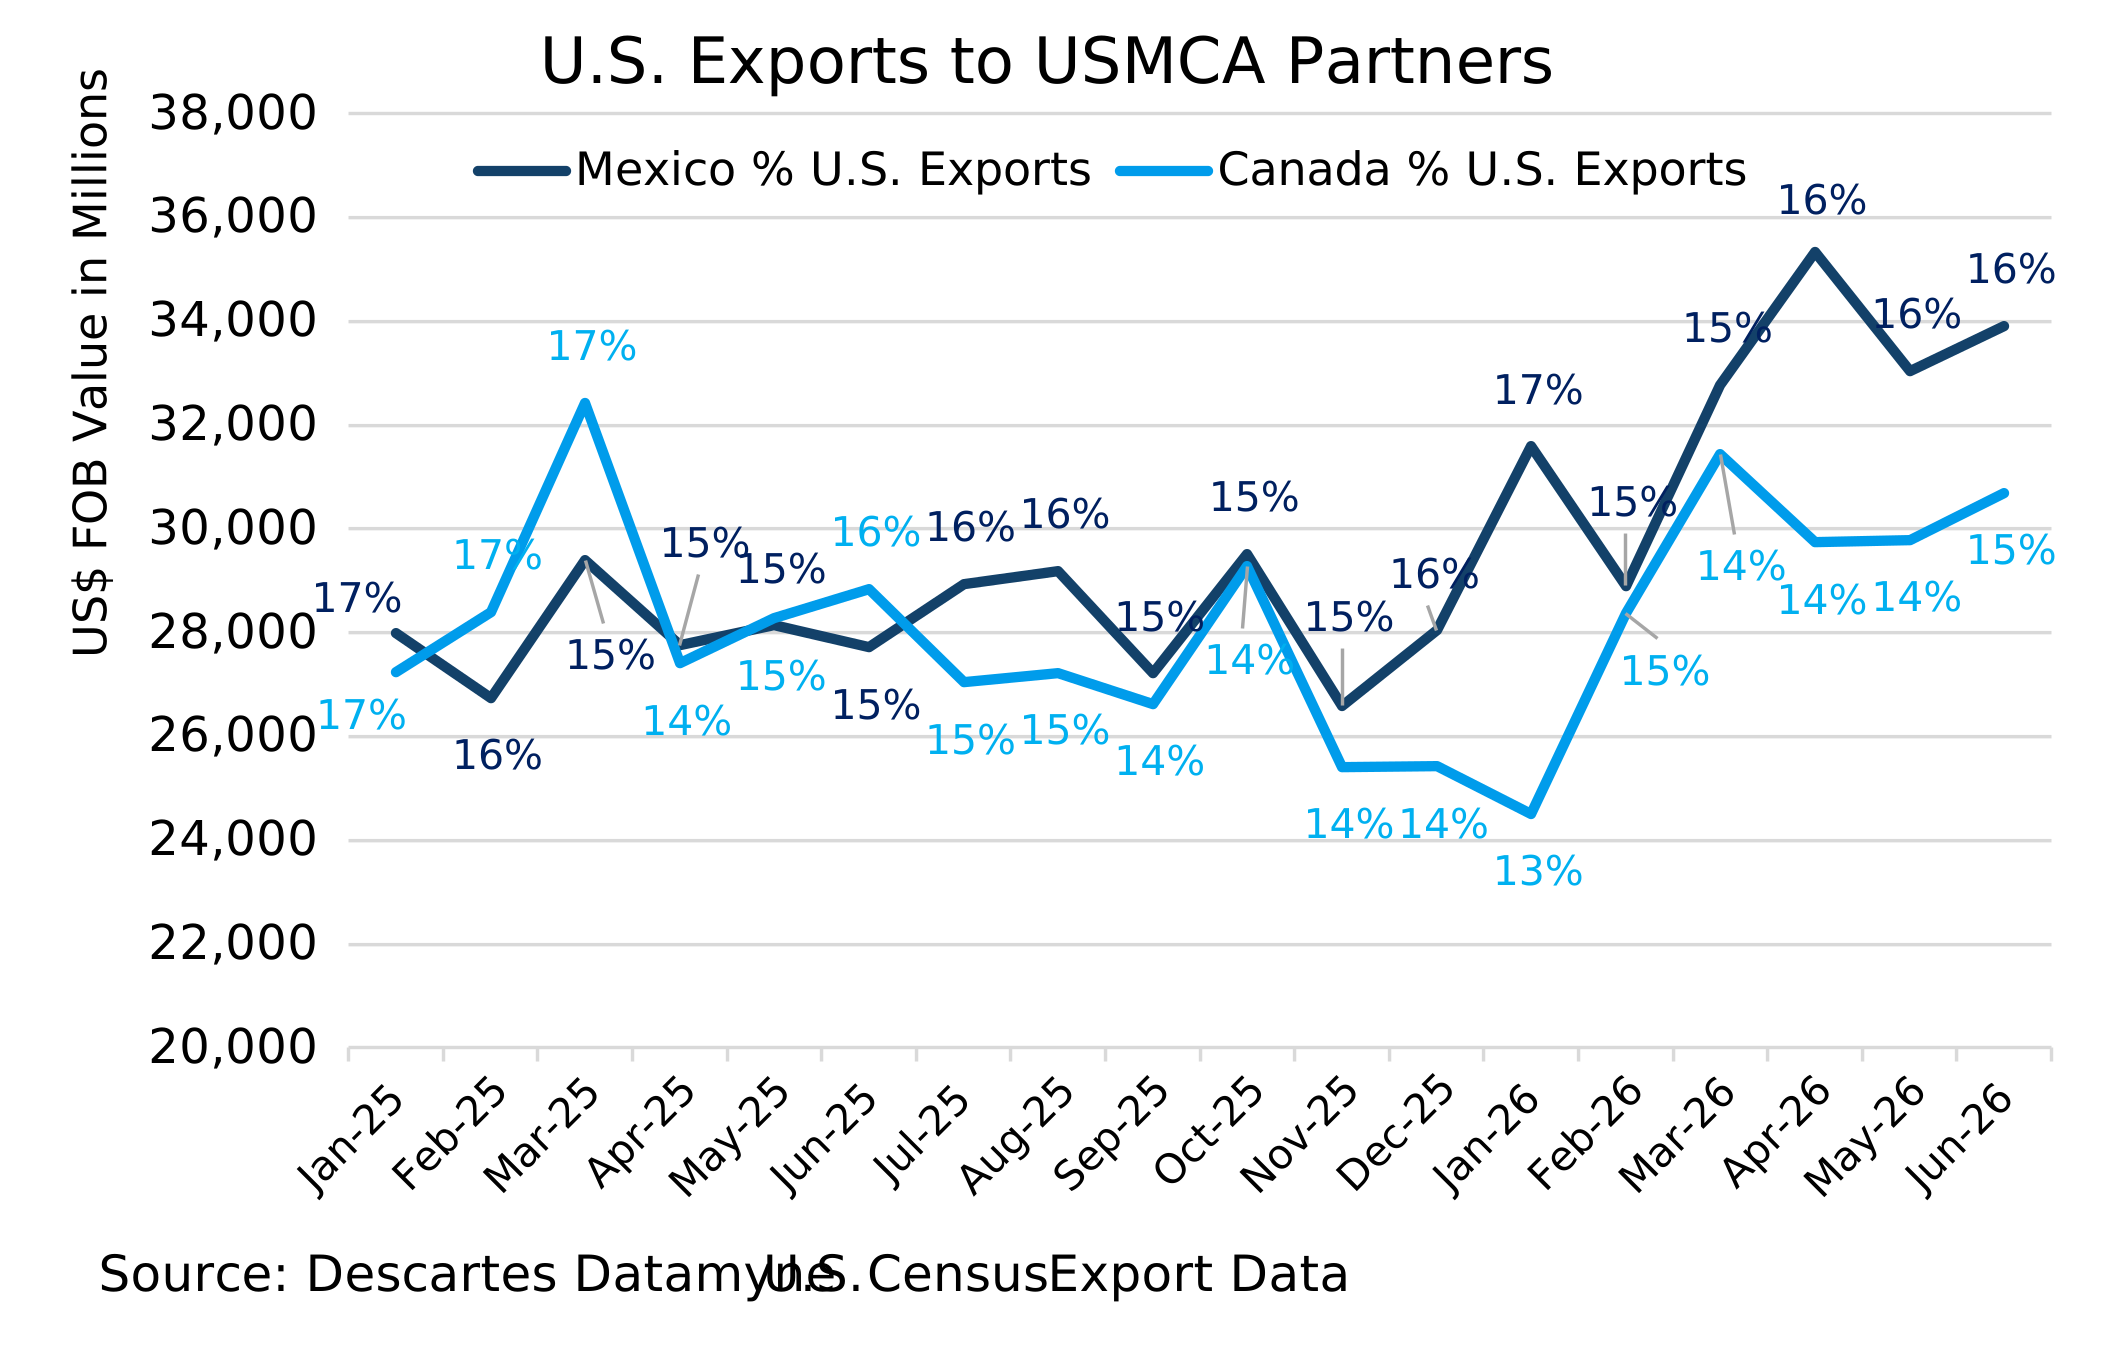
Note that, while the dollar value of U.S. exports to each partner appears to be trending up, their relative percentage share of this trade has stabilized at 16% for Mexico and 14%-15% for Canada. Both are slightly less than the 17% shares claimed in January 2025. This may be an early indicator that U.S. efforts to boost exports and diversify markets (including the Agreement on Reciprocal Trade program) may be achieving results.
Canada Trade Limits Tariff Impact
Successive rounds of tariffs targeting specific sectors have affected the mix of products traded by the USMCA partners as well. International trade data from Descartes Datamyne provides comparative views of the top imports and exports in the 12 months before and after the share of U.S. imports from Canada and Mexico claiming duty-free treatment surged from 50% or less to 80% or more.
Figures 5 and 6 show two views of Canada’s top 10 exports ranked by value: the first covers the 12 months from July 2024 through June 2025, and the second from July 2025 through June 2026:
Figure 5. Canada’s Top 10 Exports before U.S. Tariffs
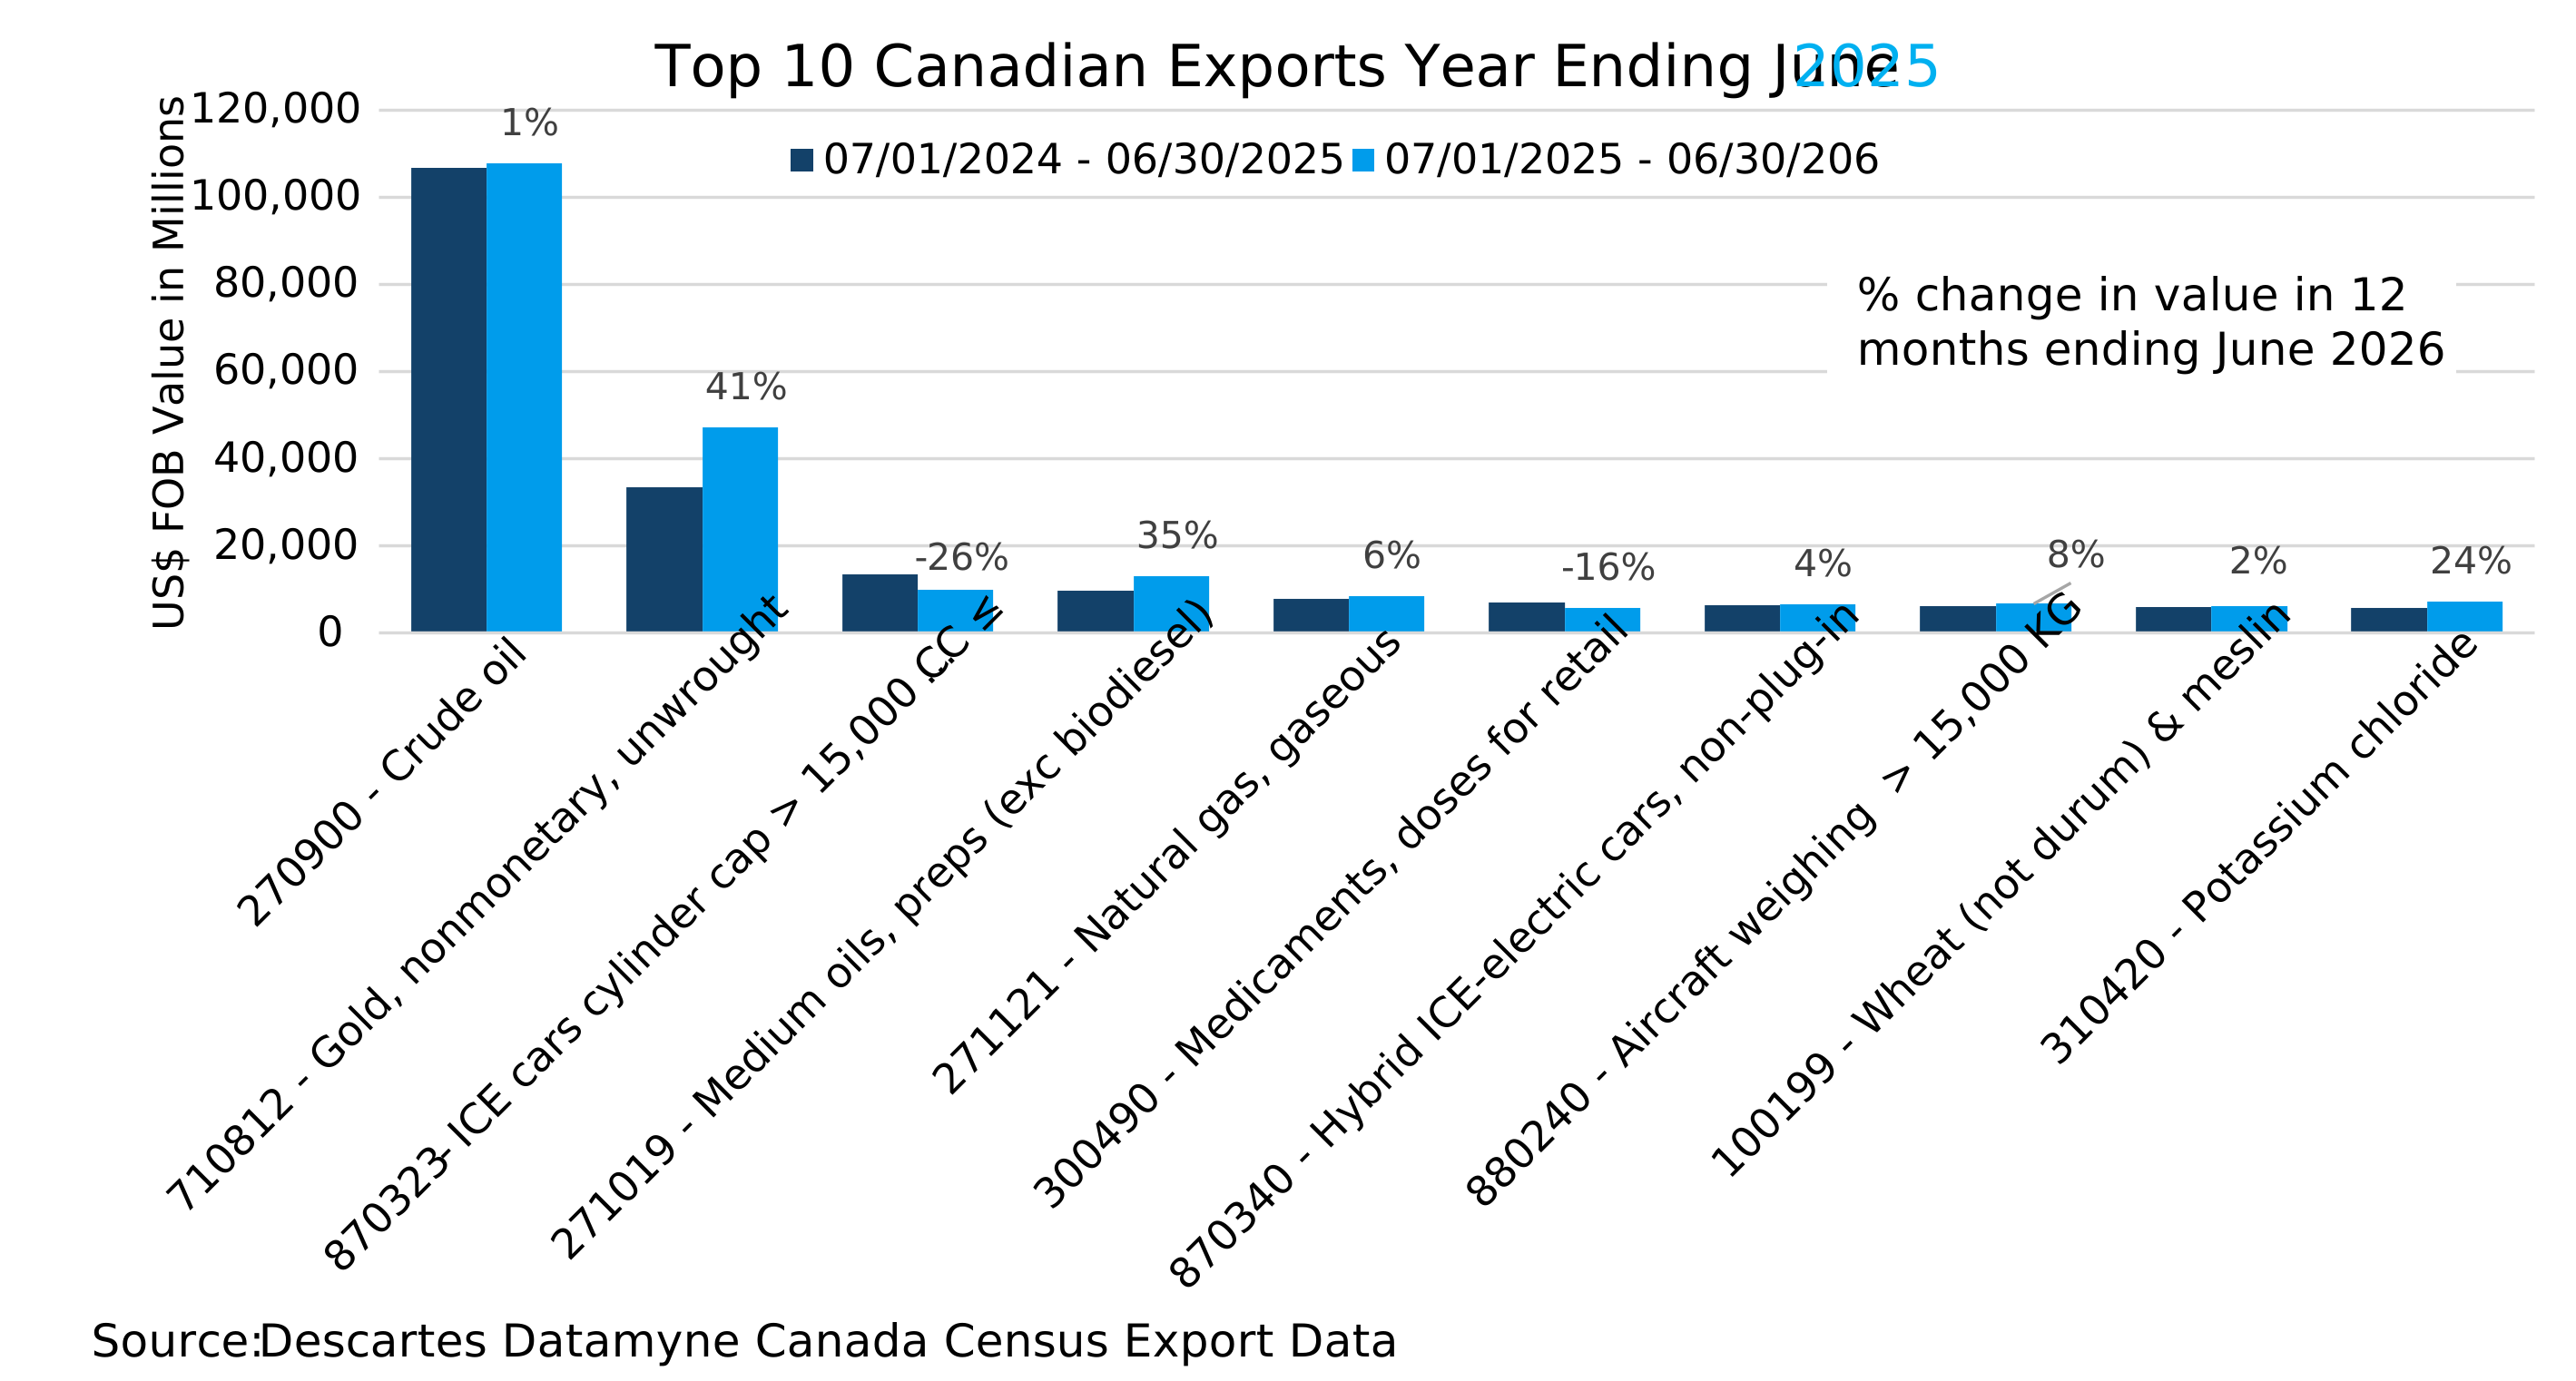
Figure 6. Canada’s Top 10 Exports after U.S. Tariffs
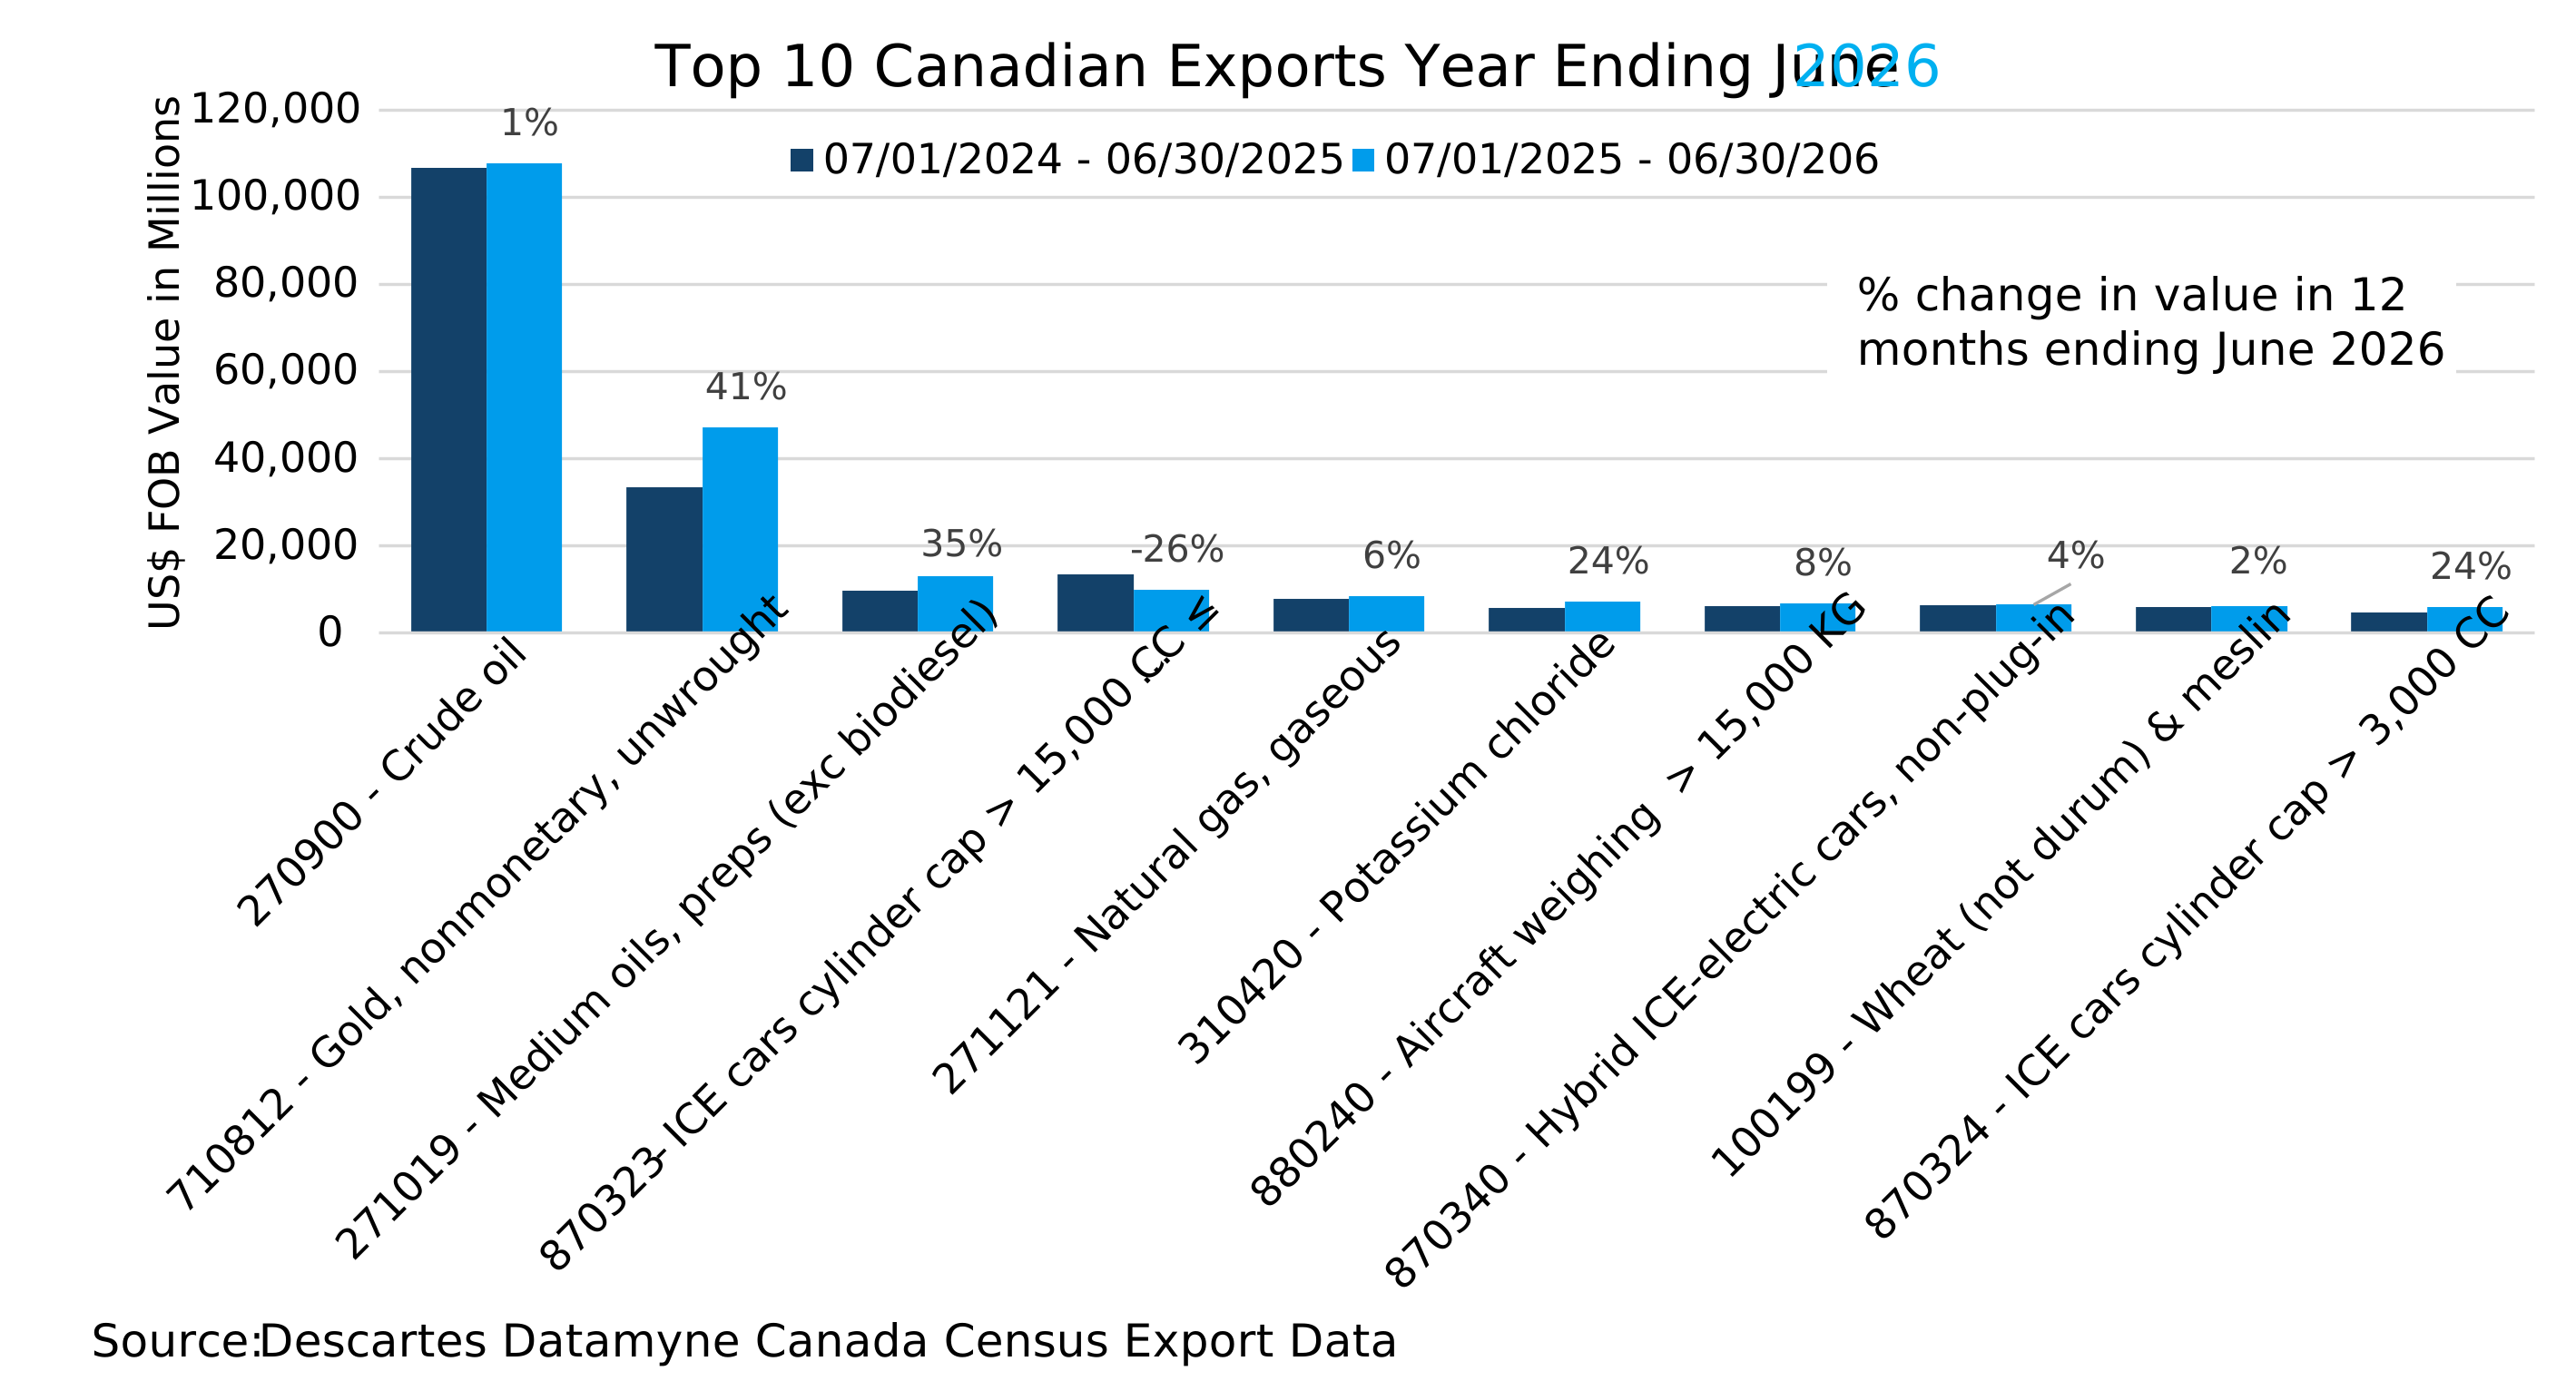
U.S. tariffs appear to have slowed, but not reversed Canadian exports, which increased 2.5% overall in the year ending June 2026. The U.S. was the destination for 69% of Canada’s exports, down from 75% the prior year. Canada’s outbound trade with the U.S. fell 5.3%, offset by exports to all other markets, which gained 26%.
The flow of crude oil [HS270900], the top export, remained little changed year over year. Medicaments [HS300490], ranked fifth by value in 2024-25, slid to No. 11 after a 16% decline, the casualty of U.S. Section 232 tariffs applied in October 2025 (and recently adjusted) to branded and patented pharmaceutical products. Interestingly, hybrid gasoline-electric cars [HS870340] gained 4%.
Canadian exports of potassium chloride [HS310420], an ingredient in fertilizers that was subject to IEEPA tariffs, increased 24%. The U.S. remained the top destination, but its share of Canadian exports edged down from 50% to 45%. The Canadian product accounted for 89% of U.S. imports in the year ending June 2026 versus 87% in the prior 12-month period, with Canada making up for the loss of supply from Russia, while sending more product to other markets.
Increased trade in gold [HS710812] (in both directions) was an indirect result of the U.S. tariff regime as market uncertainty drove up sales, even as gold prices dropped.
Figures 7 and 8 show Canada’s top imports before and after U.S. tariffs became a determinant of trade trends:
Figure 7. Canada’s Top 10 Imports before U.S. Tariffs
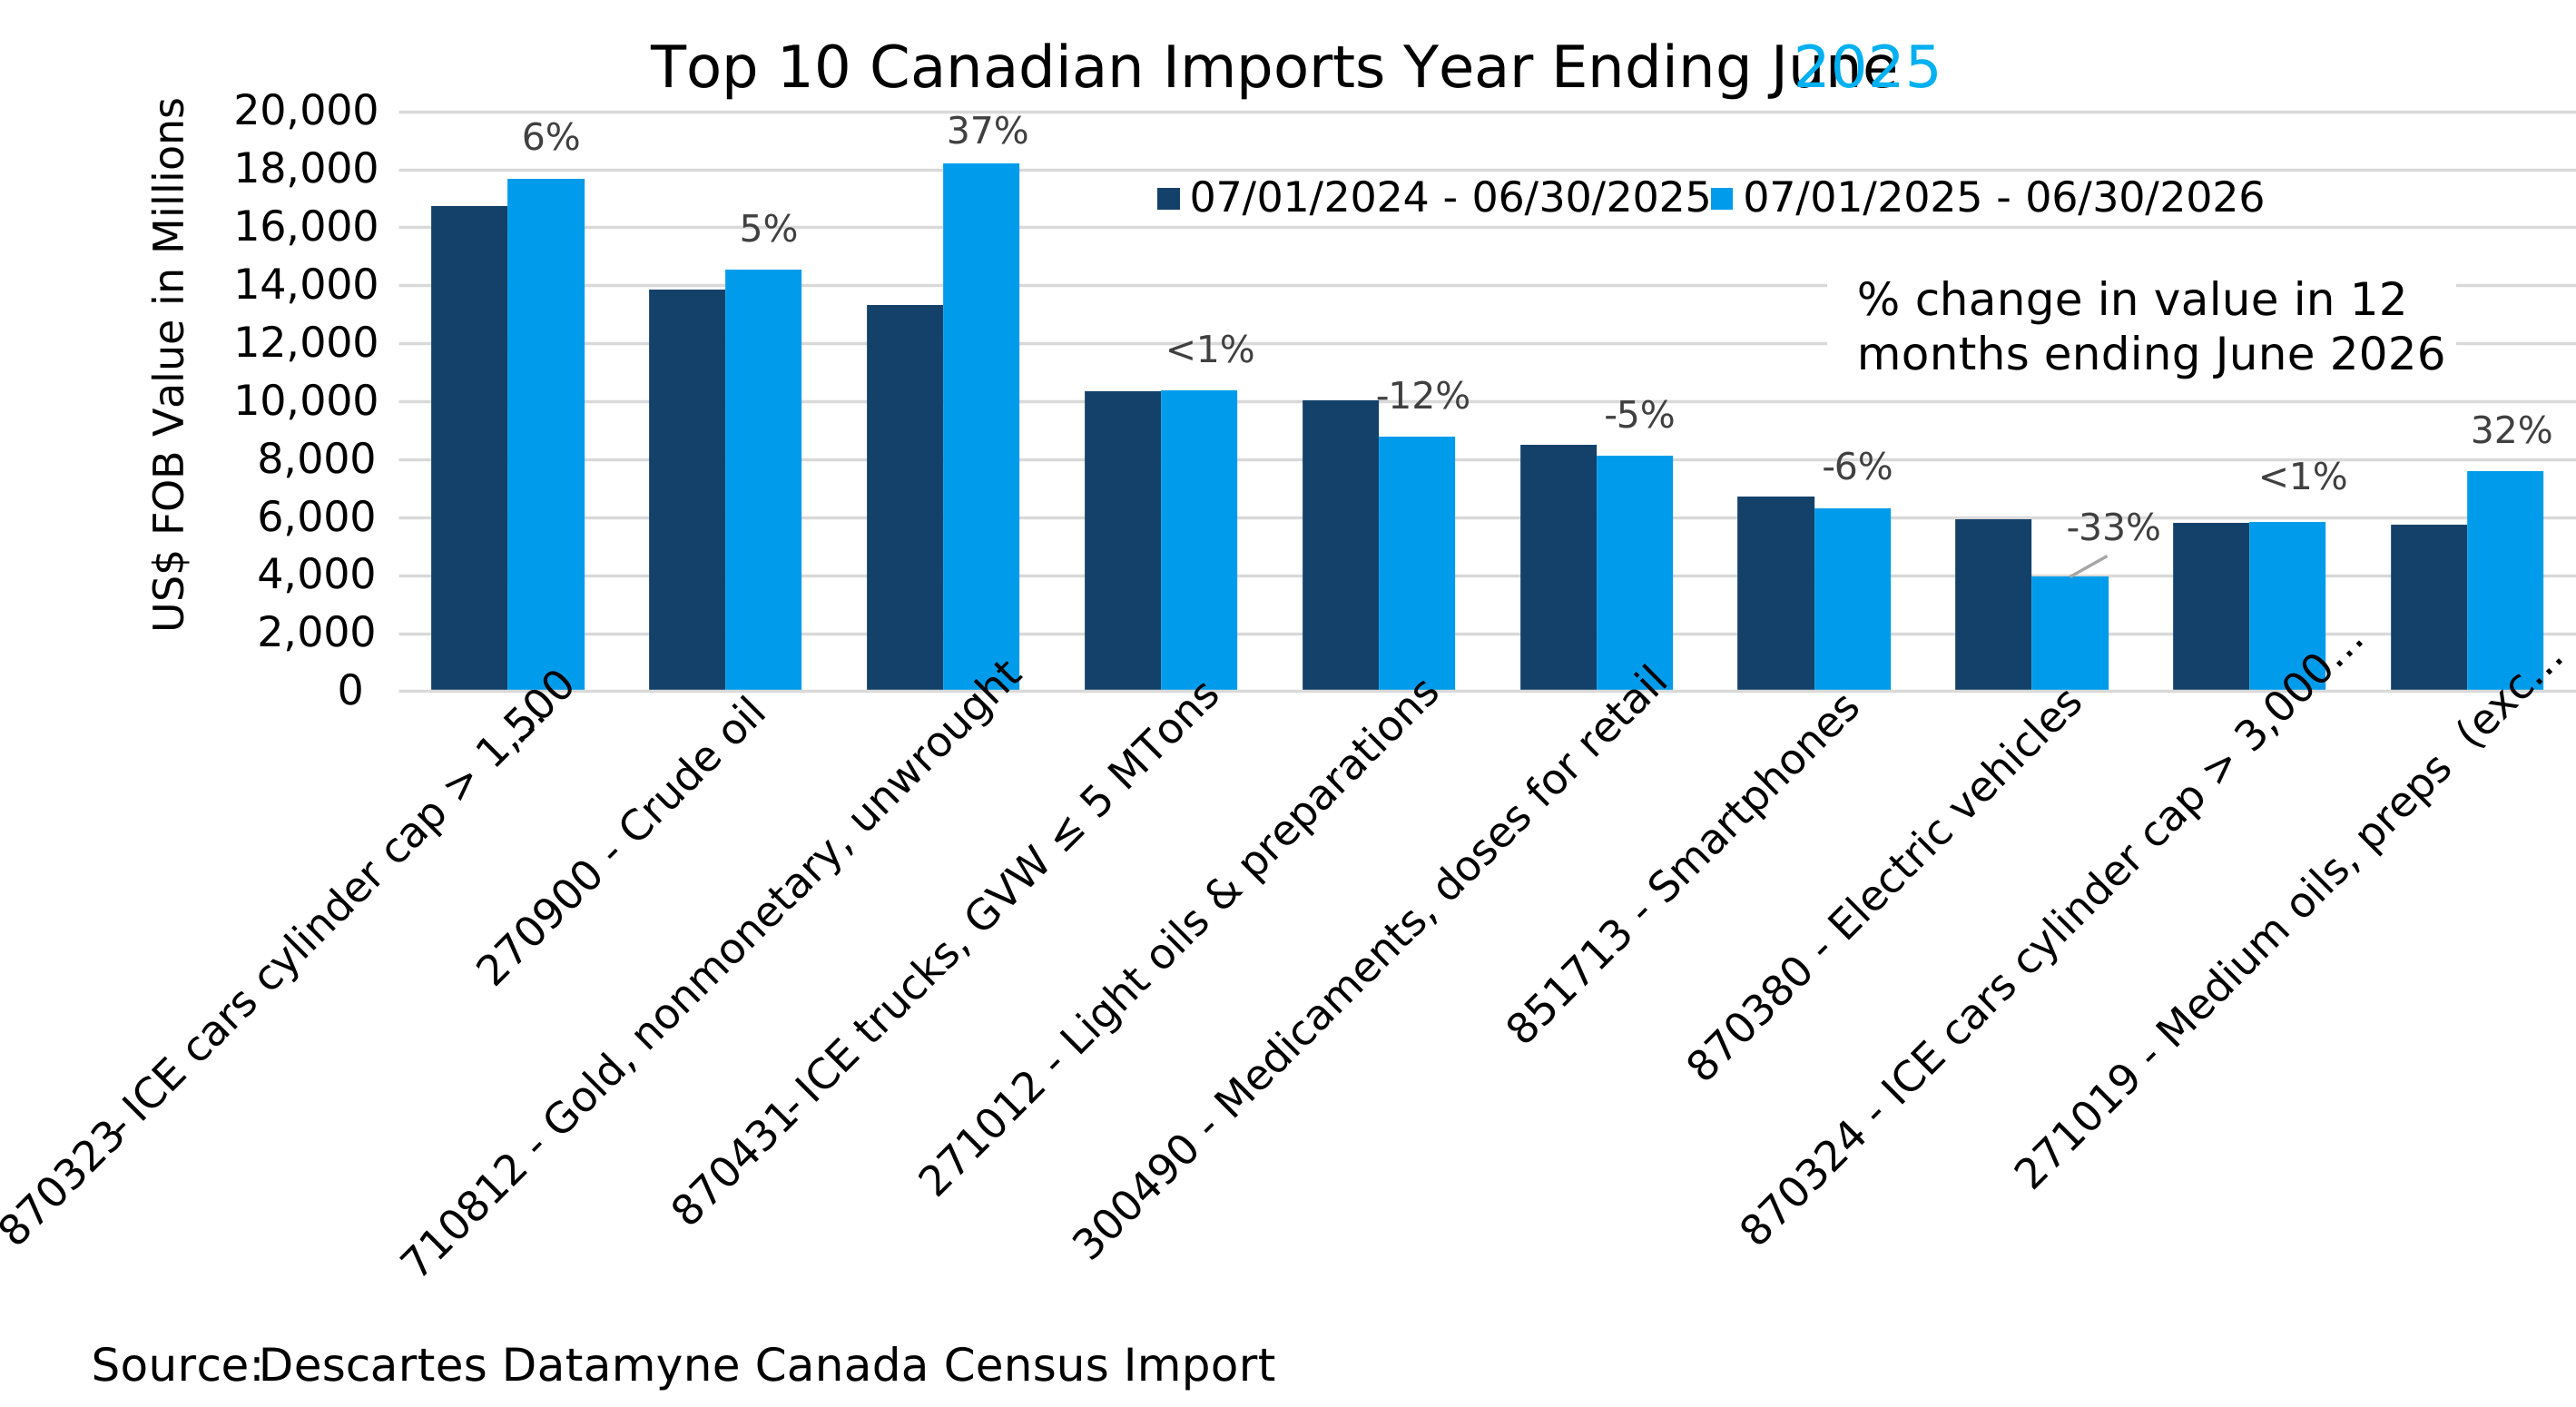
Figure 8. Canada’s Top 10 Imports after U.S. Tariffs
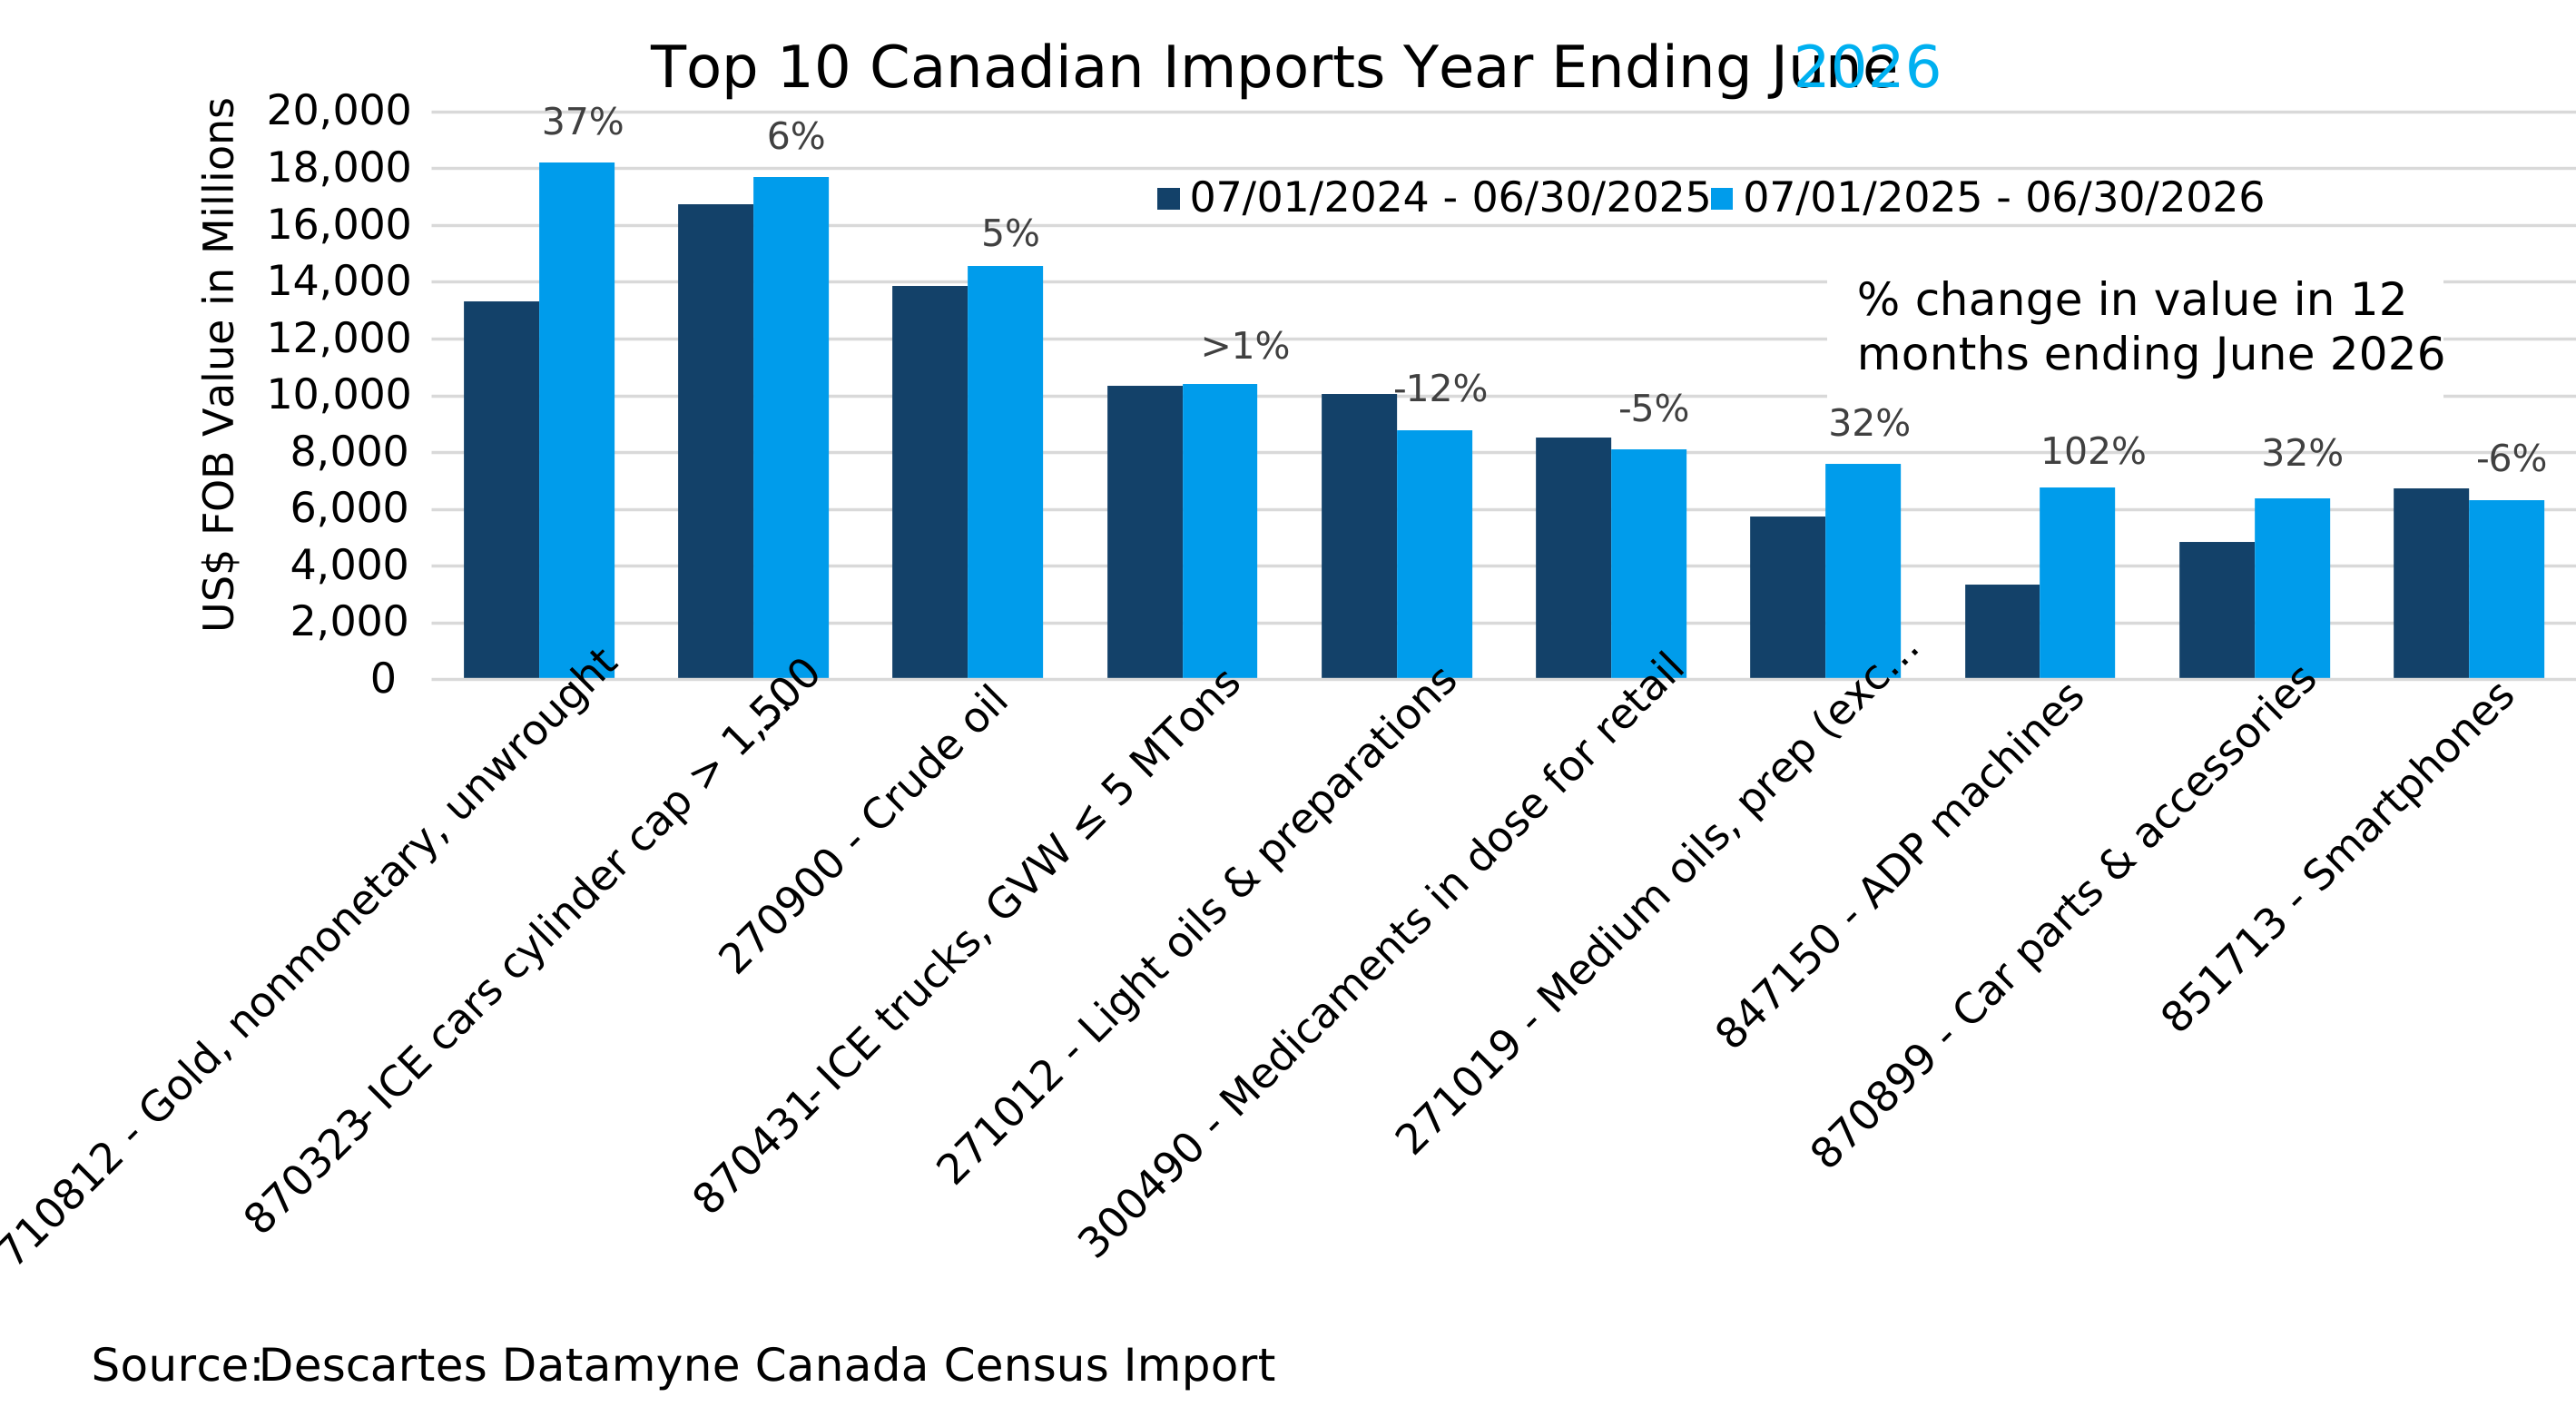
Canada’s inbound trade gained 3.1%, with the U.S. the top country of origin accounting for 45% of this trade as opposed to 48% a year earlier. Imports from the U.S. declined 1.8%, while imports from all other sources increased 7.6%.
The 33% drop in imports of electric vehicles was due in large part to the Canadian government’s decision to retire the rebate that subsidized consumer sales. The newest entry among the top imports, posting the biggest advance with a 102% increase in trade value, was automated data processing (ADP) machines [HS847150] (units for digital processing, storage, input, and output). The leading sources for these products are Canada’s USMCA partners, with Mexico accounting for 41.9%, down from the prior year’s 45.3%, and the U.S. supplying 30.2%, up from 25.5%.
Interestingly, Massachusetts has taken the lead among states shipping digital processors north. Already a hub for semiconductor production, Massachusetts accounted for 29.4% of Canada’s imports of processors from the U.S. in the year ending in June 2026, a big jump from the prior year’s 2.6%.
Mexico Trade Leverages Access to the U.S. Market
Mexican trade with the U.S. has not been burdened with the full weight of tariffs, with many suspended as trade talks between the partners began early and have proceeded. The fourth round of negotiations on USMCA terms is to take place in early September.
The IEEPA reciprocal tariffs have worked to Mexico’s advantage. For global companies evaluating their supply chains in the face of rising U.S. protectionism, locating production in Mexico is seen as an alternative to hubs in Asia and Europe. Mexico has done its part to attract investment in production with IMMEX (Industria Manufacturera, Maquiladora y de Servicios de Exportación), a program that temporarily waives duties or VAT on materials, inputs, and machinery imported by companies manufacturing for export.
Figures 9 and 10 compare Mexico’s top 10 exports ranked by value for the 12 months ending in June 2025 versus the same period through June 2026, based on Descartes Datamyne Mexican Census data:
Figure 9. Mexico’s Top 10 Exports before U.S. Tariffs
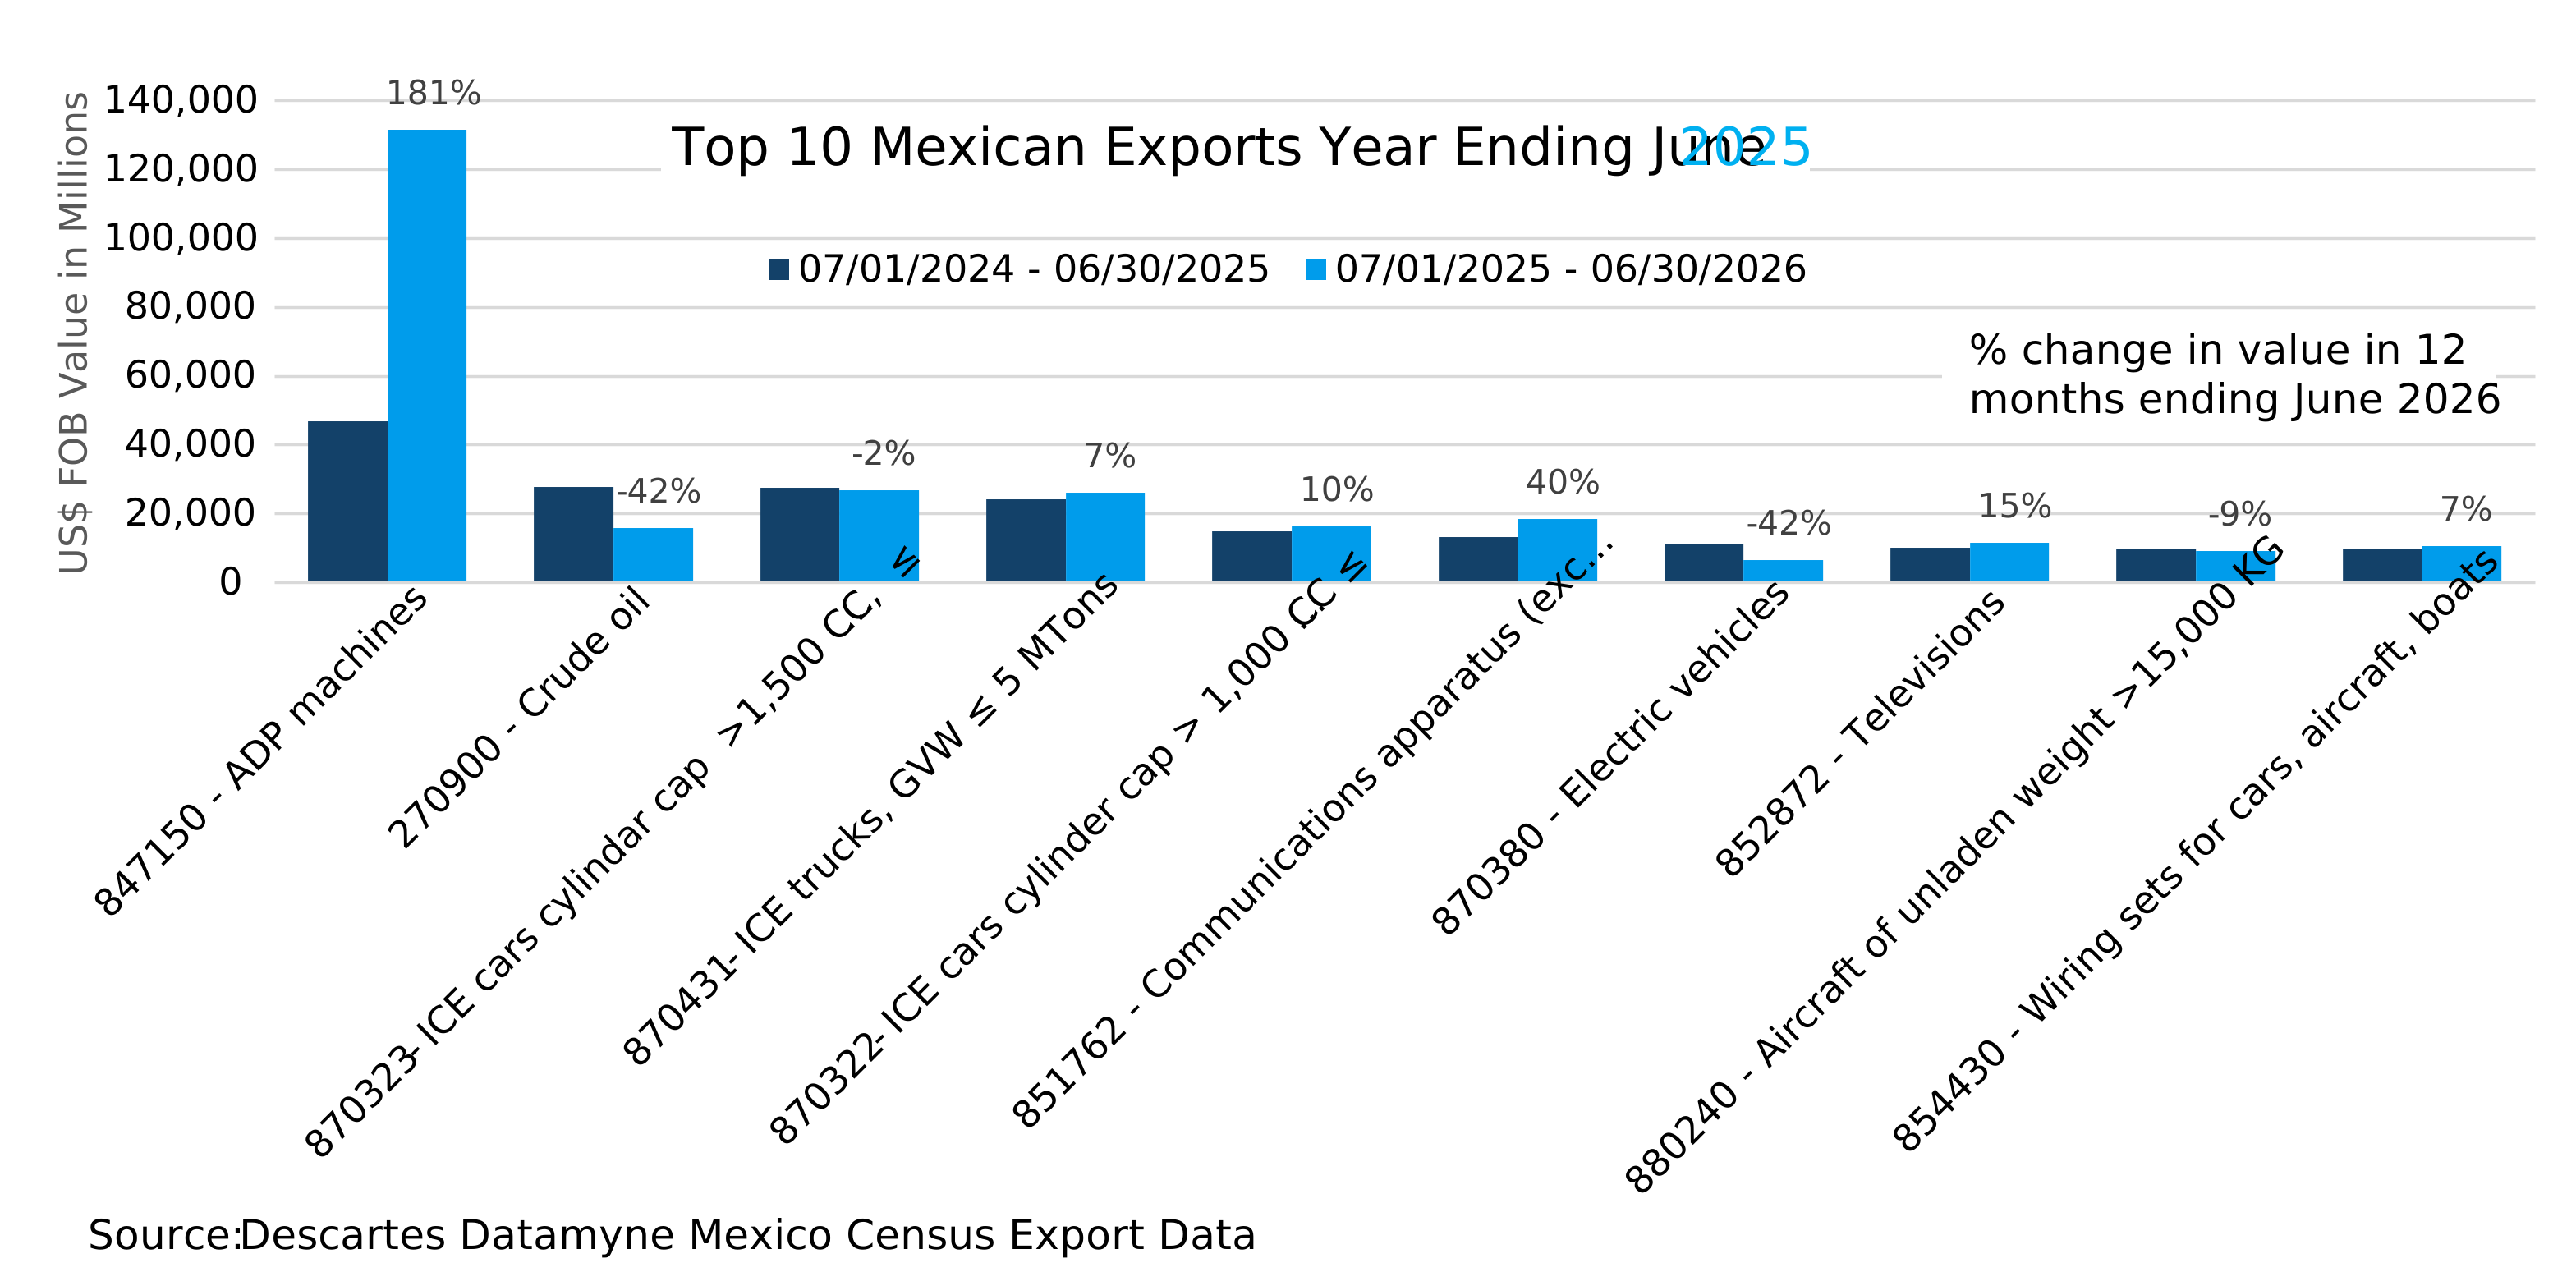
Figure 10. Mexico’s Top 10 Exports after U.S. Tariffs
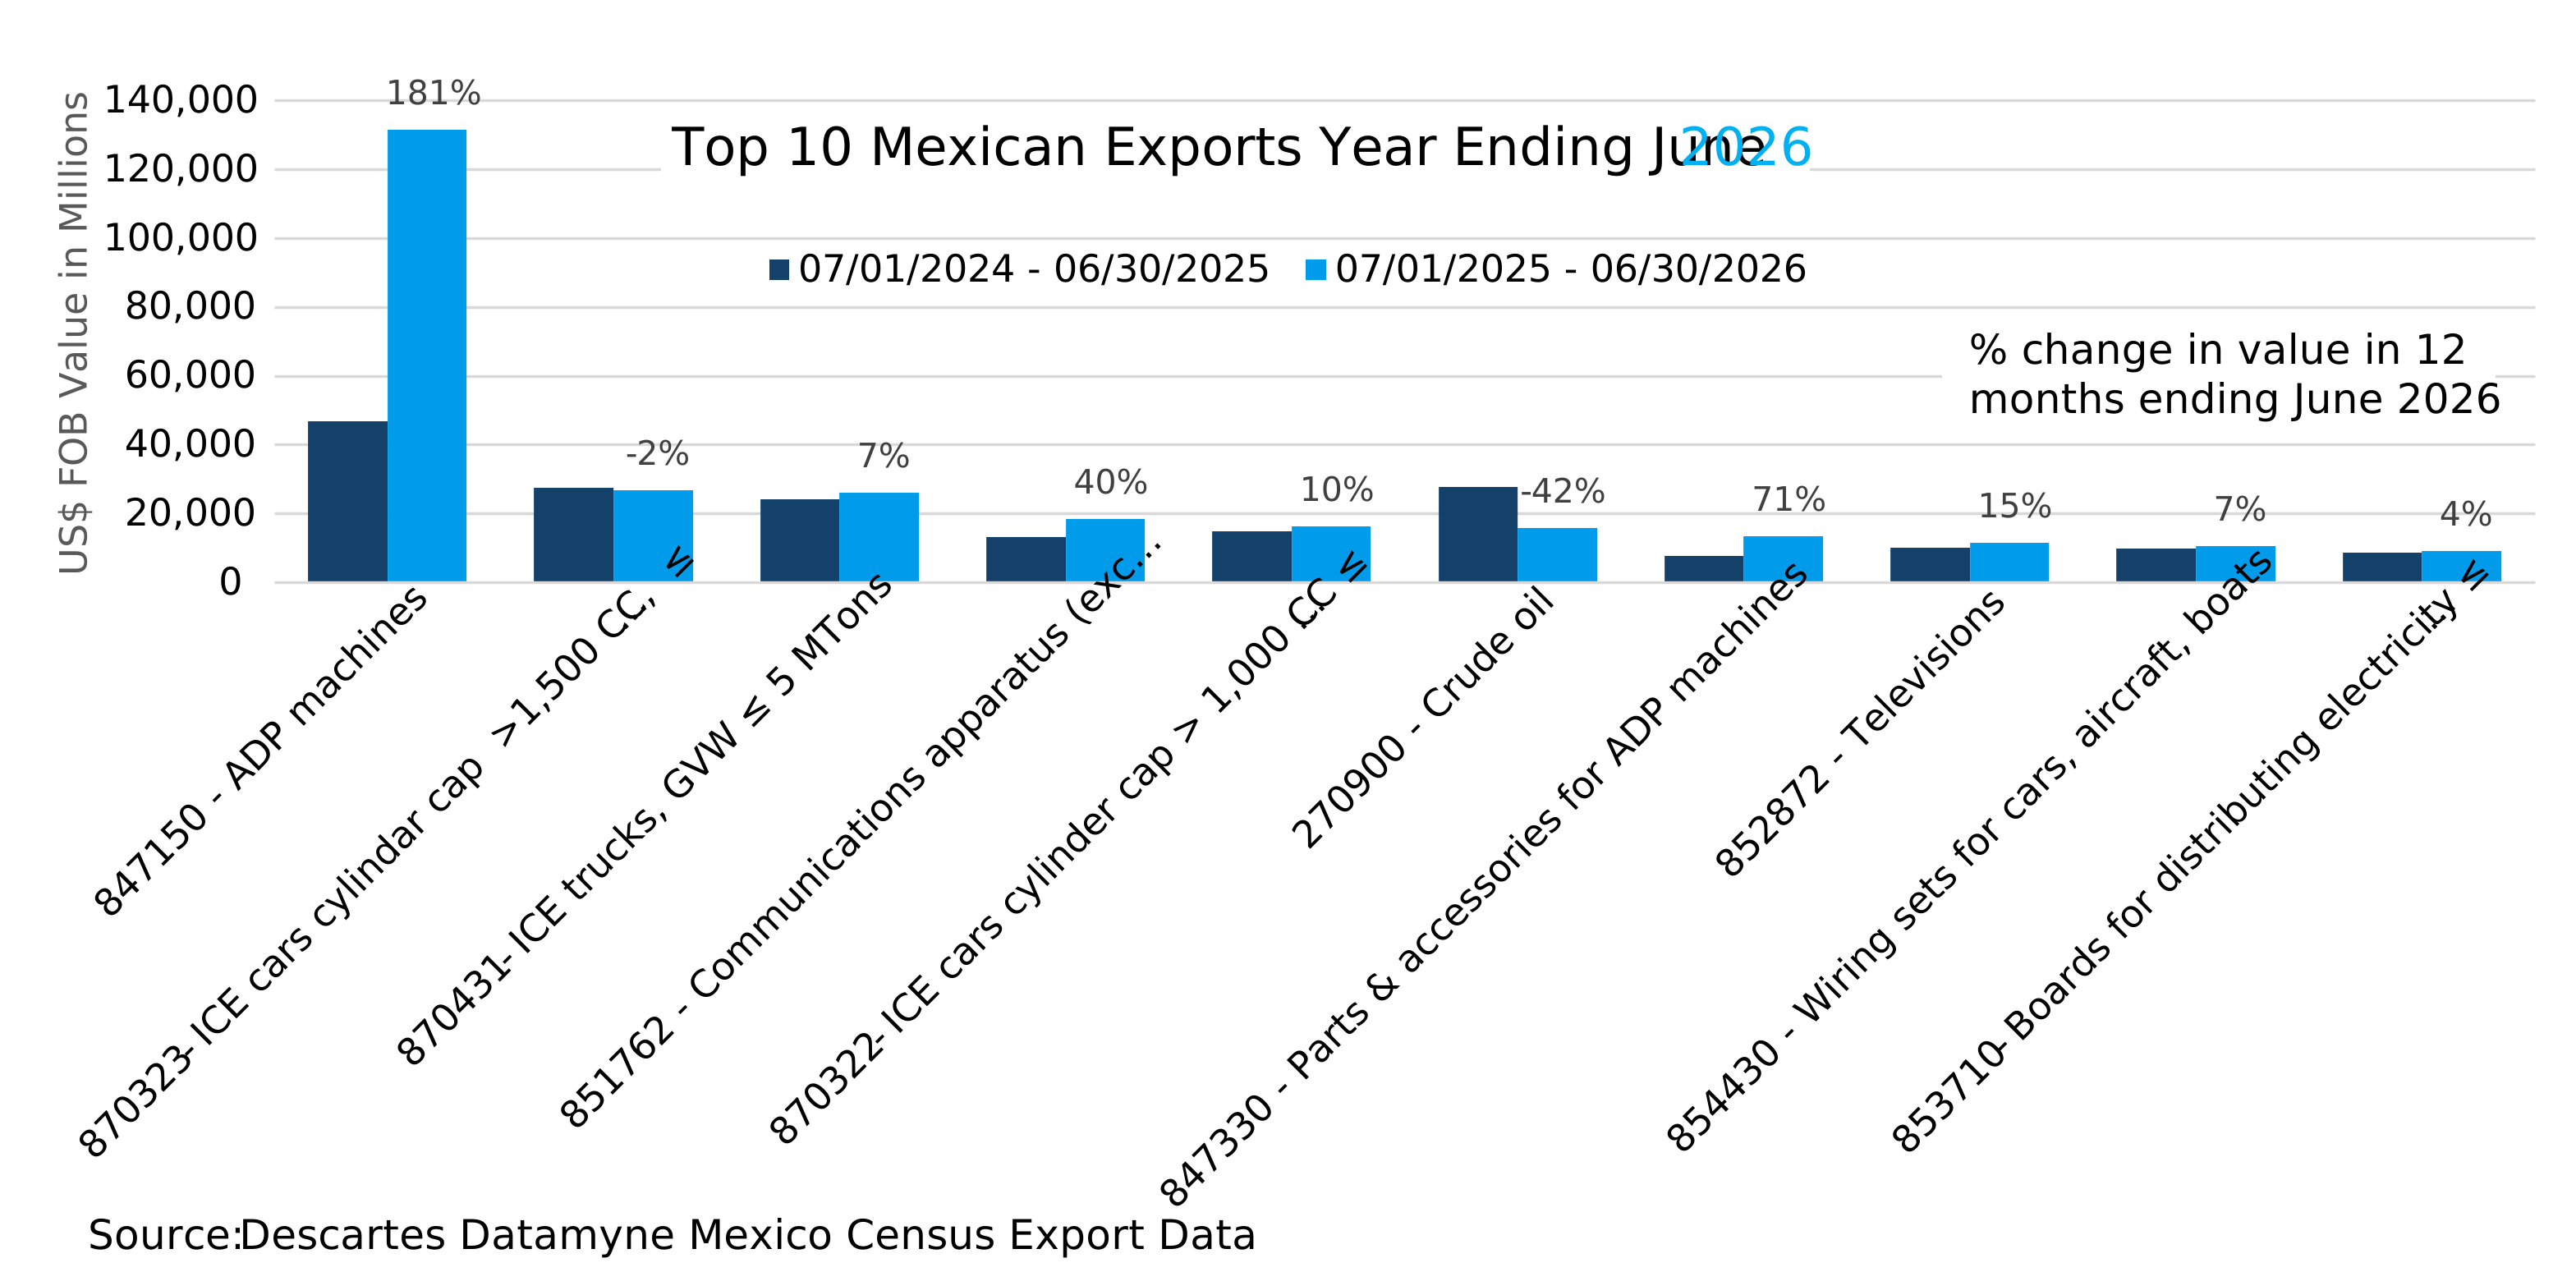
As Mexico’s leading customer, the U.S. has clearly influenced its industrial development, as the mix of outbound products shows. Note, for example, how EVs [HS870380], ranked seventh by value in 2025, fell from the top 10 (to No. 18) after a 42% decline, as U.S. market demand for the product declined with cutbacks in government subsidies.
Note that the big decline in exports of oil [HS270900] reflects a shift in Mexican government policy to rebalance its trade in petroleum, redirecting its crude to domestic refineries. The boost to domestic production of gasoline and other refinery products has helped reduce imports of light oils [HS271012] and medium oils [HS271019]. (See the charts below.)
Mexico Rides the AI Wave
The most stunning gain is the 181% surge in exports of ADP machines denoted by HS847150. Fully 94% was destined for the U.S., where demand for artificial intelligence infrastructure is booming. According to American Industrial Magazine, U.S. data center construction starts totaled $14.9 billion in 2023, climbed to $26.9 billion in 2024, then almost tripled to $77.7 billion in 2025.
President Trump’s Executive Order 14346 helped pave the way for duty-free imports of products under HS8471 (among others) by providing a means to comply with rules of origin through a “tariff shift”. (As this explainer from the International Trade Administration puts it: non-originating components must be transformed into a final product that requires a different tariff code.)
Descartes Datamyne Mexican import data confirms that the supply chain for the U.S. AI building spree runs through Mexico, as Figures 11 and 12 illustrate:
Figure 11. Mexico’s Top 10 Imports before U.S. Tariffs
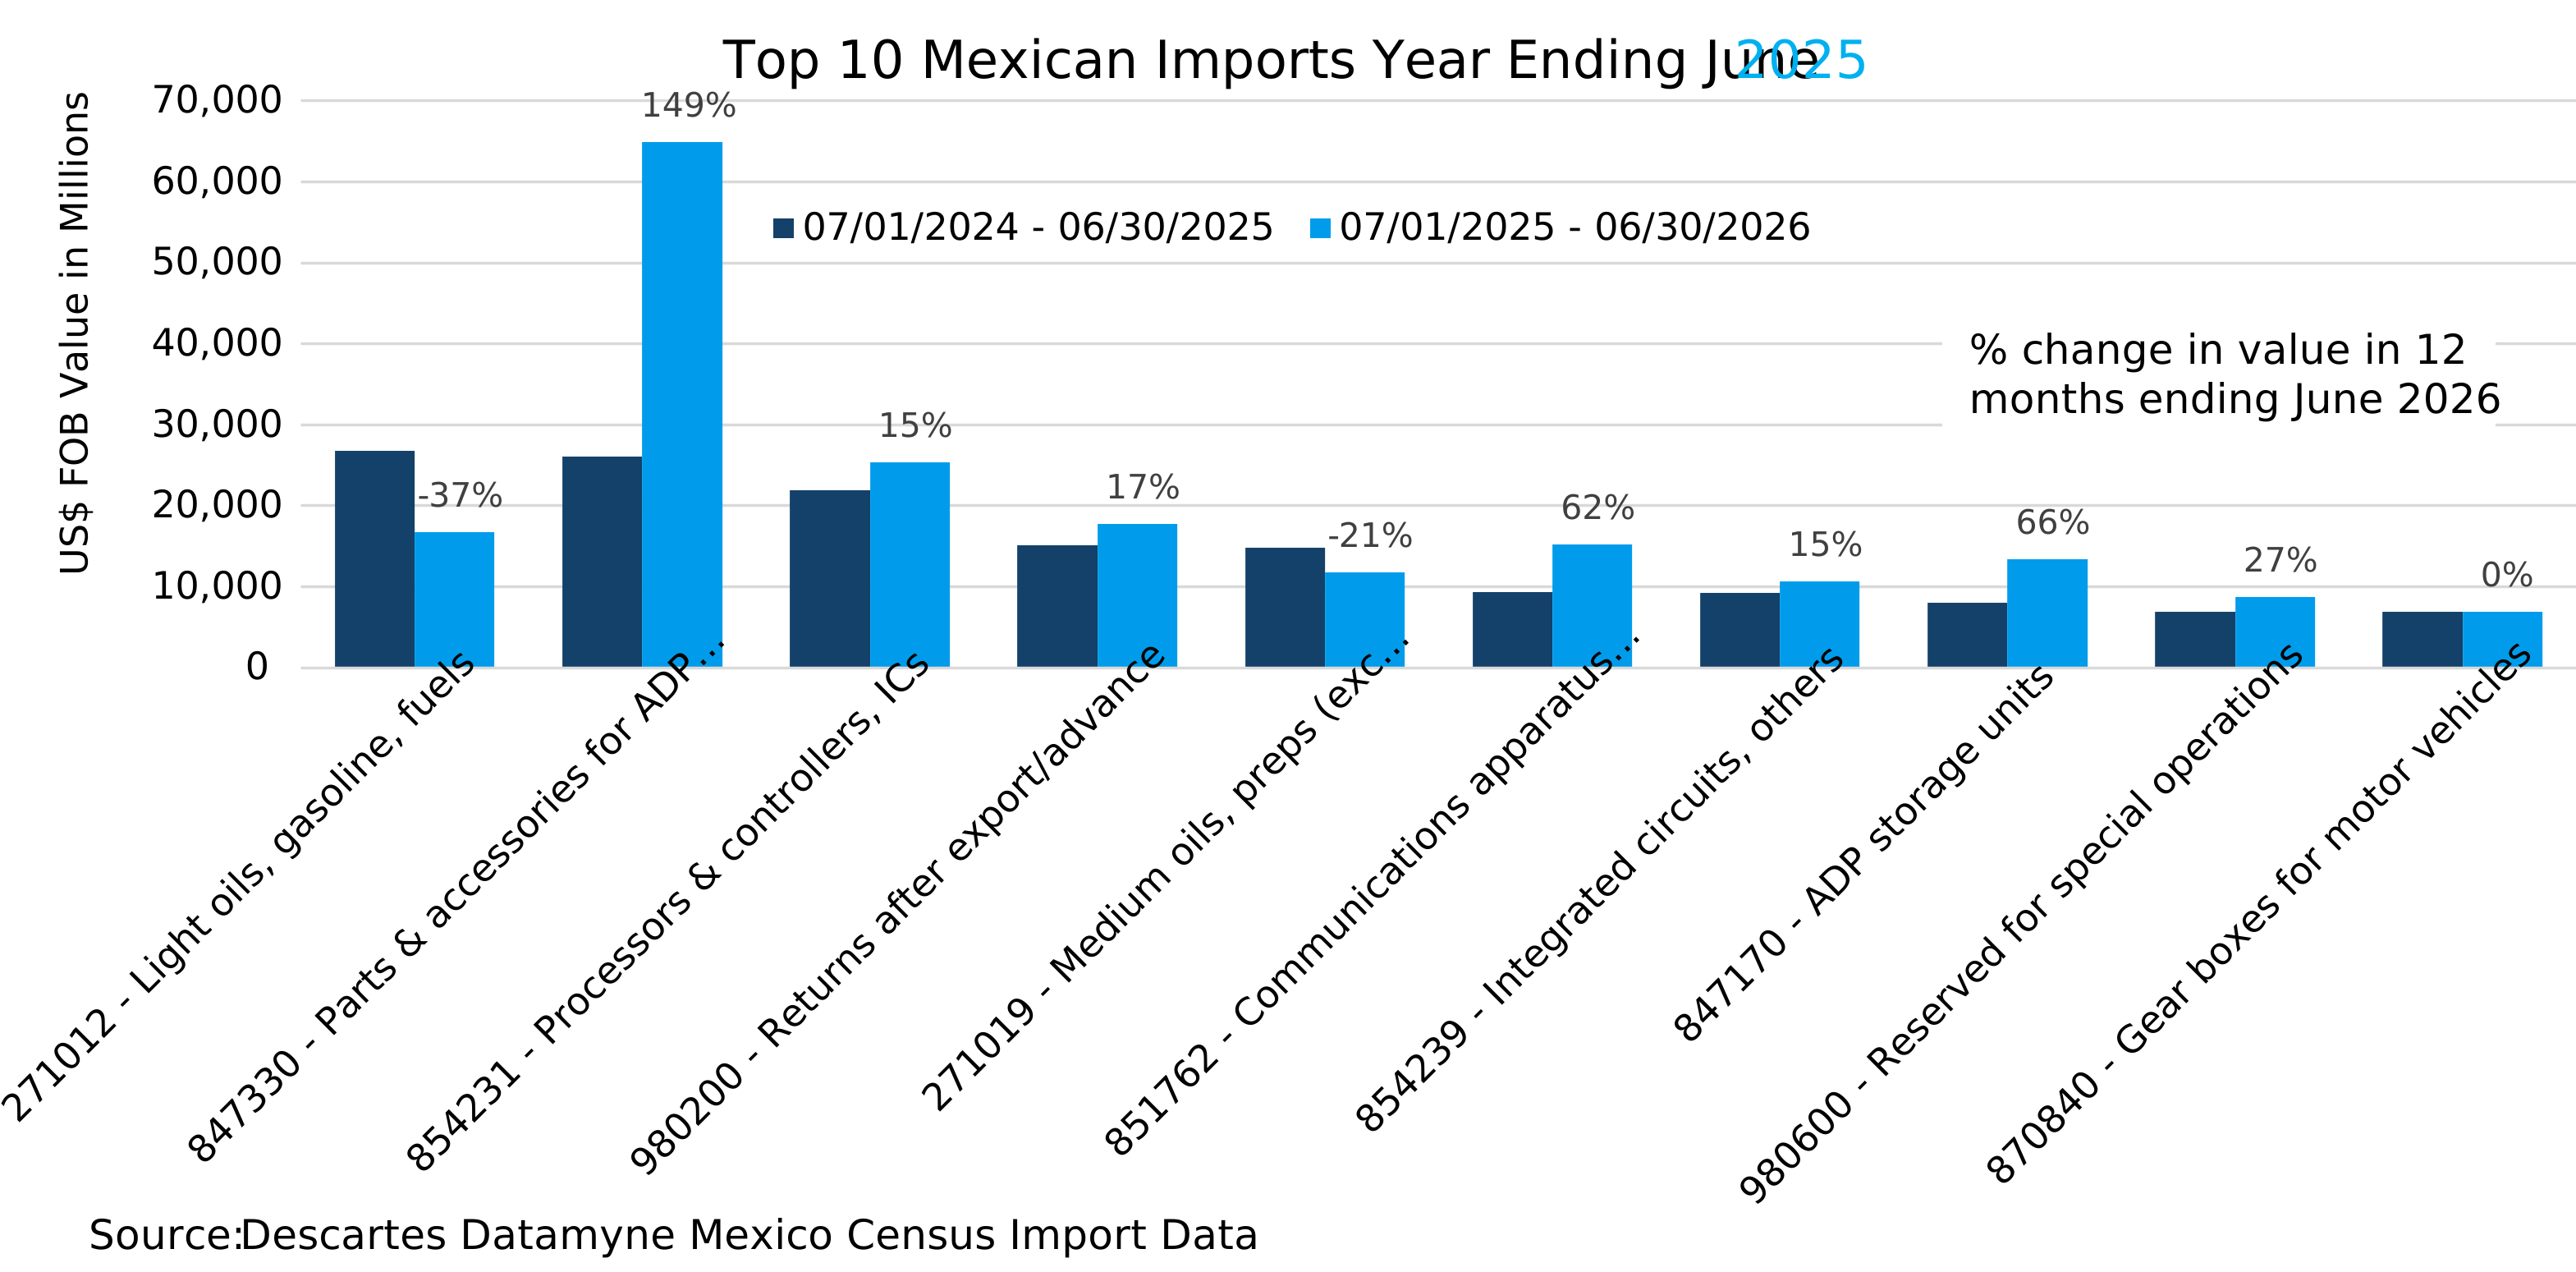
Figure 12. Mexico’s Top 10 Imports after U.S. Tariffs
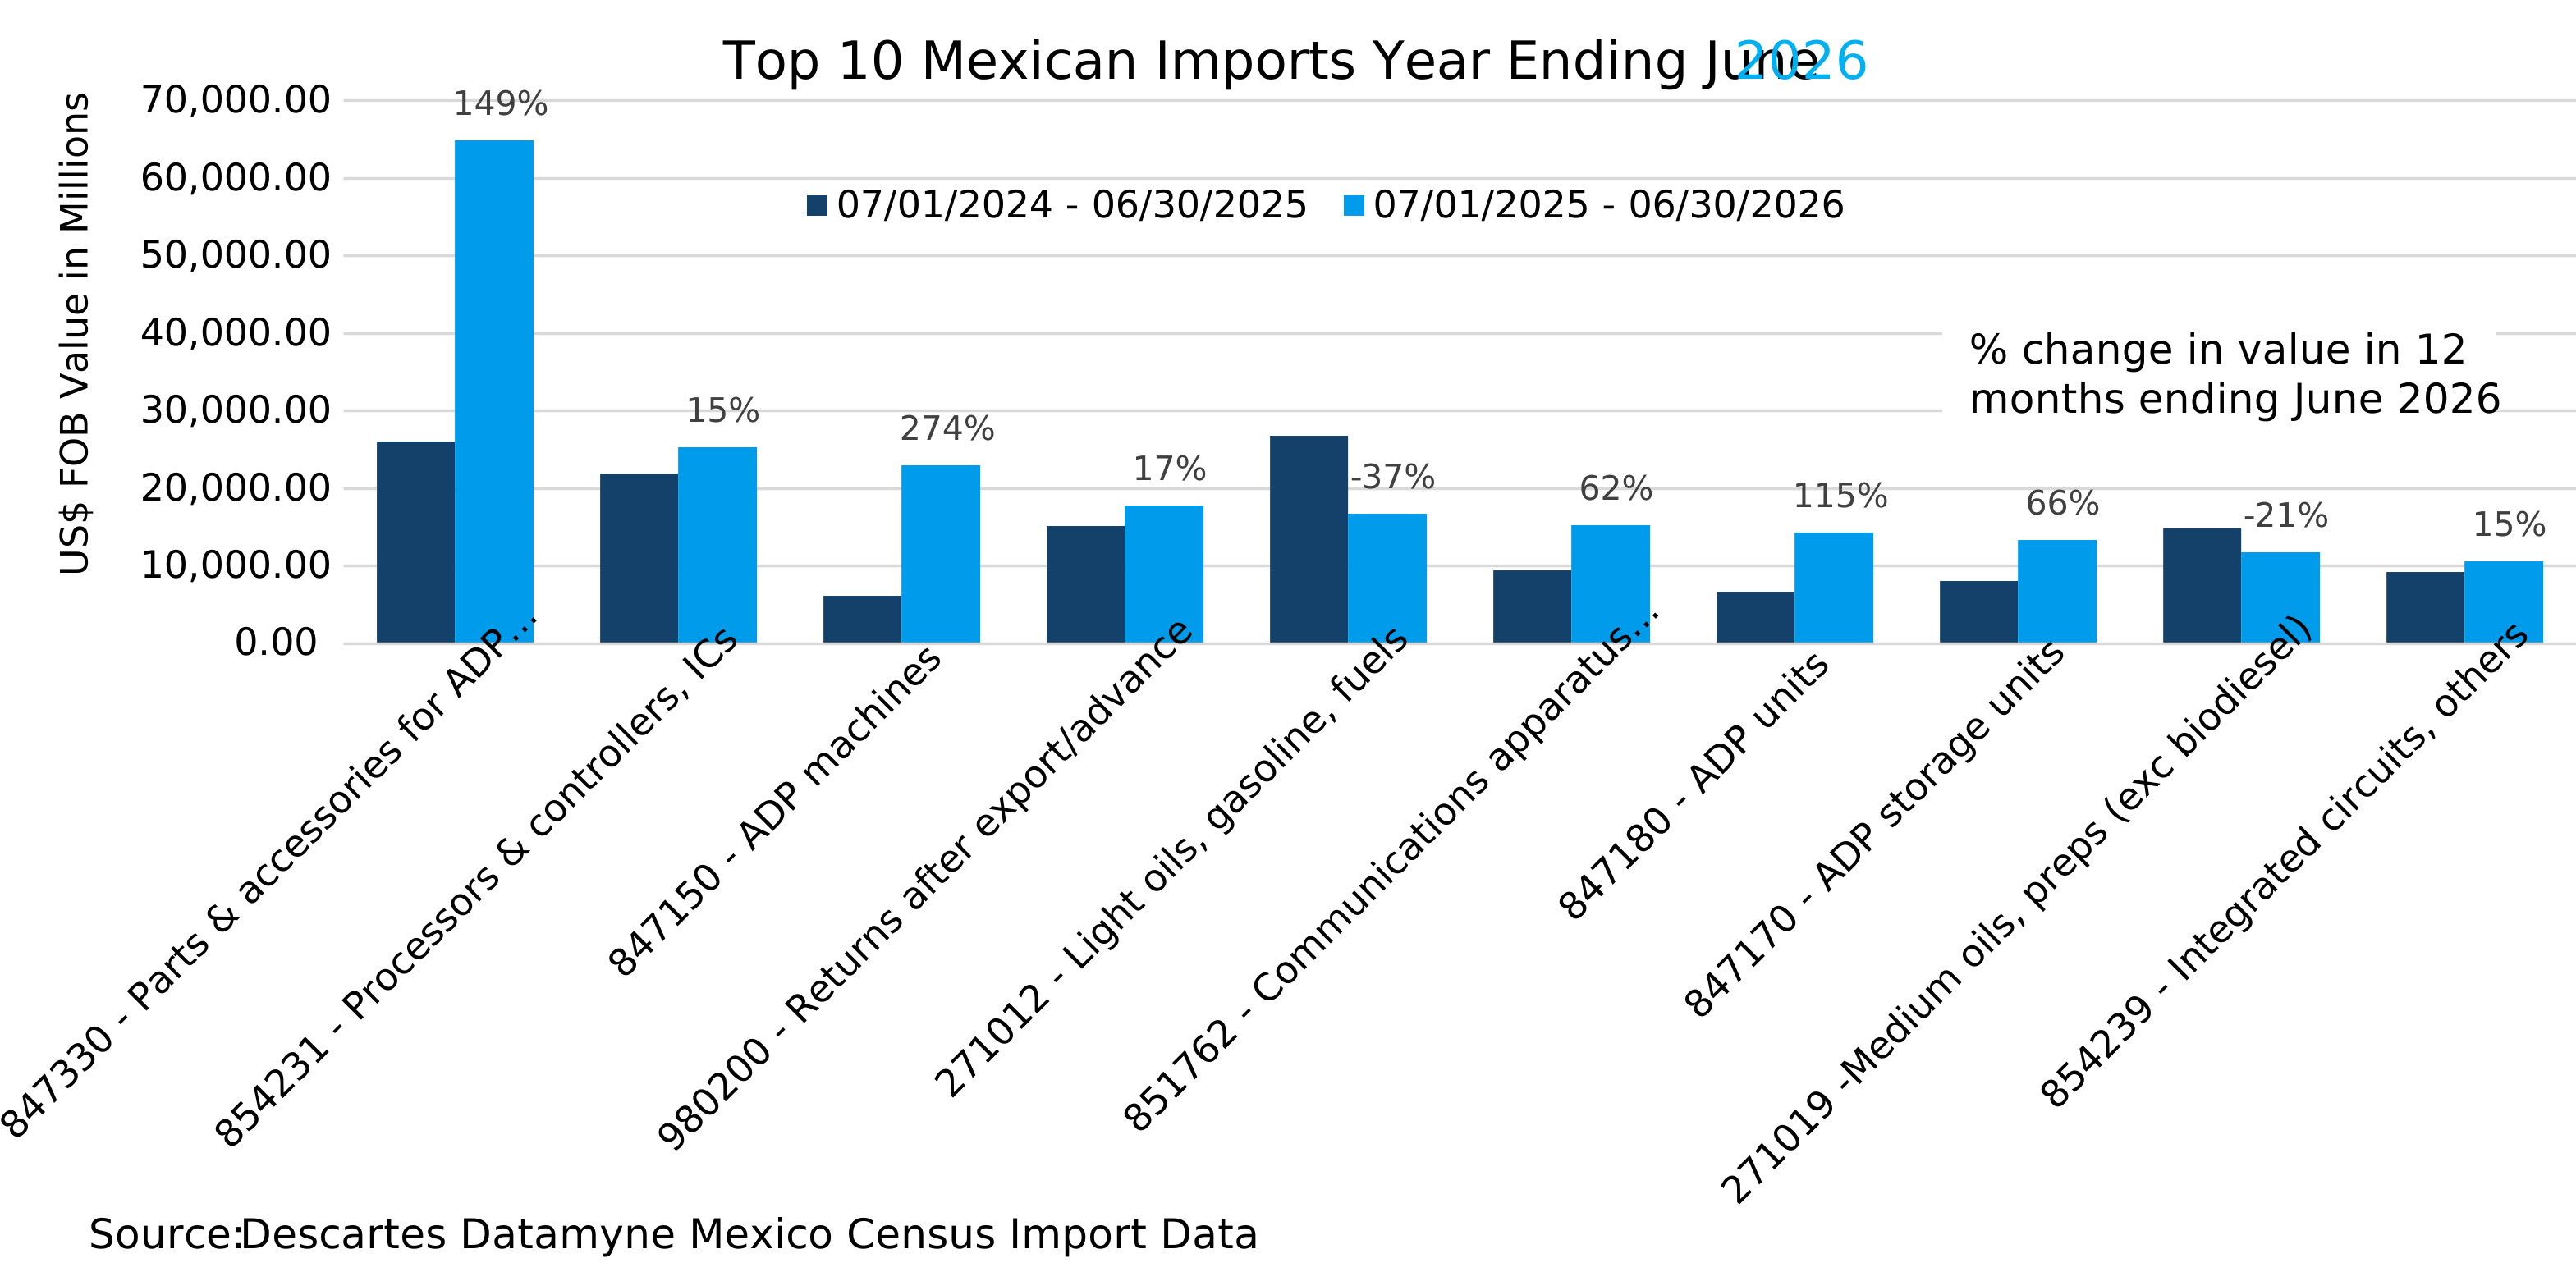
As noted, the decline in imports of light and medium oil is a result of Mexican policies aimed at rebalancing trade in petroleum: these imports are being replaced by domestic product.
Otherwise, the data indicates significant gains in inputs to digital processing products, as well as a realignment of leading countries of origin, led by a 149% growth in imports of ADP parts & accessories.
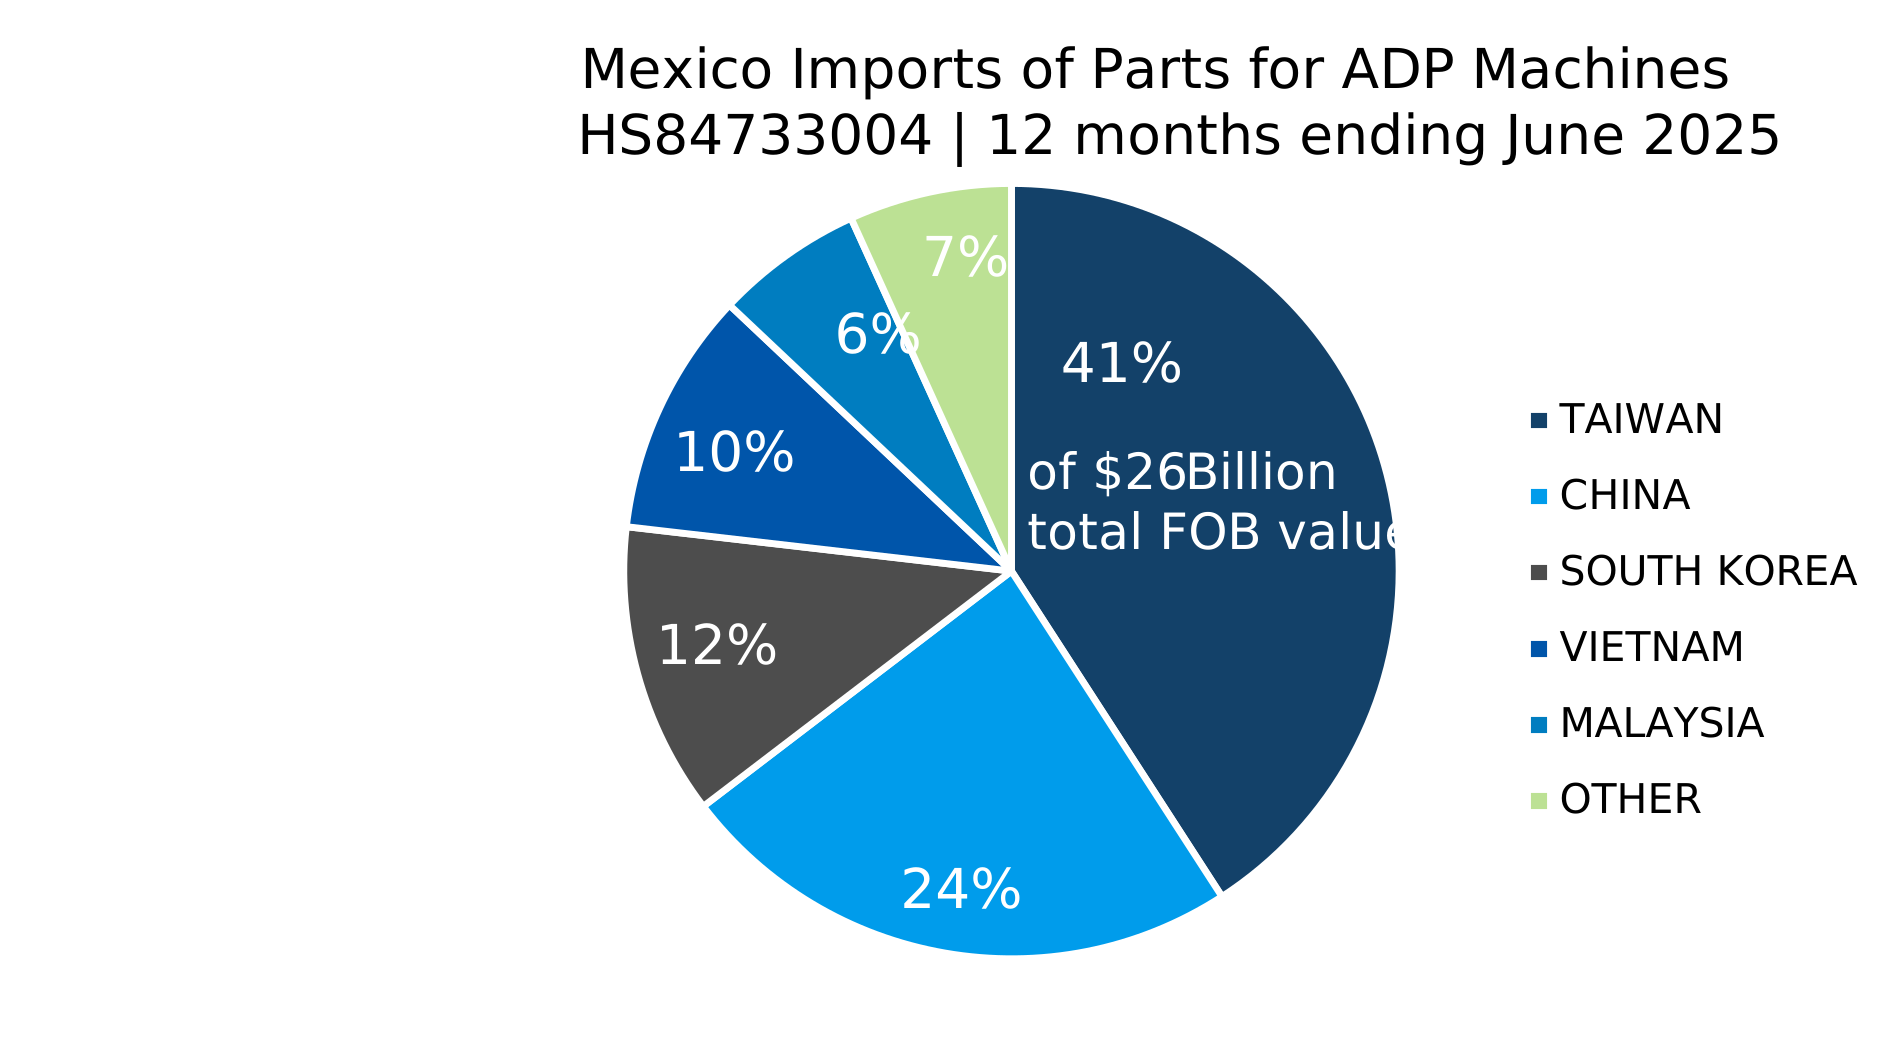
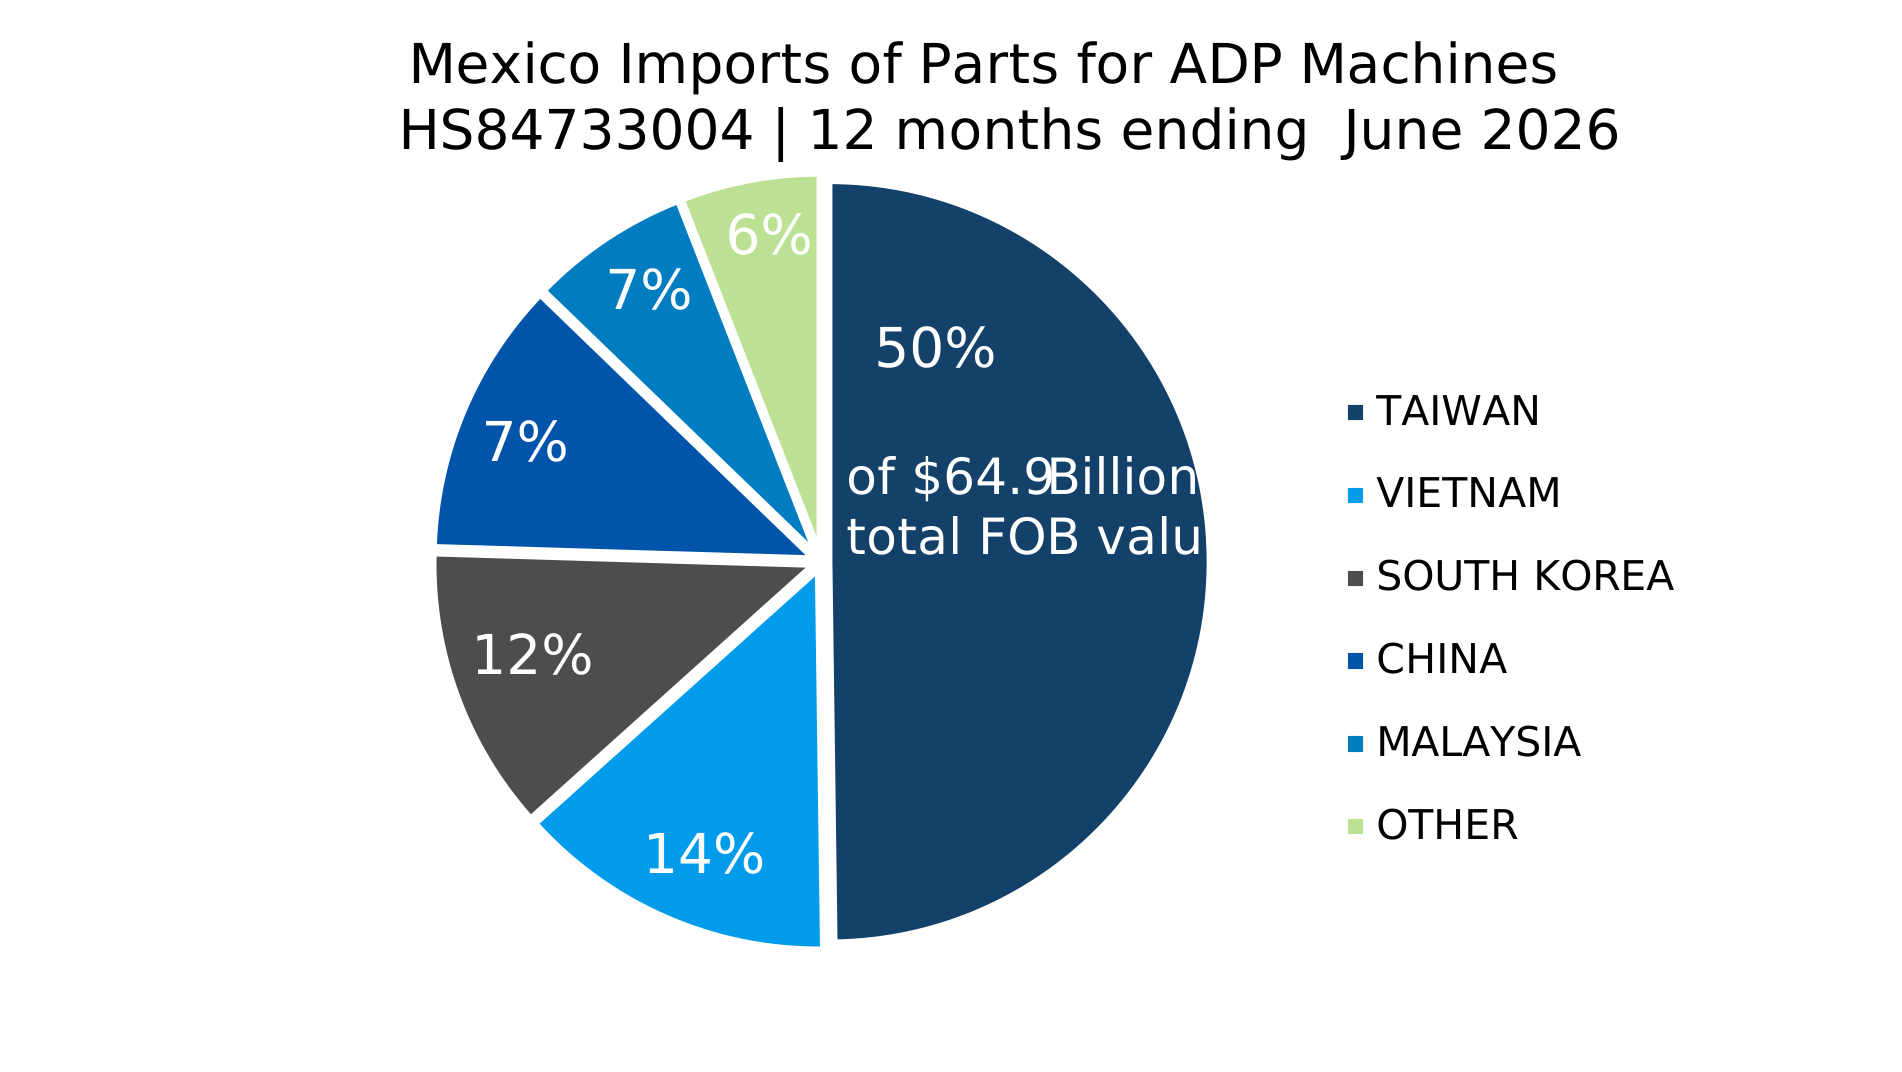
Most of these imports are sourced from Taiwan. Just a year earlier, China ranked second among countries of origin (COOs), rolling up a 24% share of this trade. In the ensuing 12 months, China’s share declined to 7%, while Taiwan claimed a full half of a much bigger pie:
Figure 13. Mexico’s Top Sources for Parts for ADP Machines before Tariffs
Source: Descartes Datamyne Mexico Census Import Data
Figure 14. Mexico’s Top Sources for Parts for ADP Machines after Tariffs
Source: Descartes Datamyne Mexico Census Import Data
A drill-down into Descartes Datamyne’s Mexican Customs Declarations data reveals that most of this trade is between related parties. The data on importers and exporters indicates the extent to which Taiwanese manufacturers have come to dominate the North American AI infrastructure supply chain. Figure 15 shows Mexico’s top five importers and exporters ranked by their share of customs value:
Figure 15. Mexico’s Top 5 Importers & Exporters Ranked by Customs Value
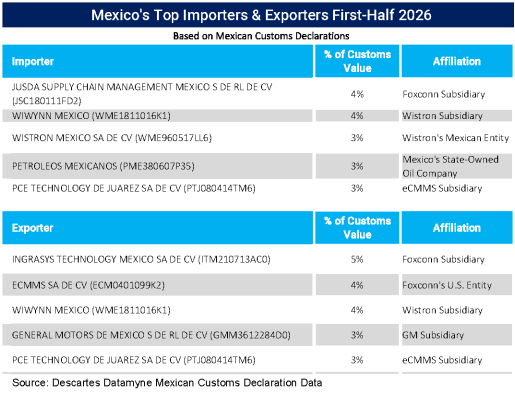
As a March report from the Federal Reserve of Dallas documents, Taiwanese investment on both sides of the U.S.-Mexico border is reshaping supply chains, with Taiwan-owned factories in Mexico providing key IT hardware to the U.S., while Taiwanese companies’ investments in the U.S. support reshoring of manufacturing.
Small Stakes… So Far
The trade dispute between the U.S. and Canada has resulted in tariffs affecting a relatively small share of total trade between the partners. As the Wall Street Journal reported at the end of August, the Canadian economy should withstand the 50% levies on an estimated $20 billion worth of exports. But the targeted tariffs will hurt small- and medium-sized businesses.
But the trade relationship has sustained intangible losses as well. The Section 338 tariffs were aimed at dairy and automotive products, long top-of-agenda issues in trade negotiations, and alcoholic beverages, which were not. Their inclusion in this round of tariffs was in retaliation for “discrimination” against U.S. beer, wine, and spirits. Canadian imports of U.S. spirits plummeted 47%, and the U.S. fell from No. 2 to No. 5 among sources in the 12-month period ending June 2026:
Figure 16. Canada’s Top Sources of Spirits Imports, 2025-2026
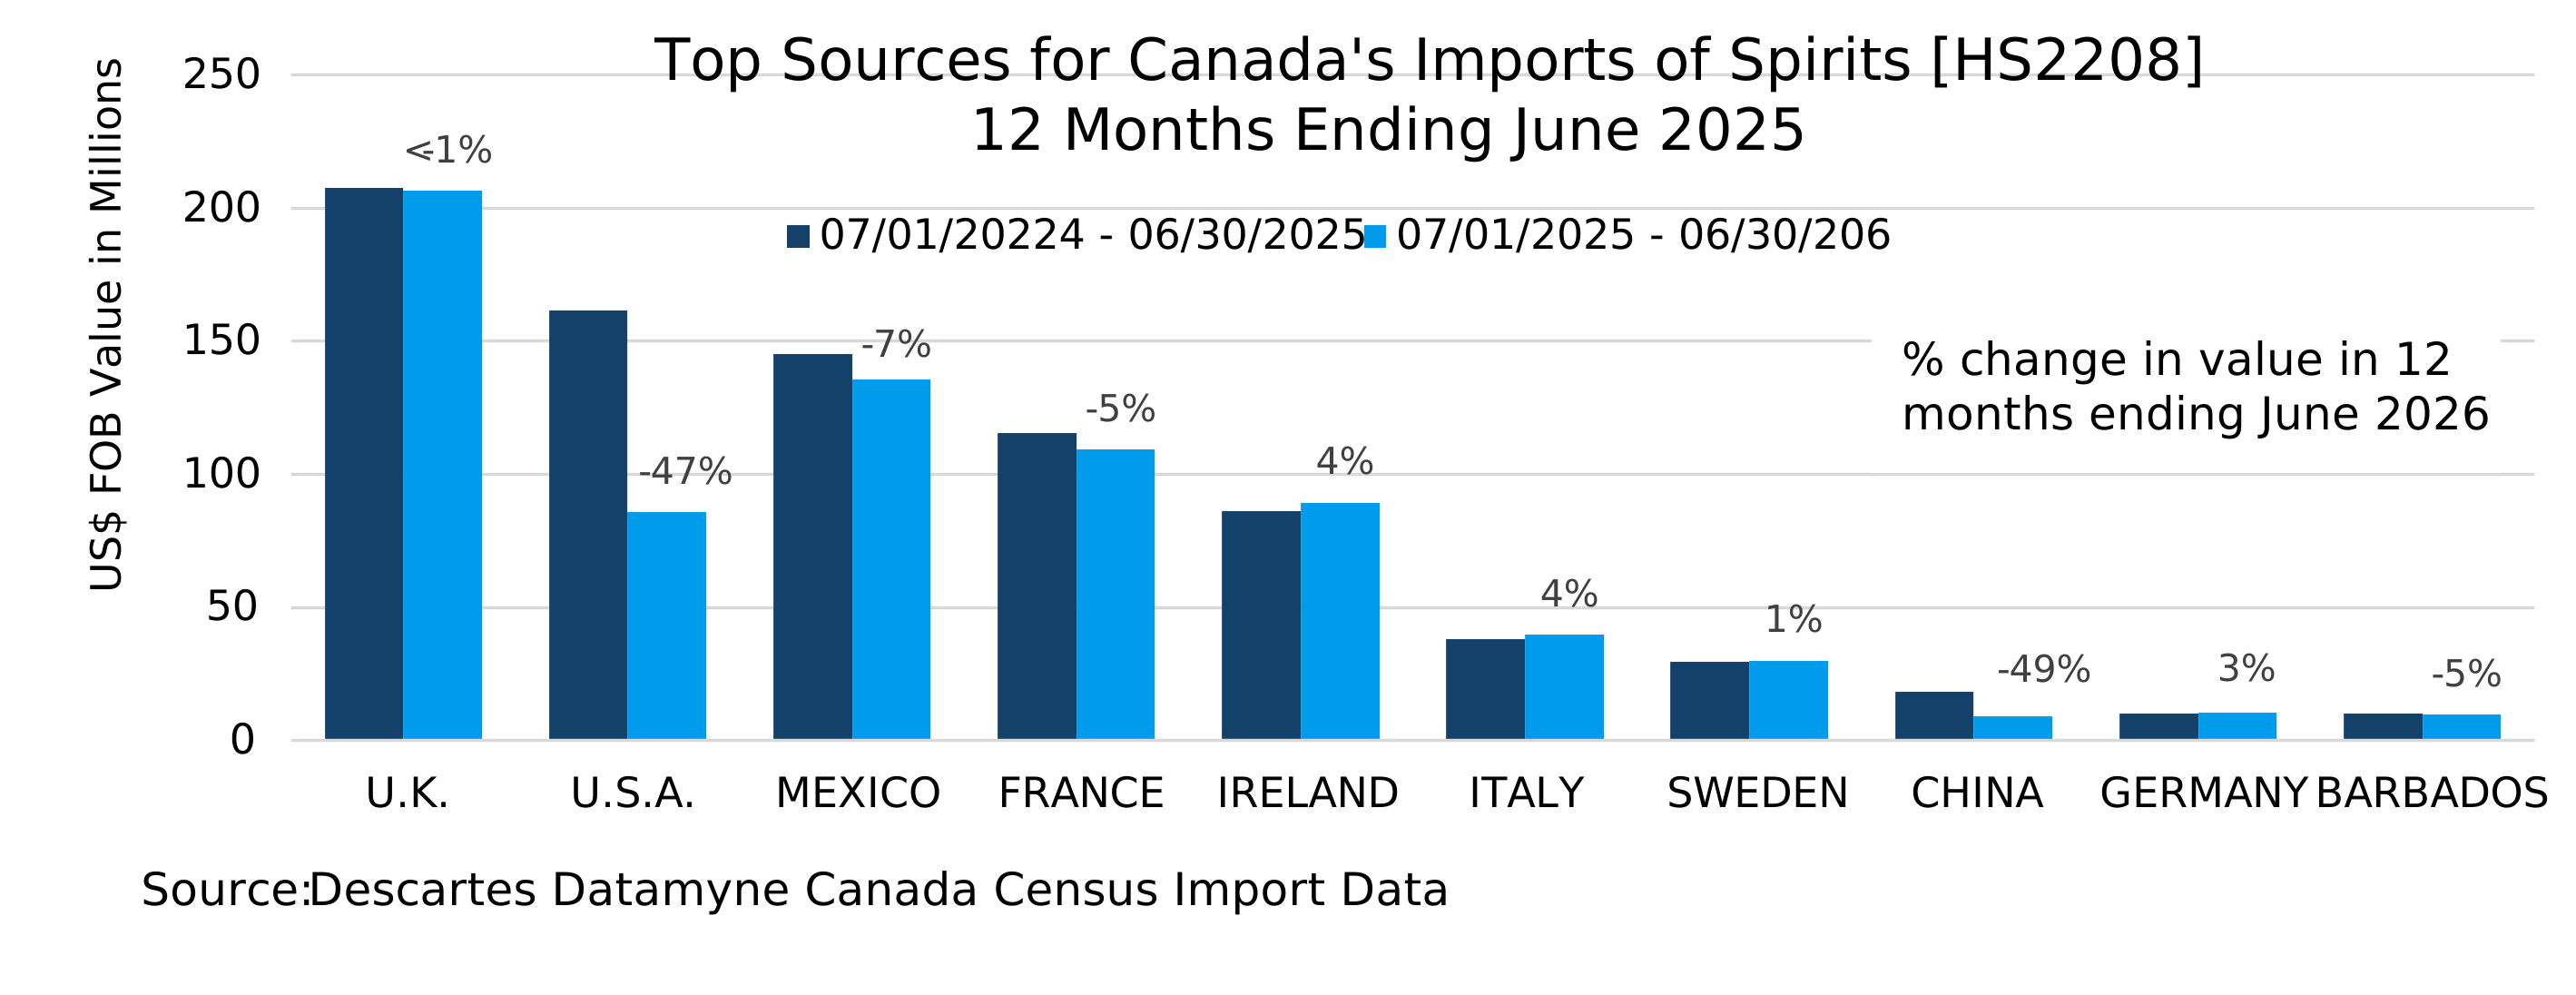
Restoring access to the Canadian market for U.S. alcoholic beverages was among the top priorities in August’s cliffhanger talks between the USMCA partners, according to the WSJ. However, the U.S. loss was not due to tariffs. Canadian premiers had ordered the U.S. products to be removed from shelves in all but two provinces. Prime Minister Carney could ask but could not insist that the premiers lift their orders. Ominously for U.S. exporters of California wines, Kentucky bourbon, and Tennessee whiskeys, they refused, with the general support of Canadian consumers.
How Descartes Datamyne can help
Changes to USMCA, expanding tariffs, and shifting sourcing patterns can create immediate questions about costs, suppliers, customers, and exposure across the automotive supply chain and other integrated industries. Descartes Datamyne helps trade professionals analyze international trade flows across 190+ countries, compare Canada trade and Mexico trade, and identify how North American trade relationships are changing.
The Descartes Datamyne AI Agent makes this analysis more conversational. Users can ask questions in natural language to identify suppliers, examine company and shipment activity, and summarize emerging trade patterns without building complex searches.
Tariff Insights helps teams assess duties by product and HS code, understand potential tariff exposure, and evaluate sourcing alternatives. Together, Descartes Datamyne, its AI Agent, and Tariff Insights support faster, data-driven decisions as USMCA rules, tariffs, and supply chains evolve.