


In October 2023, U.S. imports witnessed a substantial surge, diverging from pre-pandemic trends and reaching levels beyond those of October 2019. The following trade data insights offer an overview of key developments:
U.S. Container Import Growth
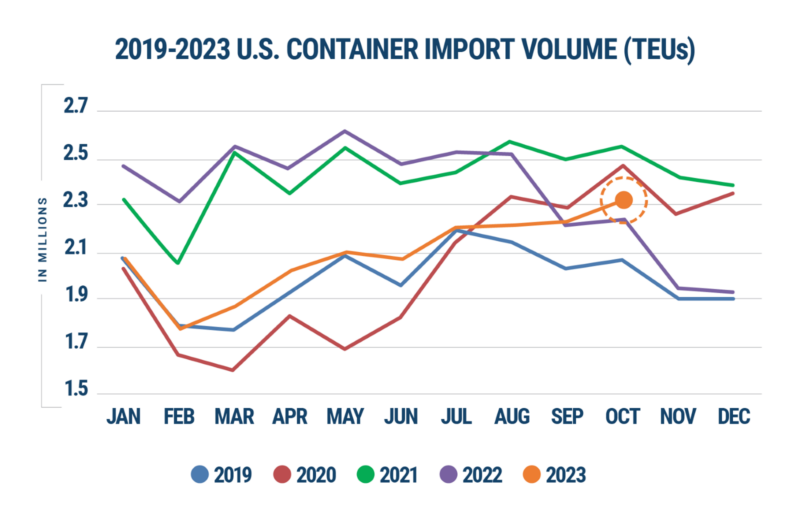
- Import volumes grew by 4.7% in October 2023, reaching 2,307,918 TEUs (Figure 1).
- Cumulative U.S. import volume for the first ten months of 2023 remained within 3.4% of the corresponding period in 2019.
Figure 1: U.S. Container Import Volume Year-over-Year Comparison
Source: Descartes Datamyne™
October Import Volume Trends
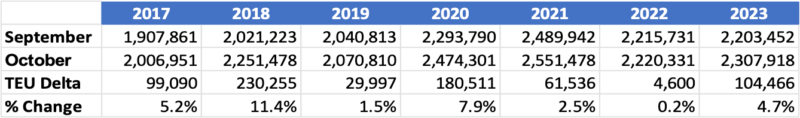
- Over the past six years, import volume consistently increased from September to October due to the latter being one day longer and having no major holidays.
- This trend persisted in October 2023, with a substantial increase in import volume over September (see Figure 2).
Figure 2: September to October U.S. Container Import Volume Comparison
Source: Descartes Datamyne™
Port Performance
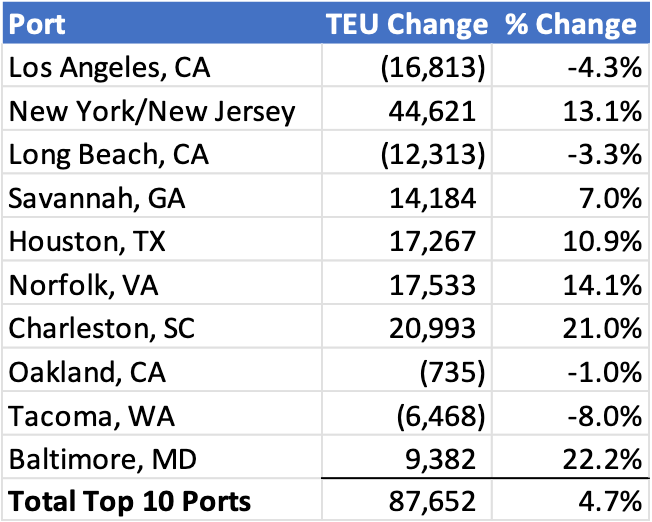
- The top 10 U.S. ports experienced an 87,652 TEU increase in aggregate container import volume in October 2023 (Figure 3).
- Notably, the Port of New York/New Jersey led with a significant volume increase, while the Ports of Los Angeles and Long Beach recorded declines.
Figure 3: September to October Comparison of Import Volumes at Top 10 U.S. Ports
Source: Descartes Datamyne™
Chinese Imports
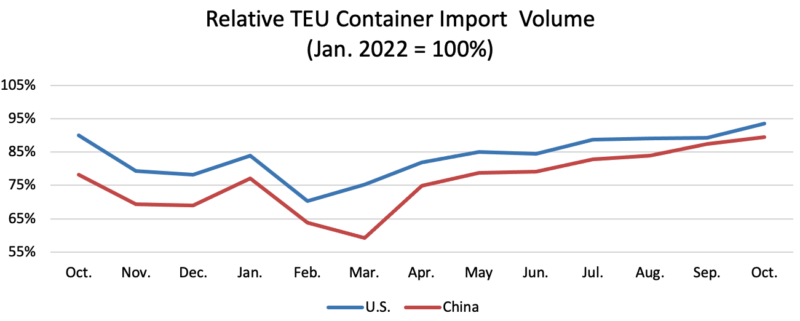
- Increased by 2.3% in October 2023 compared to September, reaching 886,842 TEUs (Figure 4).
- Remained 11.6% below the peak in August 2022.
Figure 4: October 2022-October 2023 Comparison of U.S. Total and Chinese TEU Container Volume
Source: Descartes Datamyne™
Top Countries of Origin
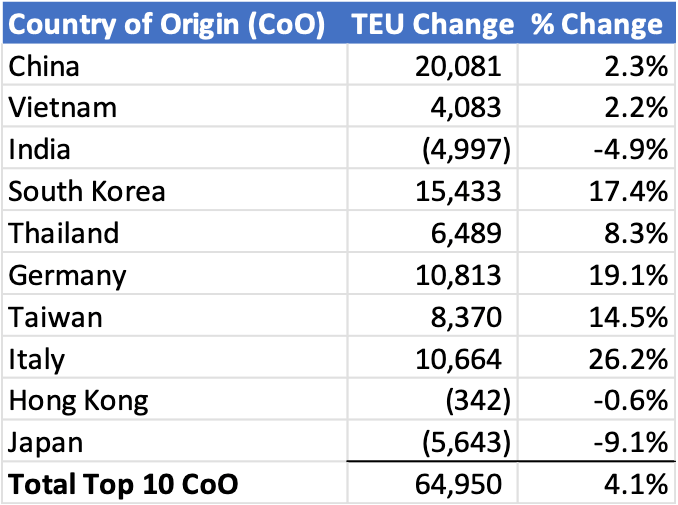
- For the top 10 countries of origin (CoO), U.S. container import volume in October 2023 increased by 4.1% (64,950 TEUs) from the previous month.
- Chinese imports led with the greatest volume increase (20,081 TEUs), while Japan experienced the most substantial volume decrease (-5,643 TEUs) (see Figure 5).
Figure 5: September to October Comparison of U.S. Import Volumes from Top 10 Countries of Origin
Source: Descartes Datamyne™
Port Market Share
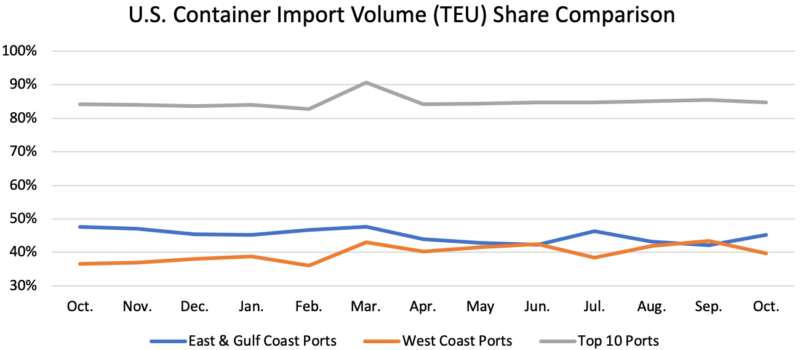
- Volume shares of top East and Gulf Coast ports increased, primarily driven by a significant volume surge at the Port of New York/New Jersey and growth at other leading East Coast ports.
- Comparing the top five East and Gulf Coast ports to the top five West Coast ports in October 2023 versus September 2023 reveals that, of the total import container volume, top East and Gulf Coast ports increased to 45.1% (up 3.0%), while top West Coast ports decreased to 39.6% (down 3.7%).
- Compared to smaller ports, the top 10 ports share in October 2023 slightly decreased to 84.8%, down 0.6% versus September 2023 (see Figure 6).
Figure 6: Volume Analysis for Top Ports, West Coast Ports and East and Gulf Coast Ports
Source: Descartes Datamyne™
Port Transit Delays
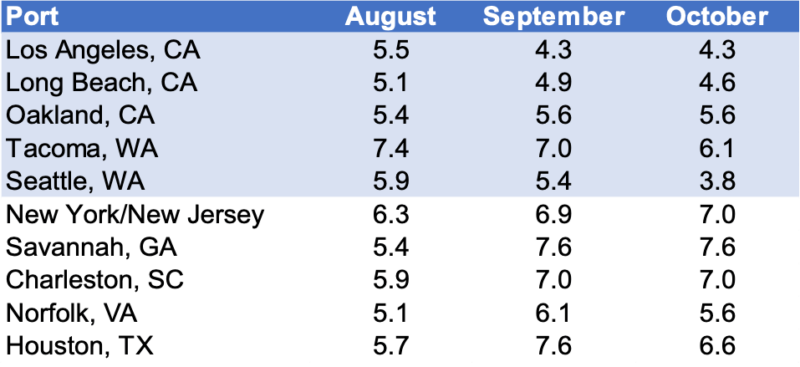
- In October 2023, overall port transit delays receded, with most top West Coast ports experiencing reduced transit times versus September (see Figure 7).
- The top East and Gulf Coast ports stabilized, with Norfolk and Houston experiencing transit delay decreases. The Port of Seattle saw the most significant reduction (1.6 days), while the Port of New York/New Jersey had only a slight increase (0.1 days) compared to September.
Figure 7: Monthly Average Transit Delays (in days) for the Top 10 Ports
Source: Descartes Datamyne™
Note: Descartes’ definition of port transit delay is the difference as measured in days between the Estimated Arrival Date, which is initially declared on the bill of lading, and the date when Descartes receives the CBP-processed bill of lading.
Panama Canal Impact
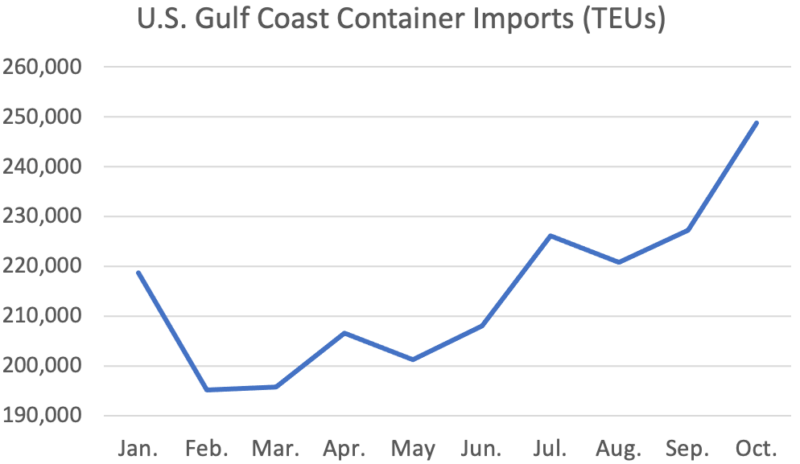
- Despite the ongoing drought in Panama affecting ship passages, there is no apparent impact on U.S. container import volumes (see Figure 8).
- Gulf Coast ports experienced the highest container import volume in October 2023, with transit times decreasing for the Ports of Houston (-1.1 days), Mobile (-1.0 days), Tampa (-2.0 days), and New Orleans (-1.1 days).
Figure 8: U.S. Gulf Coast Container Imports for 2023
Source: Descartes Datamyne™
Strategic Recommendations to help overcome global shipping challenges.
Short-term:
- Monitor the growth of COVID variants, especially in critical supply chain regions, as they continue to disrupt the global supply chain.
- Keep a close eye on ocean shipments and carrier performance as ETAs continue to be inconsistent.
- Stay informed about the Panama Canal situation as it has a continued impact on shipping capacity and may cause the rerouting of supply chains.
- Assess the effects of inflation and geopolitical conflicts on logistics costs, and ensure your trading partners are not sanctioned.
- Prioritize retention of existing supply chain resources, paying special attention to the well being of your drivers
‘. Above wage increases, ensure you are reducing their stress and improving their quality of life.
Near-term:
- Reassess trade redirected away from West Coast ports, particularly for companies importing from Asia.
Long-term:
- Evaluate supplier and factory location density to reduce reliance on overburdened trade lanes and conflict-prone regions.
As Descartes continues to provide insights through data analysis, these key developments and recommendations offer a strategic guide for navigating current and future global shipping challenges.