


Starting in March of 2018, the Trump Administration has deployed tariffs and import quotas on select steel and aluminum products under Section 232 of the Trade Expansion Act of 1962, which authorizes these measures to control imports in the cause of national security. The aim has been to protect vital domestic industry as global over-capacity spurred foreign competitors and depressed prices.
Announced March 8, 2018, the ad valorem tariffs – 10% on aluminum and 25% on steel – were to be imposed on March 23 and applied to imports from all trading partners, with the initial exceptions of Canada and Mexico.
On the eve of implementation, temporary exemptions were extended to Australia, South America, and select EU members. The U.S. subsequently reached agreement with Australia on a permanent exemption. Agreements with Argentina, Brazil and South Korea substituted import quotas for tariffs. Failing to reach similar agreements with Canada, Mexico and the EU, imports from those sources became subject to the tariffs June 1, 2018.
Our trade data through second-quarter 2019 indicates the effectiveness of the Section 232 constraints on the flow of imports, as the following graph on quarterly value of trade in aluminum shows.
Keep in mind in viewing the graph that the 10% duty on aluminum applies to the products denoted by seven 4-digit Harmonized System (HS) codes and two 10-digit HS codes. These products accounted for 76.8% of all U.S. aluminum (HS76) imports in 2017.
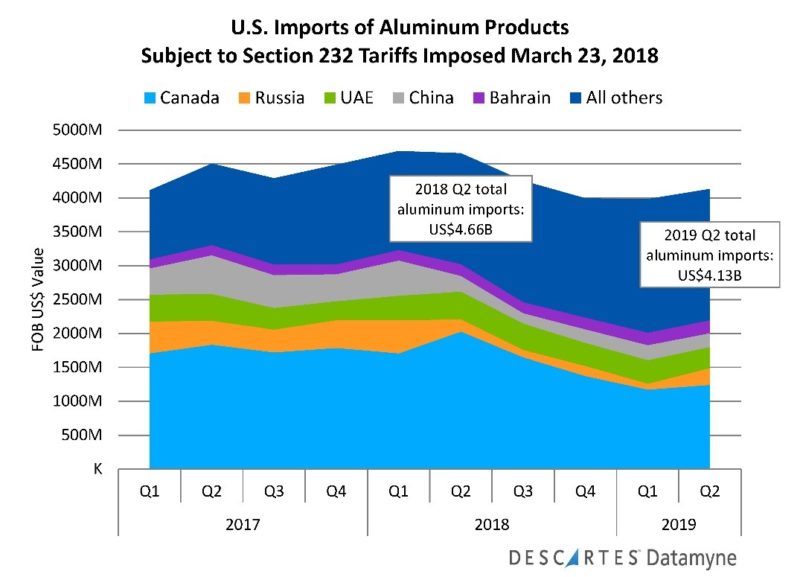
In second-quarter 2018 immediately following on the aluminum tariffs, imports slipped 0.7%. One year later, second-quarter 2019 imports had fallen 12% compared with pre-tariff 1Q18. After four successive quarters of decline, imports in 2Q19 gained 3.8% over 1Q19. One possible explanation for the increase: the U.S. announced the end of tariffs on North American trading partners Canada and Mexico in May. A closer look at the data finds that Canadian aluminum imports did rise a modest 6% in 2Q19 compared with 1Q19. But a 182% jump in Russian imports (the orange band in the graph above) accounts for most of the quarter’s growth.
The next graph tracks quarterly imports of steel before and after the tariffs. Again, note that the Section 232 duty on steel of 25% extends to products covered by 23 4-digit HS codes and 13 6-digit codes. Taken together, these codes accounted for 42.3% of all iron and steel (HS72 and HS73) imports in 2017.
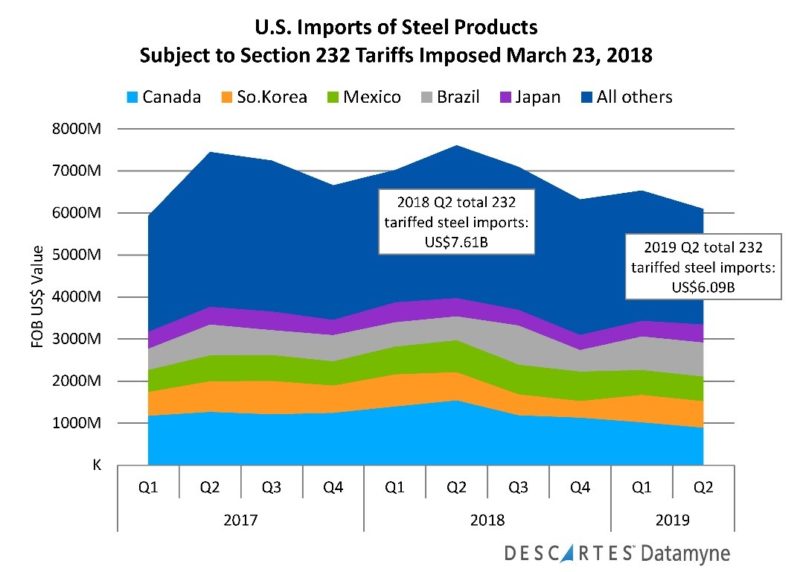
In the second quarter 2018 aftermath of the steel tariffs, imports actually surged 8.4% over preceding 1Q18. One year later, 2Q19 imports are down 13.2% compared with pre-tariff 1Q18 – and 19.9% off the 2Q18 peak.
In contrast, 1Q19 saw an uptick of 3.4% in tariffed steel imports over preceding 4Q18, with South Korean imports (orange band in the above graph) leading gains with a 64.9% increase, followed by Brazilian steel (gray band), up 56.6%. Both countries are covered by absolute quotas on Section 232 steel products.
Section 232 Tariffs on Steel and Aluminum: Impact on Trade Partners
Inevitably, the Section 232 tariffs on steel and aluminum have changed trade patterns, curbing imports from some U.S. trade partners, while creating new opportunities for others.
Here’s a comparison of the shifting share of U.S. imports of tariffed aluminum products across quarters before, immediately after tariffs and one year later:
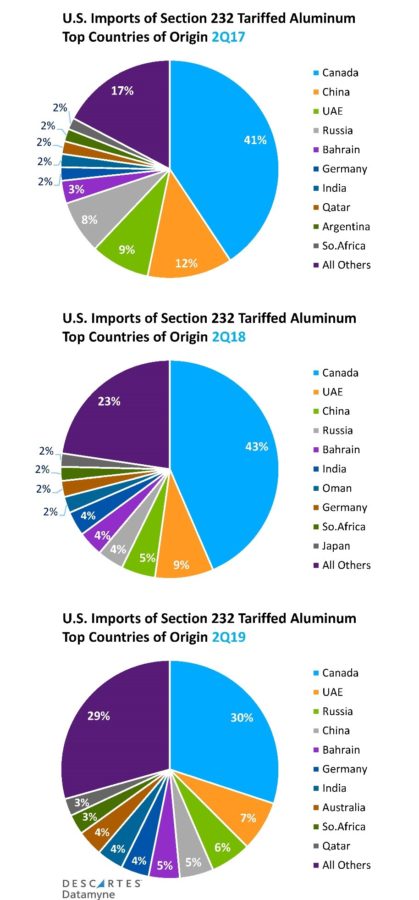
Most notably, top country of origin Canada has seen its share of aluminum imports shrink significantly, from 41% in 2Q17 to 30% in 2Q19. China, once second ranked among COOs for aluminum, has slipped to fourth place, its share falling from 12% to 5% of a smaller pie. Meanwhile, Australia moved up from 12th place in 2Q17 to 8th in 2Q19, on a share increase from 1.5% to 3.8%.
Here, over the same three time periods, is how the top source countries for steel traded shares of U.S. imports:
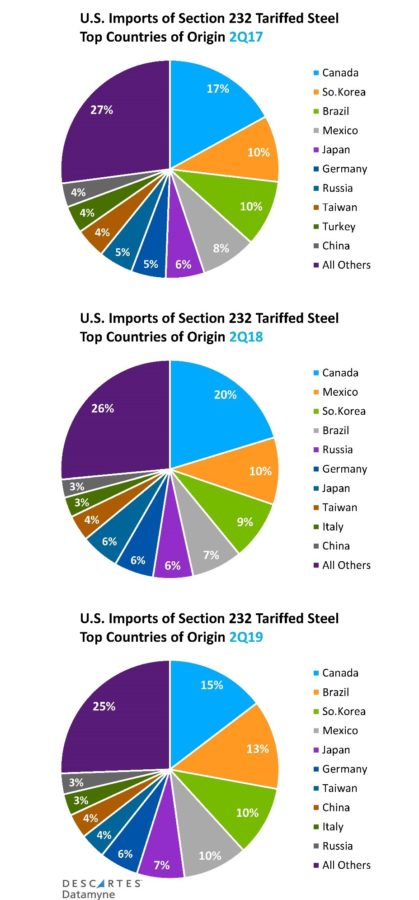
Top U.S. source for 232 tariffed steel products, Canada has ceded share, now 15% compared with 17% in 2Q17, and 20% in 2Q18 (recall that the tariff did not go into effect on Canadian imports until June 1 of that year). The beneficiaries appear to have been South Korea and Brazil, both exporting steel under absolute quotas in lieu of tariffs. Brazil has gained three percentage points in share and risen to second rank.
Note that Turkey, ranked ninth in 2Q17 has disappeared entirely from the top countries of origin. Turkey’s steel products, already subject to the Section 232 duty, were hit with an added 25% charge – boosting the total tariff to 50% – in August 2018 during a separate trade spat. In May, along with lifting the tariff from Canadian and Mexican imports, the U.S. reset the tariff on Turkish steel to 25%.
Section 232 Tariffs on Steel and Aluminum: Reverberations
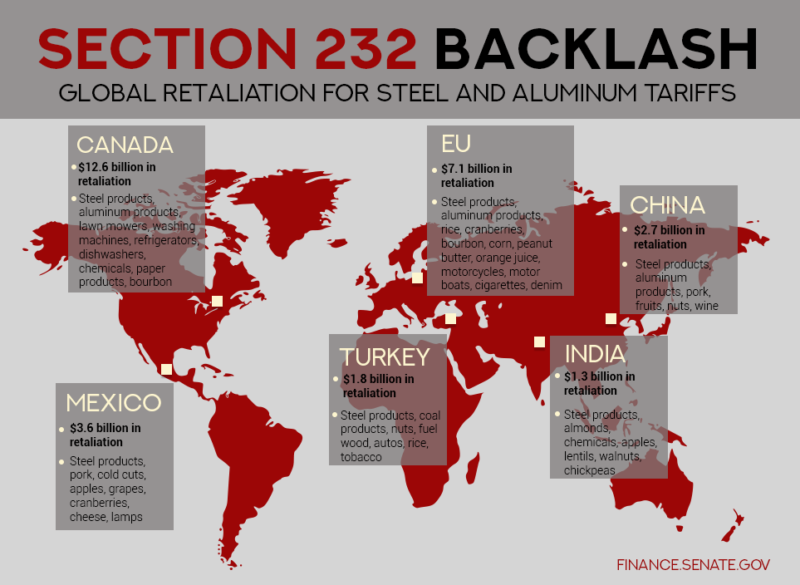
Beyond the U.S. concerns that triggered the Section 232 tariffs and quotas, the targeted aluminum and steel products are the focus of trade disputes around the world.
The UN Conference on Trade and Development (UNCTAD), in its report World Trade Profiles, provides a ranking of the “top 20” HS headings most frequently affected by anti-dumping measures. Of the 20 HS codes listed, 14 are Section 232 tariffed products. Top of the list is HS 7208, flat-rolled products of iron or non-alloy steel, subject to 117 anti-dumping measures, followed by HS 7225, flat-rolled products of alloy steel other than stainless, with 115 such measures in effect as of year-end 2017.
UNCTAD raises the concern that bilateral protective actions such as these can be contagious. Raising a protective barrier turns away sellers who must scramble for alternate buyers, price cutting inevitably ensues, new charges of dumping arise, and more barriers go up.
In its 2018 Key Statistics and Trends in Trade Policy, UNCTAD offers the U.S. Section 232 measures as an illustration of this dynamic. The tariffs exacerbate the problem of global oversupply and as a result contribute to lower prices. Aiming to fend off dumping in their domestic markets, several economies including the EU, India, Canada, Turkey, and South Africa initiated World Trade Organization (WTO) investigations to implement their own tariffs.
Indeed, retaliation by trade partners was among the costs of the Section 232 tariffs cited by critics, including Senate Finance Committee Chairman Orrin Hatch (R-Utah), who also expressed disappointment in the decision to impose tariffs that U.S. importers rather than foreign suppliers ultimately pay.
Tariffs are a double-edged sword, it seems, creating new winners and losers.
The American Iron and Steel Institute (AISI) credits the tariffs with starting the American steel industry on the road to recovery. AISI reported that, as of February 2019, capacity utilization at existing mills had increased to more than 80%, a level not reached in the last decade, and the U.S. steel market share claimed by imports had fallen from 29% in April 2018 to 29% as of February 2019.
In contrast, the Aluminum Association asserts that the Section 232 tariffs have had little impact on China’s aluminum overcapacity while trading partners essential to the U.S. industry’s growth, including Canada, bear the brunt.
At the same time, downstream manufacturers reliant on the tariffed imports have lined up to apply for exclusions to avoid the added overhead of duties. Not everyone gets a pass. According to an April 2, 2019, Congressional Research Service report, of nearly 70,000 steel exclusion requests filed, over 16,000 have been granted, some 46,000 denied. About 10,000 aluminum exclusion requests have been submitted, with 3,000 granted and 500 denied.
Related:
Blog coverage:
- Market Changers: U.S. Section 232 Aluminum and Steel Tariffs
- Playing Whack-a-Mole with US Steel Imports
Solutions and Resources:
-
- Refreshed every 10 days, our Steel Import Market Insight report is based on Datamyne US import data and provides comprehensive, in-depth intelligence about inbound flows of steel. Get a clear view of the buyers and sellers that make this dynamic market. Learn more >>
- Temporary tariffs and quotas such as those imposed by the U.S. under Section 232 are increasingly being used not only to resolve trade disputes, but as bargaining chips in trade negotiations. For businesses that operate internationally, the scope and pace of changes to Customs requirements can be bewildering. Descartes CustomsInfoTM Manager offers a practical solution with end-to-end enterprise software for up-to-date tariff classifications. Learn more >>
- Rapidly evolving trade policy and tariff instability are causing headaches for supply chain managers. Our Tariff Engineering Podcast discusses ways to restructure the chain to reclarify products and mitigate duty spend. Go to the podcast >>
Take a closer look at the effects of the China-U.S. trade war and strategies to diversify supply chains to moderate risks and boost resilience in our White Paper: Targeting New Opportunities Amid Shifting Trade Policy the Sourcing and Diversification. Download the white paper >>